[Preprint]. 2025 Jun 23:rs.3.rs-6771517.
doi: 10.21203/rs.3.rs-6771517/v1.

P2RX7 regulates tauopathy progression via tau and mitochondria loading in extracellular vesicles

Affiliations

P2RX7 regulates tauopathy progression via tau and mitochondria loading in extracellular vesicles

Tsuneya Ikezu et al. Res Sq. .

Abstract

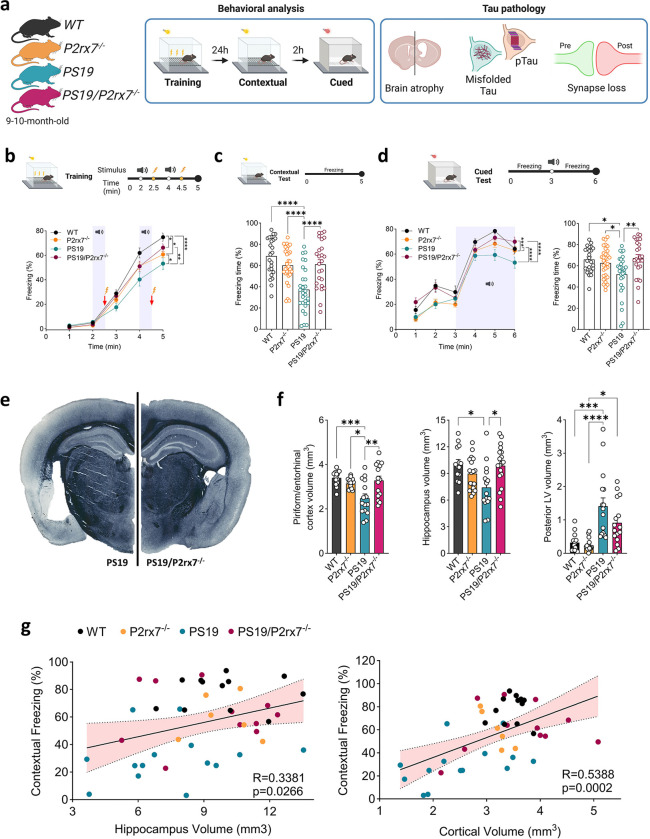
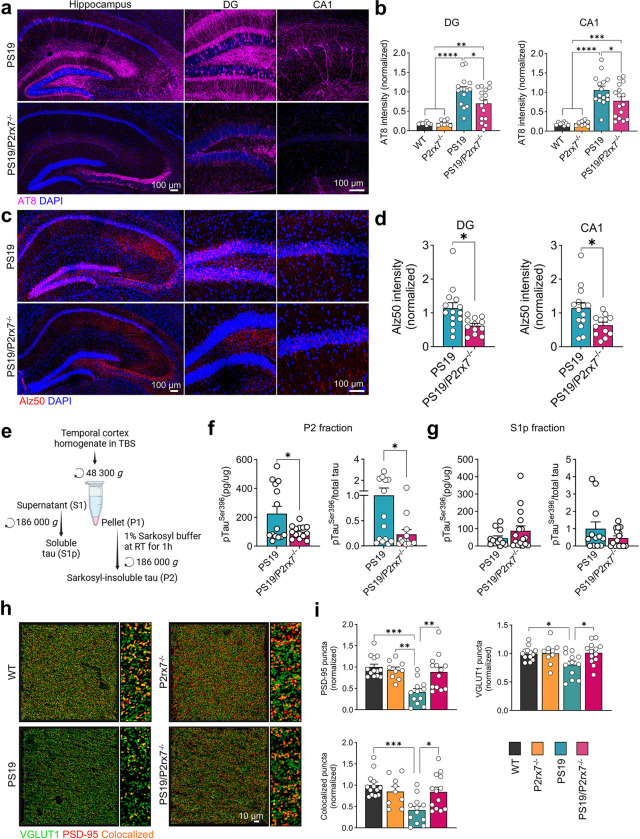
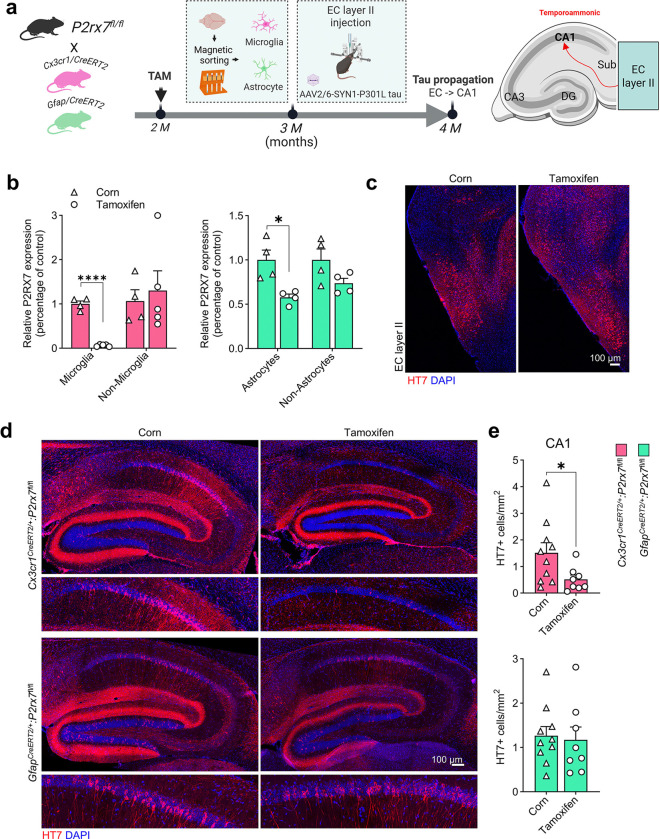
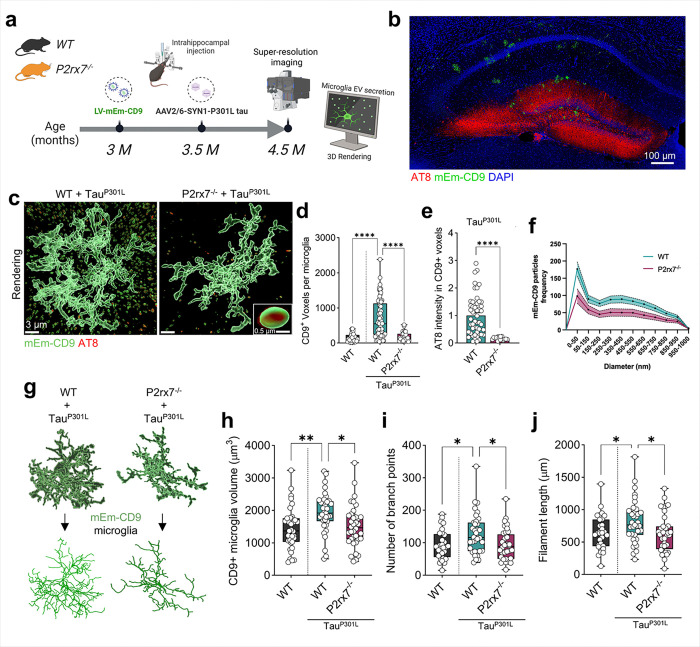
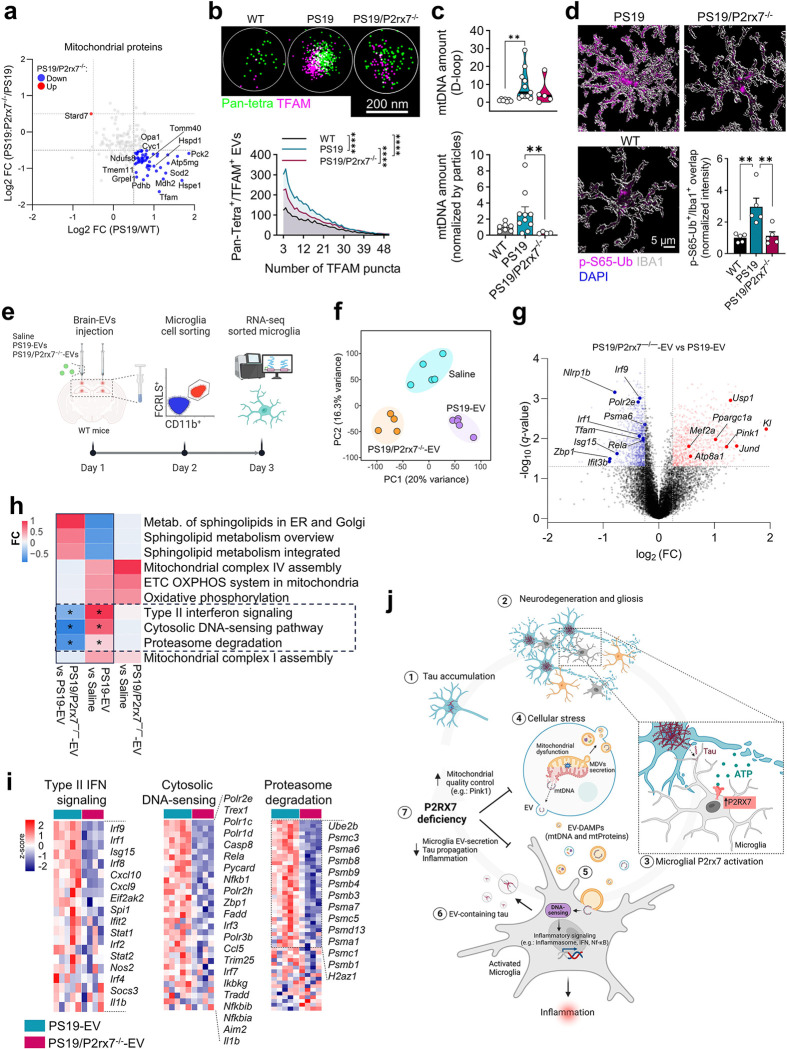
P2x purinoreceptor 7 (P2RX7), an ATP-gated ion channel, is known to play pivotal roles in the progression of Alzheimer's disease (AD), although its cell type-specific pathological mechanisms have yet to be elucidated. Here, we show that genetic deletion of P2rx7 mitigates brain atrophy, tau accumulation and cognitive impairment in PS19 tauopathy mice. Specific deletion of P2rx7 in microglia, but not astrocytes, significantly suppresses tau propagation from the entorhinal cortex to CA1 in the hippocampus, an early event in AD pathology. Single-cell (sc)-RNA sequencing of mouse brains revealed specific P2rx7 expression in microglia, inducing inflammatory changes accompanied by elevated extracellular vesicles (EVs) secretion in PS19 mice. Brain-derived EVs (BDEVs) proteome demonstrated that P2RX7 increases EV cargo loading of tau and mitochondrial molecules in BDEVs from PS19 mice, which was further validated by single-molecule super-resolution. Notably, following the injection of BDEVs isolated from PS19 mice with or without P2rx7 deficiency, the microglial transcriptome of recipient mice revealed enriched DNA-sensing and type II interferon signaling in response to BDEVs from PS19 mice, which was diminished in the group injected with P2rx7-deficient BDEVs. Thus, our results indicate that P2RX7 regulates EV-mediated tau and mitochondrial transfer and inflammatory activation in microglia with increased EV secretion, thereby contributing to tauopathy and neurodegeneration, highlighting the therapeutic potential of targeting the P2RX7-EV axis in AD.

Keywords: Alzheimer’s disease; P2X purinoceptor 7; extracellular vesicles; microglia; microtubule-associated protein tau; mitochondria; tauopathy.


Conflict of interest statement

Competing interest The authors declare no competing interests.

Figures

Figure 1
Figure 1. P2rx7 deficiency protects against cognitive impairment and neurodegeneration in PS19 tau transgenic mice.
a, Schematic design for evaluating the effects of P2rx7 on tau pathology in 9–10-month-old PS19 mice. b-d, Effects of P2rx7 genetic ablation on memory impairment in PS19 mice in the contextual (c) and cued (d) fear conditioning tests (n= 23 WT mice, n= 30 P2rx7−/− mice, n= 28 PS19 mice, n= 25 PS19/P2rx7−/− mice; one-way ANOVA with Holm–Šidák post hoc analysis). e, Representative images of PS19 and PS19/P2rx7−/− mouse brain sections stained with Sudan black. f-h, Volumetric analysis of piriform/entorhinal cortex (n= 14 WT mice, n= 15 P2rx7−/− mice, n= 15 PS19 mice, n= 15 PS19/P2rx7−/− mice), hippocampus (n= 14 WT mice, n= 18 P2rx7−/− mice, n= 15 PS19 mice, n= 19 PS19/P2rx7−/− mice), and posterior lateral ventricle (LV) (n= 13 WT mice, n= 16 P2rx7−/− mice, n= 16 PS19 mice, n= 16 PS19/P2rx7−/− mice); one-way ANOVA with Holm–Šidák post hoc analysis. g, Correlations between contextual freezing memory and hippocampal and cortical (piriform/entorhinal cortex) volumes (n= 43; Pearson correlation analysis). All bar graphs represent the mean ± SEM; *P < 0.05, **P < 0.01 and ****P < 0.0001.
Figure 2
Figure 2. P2rx7 deficiency attenuates tau pathology in PS19 mice.
a-d, Representative images and quantification of phosphorylated tau (AT8, a, b) (n= 8 WT mice, n= 8 P2rx7−/− mice, n= 15 PS19 mice, n= 16 PS19/P2rx7−/− mice; one-way ANOVA with Holm–Šidák post hoc analysis) and misfolded tau (Alz50, c, d) (n= 14 PS19 mice, n= 12 PS19/P2rx7−/− mice; two-tailed Student’s t test) in the DG and CA1 hippocampus areas of 9–10-month-old mice. e-g, ELISA measurement of human pTau-Ser396 in sarkosyl-insoluble (P2) (n= 12 PS19 mice, n=16 PS19/P2rx7−/− mice) and soluble (S1p) (n= 14 PS19 mice, n= 14 PS19/P2rx7−/− mice) fractions isolated from the temporal cortex of PS19 and PS19/P2rx7−/− mice; two-tailed Student’s t test. h, Representative confocal images and quantification of the hippocampal CA1 Vglut1 and PSD95 colocalized synaptic puncta after 3D rendering using Imaris (n= 13 WT mice, n= 9 P2rx7−/− mice, n= 12 PS19 mice, n= 13 PS19/P2rx7−/− mice; one-way ANOVA with Holm–Šidák post hoc analysis). All bar graphs represent the mean ± SEM; *P < 0.05, **P < 0.01, ***P < 0.001 and ****P < 0.0001. DG: Dentate gyrus, CA1: Cornu ammonis 1.
Figure 3
Figure 3. Cell type-specific deletion of P2rx7 in microglia halts tau propagation from the entorhinal cortex to the hippocampal CA1 region.
a, Schematic design for evaluating the effect of P2rx7 conditional knockout (cKO) on tau propagation in the mouse brain. P2rx7fl/fl mice were crossed with Cx3cr1CreERT2 and GfapCreERT2 mice, and tamoxifen induction of Cre recombinase at 2 months of age. At 3 months of age, mice were injected with AAV2/6-SYN1-P301L tau in the entorhinal cortex (EC) layer II for mutant human tau (TauP301L) expression in neurons. After 1 month of incubation, human tau propagation to the hippocampal CA1 region was assessed. b, Conditional knockout validation of P2rx7 expression levels by RT–qPCR in microglia and astrocytes isolated from mice incubated for 1 month after tamoxifen injection (n= 4 Cx3cr1-CreERT2 + Corn mice, n= 5 Cx3cr1-CreERT2 + Tamoxifen mice, n= 4 Gfap-CreERT2 + Corn mice, n= 4 Gfap-CreERT2 + Tamoxifen mice; two-tailed Student’s t test). c, Representative confocal images of human tau (HT7) staining in EC from 4-month-old mice injected with corn oil or tamoxifen. d, e, Representative confocal images of mouse hippocampi (d) and quantification of the number of HT7+ microglia and astrocytes in the hippocampal CA1 region of P2rx7cKO mice (e). The graphs present the total number of HT7+ cells in CA1 normalized by the HT7 intensity in the injected EC region (n= 10 Cx3cr1-CreERT2 + Corn mice, n= 8 Cx3cr1-CreERT2 + Tamoxifen mice, n= 10 Gfap-CreERT2 + Corn mice, n= 8 Gfap-CreERT2 + Tamoxifen mice; two-tailed Student’s t test). All bar graphs represent the mean ± SEM; *P < 0.05 and ****P < 0.0001. CA1: cornu ammonis 1.
Figure 4
Figure 4. P2rx7 deficiency ameliorates inflammatory microglial activation in PS19 mice.
a, Schematic design for bulk RNA-seq analysis of hippocampi from 9.5-month-old mice (n= 8 WT mice, n= 8 P2rx7−/− mice, n= 10 PS19 mice and n= 6 PS19/P2rx7−/− mice). b, Volcano plot showing DEGs between PS19 and WT mice (q-value < 0.05). c, Weighted gene co-expression network analysis (WGCNA) module correlations with key pathological phenotypes from PS19 mice (n= 8 WT mice, n= 8 P2rx7−/− mice, n= 10 PS19 mice and n= 6 PS19/P2rx7−/− mice). d, Comparison of the first principal component of each module (eigengene) per genotype using the top 6 significantly correlated modules with at least one phenotype (n= 8 WT mice, n= 8 P2rx7−/− mice, n= 10 PS19 mice and n= 6 PS19/P2rx7−/− mice; Kruskal–Wallis test with Wilcoxon test post hoc analysis). e, Volcano plot showing DEGs between PS19/P2rx7−/− and PS19 mice in the MEblue module (n= 10 PS19 mice, n= 6 PS19/P2rx7−/− mice; q-value < 0.05). f, Gene set enrichment analysis (GSEA) of the top pathways regulated in PS19/P2rx7−/− versus PS19 mice in the MEblue module (n= 10 PS19 mice, n= 6 PS19/P2rx7−/− mice). g, Representative confocal images and 3D rendering of microglial IBA1 and CD68 staining in the DG hippocampus. h, IBA1 volume and CD68/IBA1 colocalized volume were measured using Imaris (n= 7 WT mice, n= 8 P2rx7−/− mice, n= 9 PS19 mice, n= 9 PS19/P2rx7−/− mice; one-way ANOVA with Holm–Šidák post hoc analysis). All bar graphs represent the mean ± SEM; *P < 0.05, **P < 0.01, ***P < 0.001 and ****P < 0.0001.
Figure 5
Figure 5. P2RX7 regulates tauopathy-induced conversion of microglia to an inflammatory phenotype.
a, Uniform manifold approximation and projection (UMAP) plot representation of microglial subclusters. b, Stacked bar plot showing the subcluster compositions of microglia in WT, PS19 and PS19/P2rx7−/−. c, UMAP representation of microglial subclusters across genotypes. Subcluster annotation is indicated by the colors shown in b. d, Box and whisker plot comparing microglial subclusters among genotypes. e, Phenotypic trajectory analysis of microglia obtained by unbiased pseudotime ordering using Monocle3. The dashed lines are colored according to each cluster, as shown in a. f, Normalized average expression showing the expression of P2rx7 in microglial subclusters. g, Selection of the top DEGs and homeostatic genes enriched in each cluster. h, Number of DEGs regulated by P2rx7 deficiency in each microglial cluster in PS19 mice. i, Volcano plot showing DEGs regulated in FRM cluster from PS19/P2rx7−/− mice. j, Ingenuity pathway analysis (IPA) of canonical pathways in FRM cluster from PS19/P2rx7−/− mice. k, IPA of the top predicted upstream regulators in FRM cluster from PS19/P2rx7−/− mice. l, Normalized average expression of inflammatory and EV genes in InfM cluster. m, UMAP plot representation of Cd9 expression in microglia clusters InfM (orange), DAM (magenta) and IRM (red). All bar graphs represent the mean ± SEM; *P < 0.05, **P < 0.01 and ***P < 0.001.
Figure 6
Figure 6. P2rx7 deficiency suppresses EV secretion from activated microglia induced by tau pathology in vivo.
a, Experimental scheme for lentivirus expression of mEmerald-CD9 in microglia and AAV2/6-SYN1-P301L tau expression of P301L tau (TauP301L) in neurons in the hippocampal DG region from WT and P2rx7−/− mice. b, Representative images of mEm-CD9+ microglia and p-Tau (AT8) in the hippocampi of injected mice. c-f, In situ analysis of mEm-CD9+/AT8+ microglial EV secretion and estimated EV size distribution rendered by Imaris (n= 6–9 microglia per mouse; n= 4 WT mice, n= 4 WT-TauP301L mice, n= 5 P2rx7−/−-TauP301L; one-way ANOVA with Holm–Šidák post hoc analysis). g-j, Volume, ramification and filament analysis of mEm-CD9+ microglia from WT and P2rx7−/− mice expressing TauP301L (n= 6–9 microglia per mouse, n= 4 WT mice, n= 4 WT-TauP301L mice, n= 5 P2rx7−/−-TauP301L; one-way ANOVA with Holm–Šidák post hoc analysis). All bar graphs represent the mean ± SEM; *P < 0.05, **P < 0.01 and ****P < 0.0001.
Figure 7
Figure 7. P2rx7 deficiency dampens pathological EV secretion and EV-protein network associated with disease phenotypes in PS19 mice.
a, Schematic design for BDEV isolation from mice for nanoflow cytometry analysis and data-independent acquisition (DIA) mass spectrometry. b, Representative cryo-EM images of BDEVs isolated from the brains of 9.5-month-old mice. c, Western blot analysis of the brain and BDEV lysates from WT, PS19 and PS19/P2rx7−/− mice for common EV (Alix, CD81 and ANXA2) and non-EV (GM130 and EEA1) protein markers. d-f, Nanoflow cytometry analysis of BDEV size distribution (d and e) and particle concentration (f) (n= 6 WT mice, n= 6 PS19 mice, n=4 PS19/P2rx7−/− mice; one-way ANOVA with Holm–Šidák post hoc analysis). g, Venn diagram displaying the number of BDEV proteins found per group (n= 5 mice per group). h, Tau protein abundance in BDEVs quantified by mass spectrometry analysis. i, Venn diagram and enriched pathway terms of differentially expressed proteins recovered by P2rx7 deficiency in PS19 mice. j, BDEV protein module correlations with the main disease phenotypes. k, Comparison of the first principal component of each module (eigenprotein) by genotype using the top 4 significantly correlated modules (n= 5 WT mice, n= 5 PS19 mice and n= 5 PS19/P2rx7−/− mice; Kruskal–Wallis test with Wilcoxon test post hoc analysis). Gene Ontology (GO) annotation was performed with the main DEPs from each module. All bar graphs represent the mean ± SEM; *P < 0.05, **P < 0.01, ***P < 0.001 and **** or # P < 0.0001.
Figure 8
Figure 8. P2rx7 deficiency suppresses the activation of DNA-sensing/IFN signaling in microglia by reducing EV-mediated secretion of toxic mitochondrial molecules in mice with tauopathy.
a, Volcano plot showing the regulation of mitochondrial proteins in BDEVs from PS19 and PS19/P2rx7−/− mice (n= 5 mice per group). b, Single-molecule fluorescence analysis of TFAM on Pan-tetra+ EVs (CD63/CD81/CD9) was performed at the single-EV level via the CODI platform from ONI (n= 4 mice per group; two-way ANOVA with Holm–Šidák post hoc analysis). c, qPCR quantification of mtDNA (D-loop) in BDEVs normalized to WT-EVs (top) or EV particles (bottom) (n= 7 WT mice, n= 10 PS19 mice and n= 5 PS19/P2rx7−/− mice; Kruskal–Wallis test with Wilcoxon test post hoc analysis). d, 3D rendering of p-S65-Ub/IBA1 colocalized intensity measurements in the DG hippocampus area using Imaris (n= 5 WT mice, n= 5 PS19 mice, n= 5 PS19/P2rx7−/− mice; one-way ANOVA with Holm–Šidák post hoc analysis). e, Schematic of PS19, PS19/P2rx7−/− BDEV or saline injection into the cortex and hippocampus of 9.5-month-old WT mice followed by microglia sorting and RNA-seq. f, Principal component analysis (PCA) of the transcriptome of microglia isolated from WT mice injected with BDEVs or saline (n= 5 saline, n= 5 PS19 BDEVs and n= 4 PS19/P2rx7−/− BDEVs). g, Volcano plot showing DEGs regulated in microglia isolated from WT mice injected with PS19/P2rx7−/− BDEVs versus those injected with PS19 BDEVs (n= 5 PS19 BDEVs and n= 4 PS19/P2rx7−/− BDEVs, q-value < 0.05). h, Heatmap comparison of the top 10 pathways significantly regulated in microglia from WT mice injected with PS19 BDEVs (P < 0.05). i, Heatmap showing microglial regulation of the components of type II interferon (IFN) signaling, cytosolic DNA-sensing and proteasome degradation pathways by PS19-EVs and PS19/P2rx7−/− BDEVs. j, Schematic summary of the contribution of the microglia-P2RX7-EV axis to tau pathology. The accumulation of phosphorylated tau aggregates leads to the disruption of neuronal function (1). Degenerative neurons can promote the activation of glial cells (2), especially microglia expressing P2rx7, through the sustained release of ATP (3). Mitochondrial dysfunction can result from a high demand for energy, high levels of ROS generation and unpaired mitochondrial quality control induced by tau pathology, leading to mtDNA leakage and the secretion of mitochondrial-derived vesicles (MDVs) and EVs containing damaged molecules (4). EVs containing damaged mitochondrial molecules activate the inflammatory signaling response in microglia via the recognition of damage-associated molecular patterns (DAMPs; e.g., mtDNA and oxidized proteins) by cytosolic sensors associated with the innate immune response (5). Microglia are phagocytic cells that can uptake and secrete p-tau into the extracellular environment through EVs, a mechanism exacerbated during inflammation, contributing to tau propagation (6). P2rx7 deficiency improves mitochondrial quality control mechanisms and reduces the amount of mitochondrial cargo in EVs secreted in the brain parenchyma of tauopathy mice, resulting in fewer toxic EVs, lowering the inflammatory response from microglia and reducing the propagation of pathological tau originated from neurons (7). Taken together, these findings indicate that P2RX7 plays an important role in mediating microglial EV secretion, the inflammatory response and tau propagation in tau pathology models. All bar graphs represent the mean ± SEM; *P < 0.05, **P < 0.01 and ****P < 0.0001.

References

    1. Hardy J. & Selkoe D.J. The amyloid hypothesis of Alzheimer’s disease: progress and problems on the road to therapeutics. Science 297, 353–356 (2002). - PubMed
    1. Malpetti M., Joie R. & Rabinovici G.D. Tau Beats Amyloid in Predicting Brain Atrophy in Alzheimer Disease: Implications for Prognosis and Clinical Trials. J Nucl Med 63, 830–832 (2022). - PMC - PubMed
    1. Samudra N., Lane-Donovan C., VandeVrede L. & Boxer A.L. Tau pathology in neurodegenerative disease: disease mechanisms and therapeutic avenues. J Clin Invest 133 (2023). - PMC - PubMed
    1. Leng F. & Edison P. Neuroinflammation and microglial activation in Alzheimer disease: where do we go from here? Nat Rev Neurol 17, 157–172 (2021). - PubMed
    1. Kinney J.W., et al. Inflammation as a central mechanism in Alzheimer’s disease. Alzheimers Dement (N Y) 4, 575–590 (2018). - PMC - PubMed

Publication types

LinkOut - more resources