. 2025 Jun 29:51:889-908.
doi: 10.1016/j.bioactmat.2025.06.042. eCollection 2025 Sep.

Inhibition of neuronal necroptosis via disruption of RIPK1-RIPK3 Interactions: The role of neural stem cell-derived exosomes in spinal cord injury recovery

Affiliations

Inhibition of neuronal necroptosis via disruption of RIPK1-RIPK3 Interactions: The role of neural stem cell-derived exosomes in spinal cord injury recovery

Shiming Li et al. Bioact Mater. .

Abstract

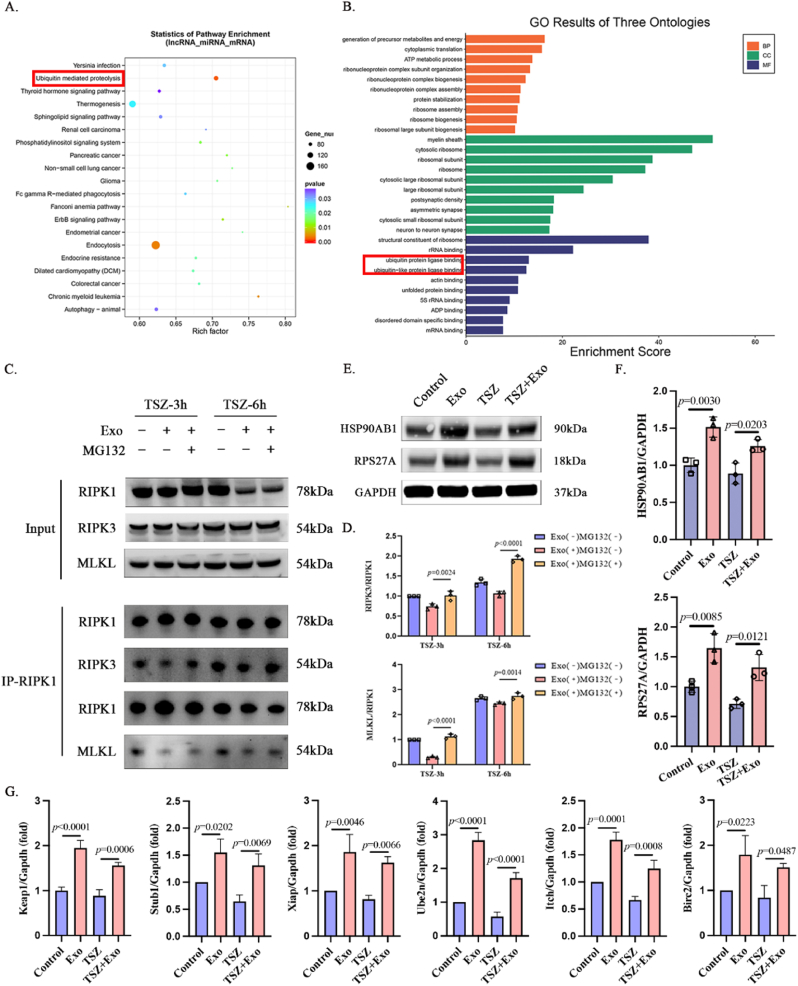
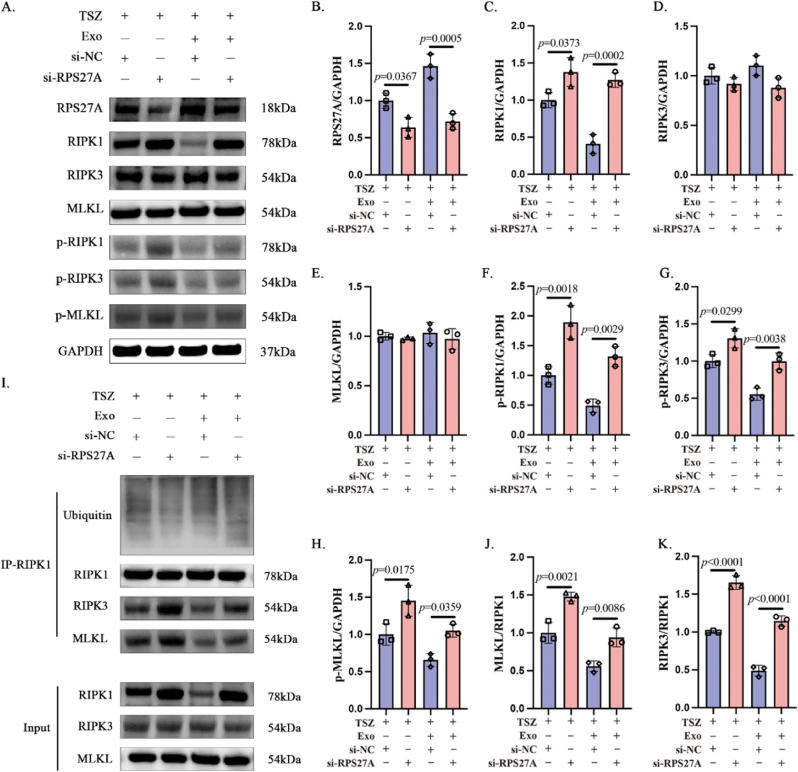
Spinal cord injury (SCI) poses a significant economic and public health burden. Exosomes derived from neural stem cells (NSC-Exos) are emerging as a promising therapeutic strategy for SCI repair, overcoming several limitations associated with both autologous and allogeneic neural stem cell therapies. This study demonstrates that NSC-Exos are efficiently internalized by the injured spinal cord after co-injection, resulting in substantial motor function recovery in murine models. Additionally, NSC-Exos effectively limit the expansion of the injury site, reduce neuronal degeneration, and attenuate neuroinflammatory responses. Notably, this is the first study to identify necroptosis as a novel therapeutic target for NSC-Exos in SCI recovery. We show that NSC-Exos inhibit neuronal necroptosis both in vivo and in vitro by disrupting the RIPK1-RIPK3 interaction, thereby preventing necrosome assembly. Furthermore, comprehensive transcriptomic analysis reveals that the ubiquitin-mediated proteolysis (UPS) pathway plays a crucial role in this process, a finding supported by experimental inhibition of ubiquitination. In conclusion, this study highlights the therapeutic potential of NSC-Exos in SCI treatment, particularly through the inhibition of necroptosis via disruption of the RIPK1-RIPK3 interaction, potentially involving UPS activation. These findings provide a foundation for future investigations into the molecular mechanisms underlying SCI recovery.

Keywords: Exosomes; Necroptosis; Necrosomes; Neural stem cells; Spinal cord Injury.


Conflict of interest statement

The authors declare that they have no known competing financial interests or personal relationships that could have appeared to influence the work reported in this paper.

Figures

Image 1
Graphical abstract
Figure-1
Figure-1
Combined epidural and intravenous injections resulted in a higher accumulation of NSC-Exos in the injured spinal cord. A. Representative images of morphological features of NSCs under light microscopy and representative images of immunofluorescence staining of NSCs, where SOX2 is green and NESTIN is red. Cell nuclei were stained using DAPI. B. Morphological characteristics of primary neuronal cells under light microscope and immunofluorescence staining of primary neuronal cells showing expression of MAP2 (green) and NeuN (red). Cell nuclei were stained using DAPI. C. Representative transmission electron microscopy images of morphological features in NSC-Exos. D. NSC-Exos particle size distribution was measured by Nano-flow cytometry. E. Western blotting for detection of NSC-Exos-associated marker proteins. F. Schematic diagram of mice SCI model construction and schematic representation of the two NSC-Exos delivery methods. G.H. IVIS images and fluorescence intensity analysis of ROI region of in vivo mice 24 h after SCI with different modalities of NSC-Exos (DIR labeling) injection, the fluorescence radiant efficiency of color scale ranges from 2 × 107 to 8 × 107.
Figure-2
Figure-2
NSC-Exos promoted recovery following SCI. A. Schematic diagram of the relevant experimental protocol for in vivo mice. B.C. BMS scores and subscores at different time points after injury in the Sham, SCI and SCI + Exo groups. n = 5, values are expressed as mean ± SD. Two-factor repeated measures ANOVA with Bonferroni's post hoc correction for multiple comparisons were used. p < 0.05 was statistically significant for the SCI + Exo group vs. the SCI group. D. Representative images of hind limbs and walking footprints of mice 14 days after SCI (black for front paw prints; red for hind paw prints). E. Representative images of MEPs recorded 28 days after SCI in the Sham, SCI, and SCI-Exo groups. The black arrow shows the time of cortical electrode discharge. F. Schematic diagram of the mouse MEPs experiment. G. Latency and amplitudes were quantified and statistically analyzed. n = 6, values are expressed as mean ± SD. One-way repeated measures ANOVA with Bonferroni's post hoc correction for multiple comparisons. ns p > 0.05. p < 0.05 was statistically significant. H. Gross morphology of mouse spinal cord tissue. I. Representative image of HE-stained coronal position of mouse spinal cord, in which the damaged area was shown in the black dotted line. J. Representative image of HE-stained transverse section of mouse spinal cord. K. Representative image of Nissl-stained transverse section of mouse spinal cord. Black arrows are representative staining of neurons, and red arrows are representative staining of glial cells, which were not included in the neuronal count. L. The number of nerves and average size were quantified and statistically analyzed in randomly selected images of the junction of the injury area (the injury area accounted for 1/2 of the whole image), respectively. n = 3, values are expressed as mean ± SD. Comparisons between the Sham group and SCI at different time points were analyzed by one-way repeated measures ANOVA with Bonferroni's post hoc correction for multiple comparisons. Compared with the Sham group, ∗∗p < 0.01, ∗∗∗p < 0.001, ∗∗∗∗p < 0.0001. Unpaired t-test was used to compare the SCI group with the SCI + Exo group at different time points, and p < 0.05 was statistically significant.
Figure-3
Figure-3
NSC-Exos attenuated necroptosis in the injured spinal cord. A. Representative images of immunofluorescence in the Sham group, SCI group and SCI + Exo group at 7 days after SCI, with IBA-1 in green and GFAP in red. Cell nuclei were stained using DAPI. B. Analysis of the mean fluorescence intensity of IBA-1 along the longitudinal direction of the spinal cord. C. D. GSEA of four modes of death in the area of injury (C) and around the area of injury (D) after spinal cord injury in mice, and genetic markers associated with necroptosis GESA. E. Western blotting of necroptosis-associated proteins in the PBS and Exo groups at different time points after SCI. F. Semiquantitative Western blotting analysis of necroptosis-associated proteins with expression normalized to GAPDH. n = 3, values are expressed as mean ± SD. Two-factor repeated measures ANOVA with Bonferroni's post hoc correction for multiple comparisons were used. p < 0.05 was statistically significant.
Fig. 4
Fig. 4
NSC-Exos attenuated neuronal necroptosis following SCI. A. Representative immunofluorescence images of SCI group and SCI + Exo group at 3,7 and 14 days after SCI, with the injury area on the upper side of dashed line. p-MLKL is green, NeuN is red, and the nuclei of the cells are DAPI stained. B-D. Representative immunofluorescence images of Sham group, SCI group and SCI + Exo group at 14 days after SCI, where p-RIPK1/p-RIPK3 is green, NeuN is red, and cell nuclei are DAPI stained. E. Statistical analysis of p-RIPK1/p-RIPK3/MLKL and NeuN double-positive cells. n = 3, values are expressed as mean ± SD. One-way repeated measures ANOVA with Bonferroni's post hoc correction for multiple comparisons were used. p < 0.05 was statistically significant.
Figure-5
Figure-5
NSC-Exos inhibited necroptosis in neurons in vitro. A.B. Cell death was assessed using the LDH release assay. n = 3, values are expressed as SD deviation. Two-factor (A) and one-factor (B) repeated measures ANOVA with Bonferroni's post hoc multiple comparison test were used, respectively. p < 0.05 was statistically significant. C. Representative transmission electron microscopy images of neurons in Sham, TSZ and TSZ + Exo groups. Black arrows are intact cell membranes, red arrows are intact nuclear membranes. D. Representative images of live-cell fluorescence imaging of neuronal uptake of NSC-Exos (DID-labeled, green) in vitro after cell necrosis (PI, red) conditions. Cell nuclei were stained using Hoechst. E. Co-localization scatter plot of DID (green fluorescence) and PI (red fluorescence). F. Representative images of CASPASE-8 (horizontal coordinates)/PI (vertical coordinates) double-stained flow cytometry of Control and Exo groups at different time points of TSZ. G. Quantitative flow cytometric analysis of CASPASE-8 negative/PI positive (Q1 quadrant). n = 3, values are expressed as mean ± SD. Two-factor repeated measures ANOVA with Bonferroni's post hoc correction for multiple comparisons were used. p < 0.05 was statistically significant.
Figure-6
Figure-6
NSC-Exos inhibited necroptosis by disrupting the interaction between RIPK1 and RIPK3. A. Western blotting of necroptosis-associated proteins in Control and Exo groups at different time points after TSZ. B. Semiquantitative Western blotting analysis of necroptosis-associated proteins with expression normalized to GAPDH. n = 3, values are expressed as mean ± SD. Two-factor repeated measures ANOVA with Bonferroni's post hoc correction for multiple comparisons were used. p < 0.05 was statistically significant. C. Control and Exo groups were immunoblotted for MLKL and RIPK3 oligomerized proteins at different time points after TSZ, including long exposure and short exposure. D. Control and Exo groups were immunoblotted for Western blotting with RIPK1 at different time points after TSZ. E. Semiquantitative Western blotting analysis of immunoprecipitated RIPK3 and MLKL s with expression normalized to RIPK1. n = 3, values are expressed as mean ± SD. Two-factor repeated measures ANOVA with Bonferroni's post hoc correction for multiple comparisons were used. p < 0.05 was statistically significant. F. Representative images of immunofluorescence of NSC-Exos (DID-labeled, light blue) in vitro after uptake of p-RIPK3 (green) and p-RIPK1 (red) co-expression. Cell nuclei were stained with DAPI.
Figure-7
Figure-7
NSC-Exos disrupted the interaction between RIPK1 and RIPK3 though the ubiquitin mediated proteolysis pathway. A. KEGG enrichment analysis of LncRNA-miRNA-mRNA. B. GO analysis of the transcriptome and proteome co-expression. C. Western blotting of RIPK1 immunoprecipitation. D. Semi-quantitative protein immunoblot analysis of immunoprecipitated RIPK3 and MLKL with expression normalized to RIPK1. n = 3, values are expressed as mean ± SD deviation. Two-factor repeated measures ANOVA with Bonferroni's post hoc multiple comparisons test was used. p < 0.05 is statistically significant. E. KEGG enrichment analysis of the transcriptome and proteome co-expression. E. Western blotting of HSP90AB1and RPS27A in Control, Exo, TSZ (6h) and TSZ (6h) + Exo. F. Semiquantitative Western blotting analysis of HSP90AB1 and RPS27A with expression normalized to GAPDH. n = 3, values are expressed as mean ± SD. Two-factor repeated measures ANOVA with Bonferroni's post hoc correction for multiple comparisons were used. p < 0.05 was statistically significant. G. qPCR analysis of partial ubiquitin ligases genes interacting with Hsp90ab1 and Rps27a with expression normalized to Gapdh in Control, Exo, TSZ (6h) and TSZ (6h) + Exo. n = 3, values are expressed as mean ± SD. Two-factor repeated measures ANOVA with Bonferroni's post hoc correction for multiple comparisons were used. p < 0.05 was statistically significant.
Figure-8
Figure-8
RPS27A-mediated RIPK1 ubiquitination underlies NSC-Exos-induced inhibition of RIPK1–RIPK3 interaction. A. Western blotting of RPS27A and necroptosis-associated proteins in TSZ and TSZ + Exo groups with RPS27A knockdown using siRNA B-H. Semiquantitative Western blotting analysis of RPS27A and necroptosis-associated proteins with expression normalized to GAPDH. n = 3, values are expressed as mean ± SD. Two-factor repeated measures ANOVA with Bonferroni's post hoc correction for multiple comparisons were used. p < 0.05 was statistically significant. I. TSZ and TSZ + Exo groups with RPS27A knockdown using siRNA were immunoblotted with RIPK1 for RIPK3, MLKL and ubiquitination of RIPK1. J.K. Semiquantitative Western blotting analysis of immunoprecipitated RIPK3 and MLKL s with expression normalized to RIPK1. n = 3, values are expressed as mean ± SD. Two-factor repeated measures ANOVA with Bonferroni's post hoc correction for multiple comparisons were used. p < 0.05 was statistically significant.

References

    1. Hu X., Xu W., Ren Y., Wang Z., He X., Huang R., Ma B., Zhao J., Zhu R., Cheng L. Spinal cord injury: molecular mechanisms and therapeutic interventions. Signal Transduct Target Ther. 2023;8:245. doi: 10.1038/s41392-023-01477-6. - DOI - PMC - PubMed
    1. Müller-Jensen L., Ploner C.J., Kroneberg D., Schmidt W.U. Clinical presentation and causes of non-traumatic spinal cord injury: an observational study in emergency patients. Front. Neurol. 2021;12 doi: 10.3389/fneur.2021.701927. - DOI - PMC - PubMed
    1. Alizadeh A., Dyck S.M., Karimi-Abdolrezaee S. Traumatic spinal cord injury: an overview of pathophysiology, models and acute injury mechanisms. Front. Neurol. 2019;10:282. doi: 10.3389/fneur.2019.00282. - DOI - PMC - PubMed
    1. Global, regional, and national burden of traumatic brain injury and spinal cord injury, 1990–2016: a systematic analysis for the global burden of disease study 2016. Lancet Neurol. 2019;18:56–87. doi: 10.1016/S1474-4422(18)30415-0. - DOI - PMC - PubMed
    1. Xue W., Fan C., Chen B., Zhao Y., Xiao Z., Dai J. Direct neuronal differentiation of neural stem cells for spinal cord injury repair. Stem Cell. 2021;39:1025–1032. doi: 10.1002/stem.3366. - DOI - PubMed

LinkOut - more resources