Meta-Analysis
. 2025 Jul 3:16:1621932.
doi: 10.3389/fendo.2025.1621932. eCollection 2025.

Association between gestational diabetes mellitus and risk of breast cancer: a systematic review and meta-analysis

Affiliations
Meta-Analysis

Association between gestational diabetes mellitus and risk of breast cancer: a systematic review and meta-analysis

Jing Li et al. Front Endocrinol (Lausanne). .

Abstract

Background: Gestational diabetes mellitus (GDM), a prevalent metabolic complication during pregnancy, has a global prevalence of approximately 14%. Its onset is closely associated with insulin resistance, insufficient compensatory function of β - cells, and abnormal placental function. Epidemiological studies have indicated that type 2 diabetes is an independent risk factor for breast cancer. However, the association between GDM and the risk of breast cancer remains controversial.

Objective: This systematic review and meta-analysis aim to comprehensively evaluate the association between GDM and the risk of breast cancer and explore its underlying mechanisms.

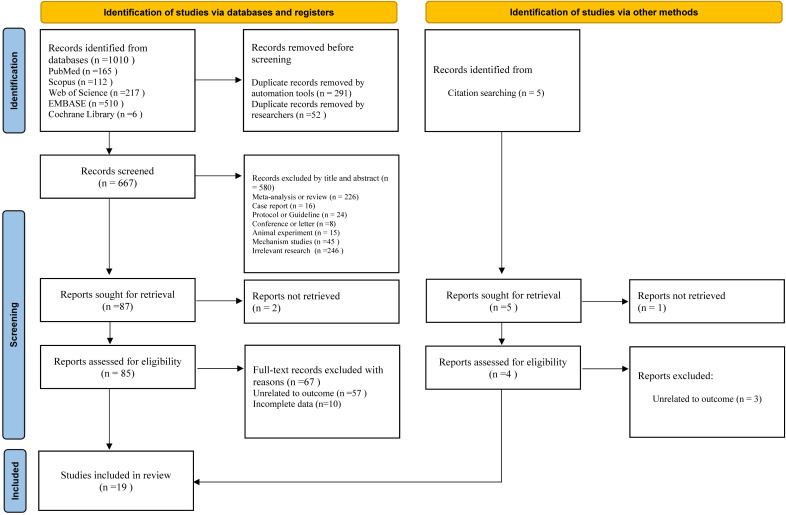
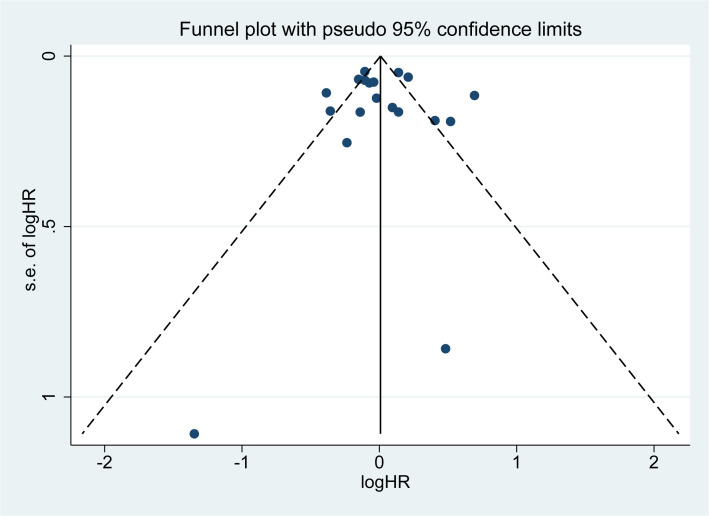
Methods: This study systematically searched PubMed, Web of Science, Scopus, EMBASE, and the Cochrane Library databases, covering the period from establishing each database until April 14, 2025. Two researchers extracted relevant data and assessed the quality of included studies using the Newcastle-Ottawa Scale. The study evaluated inter-study heterogeneity using the I² statistic. Based on the magnitude of heterogeneity, fixed-effect or random-effect models were employed to calculate the pooled hazard ratio (HR) and its corresponding 95% confidence interval (CI). Additionally, subgroup analyses, sensitivity analyses, funnel plot analyses, and publication bias assessments were performed. All data analyses were conducted using STATA 17 software.

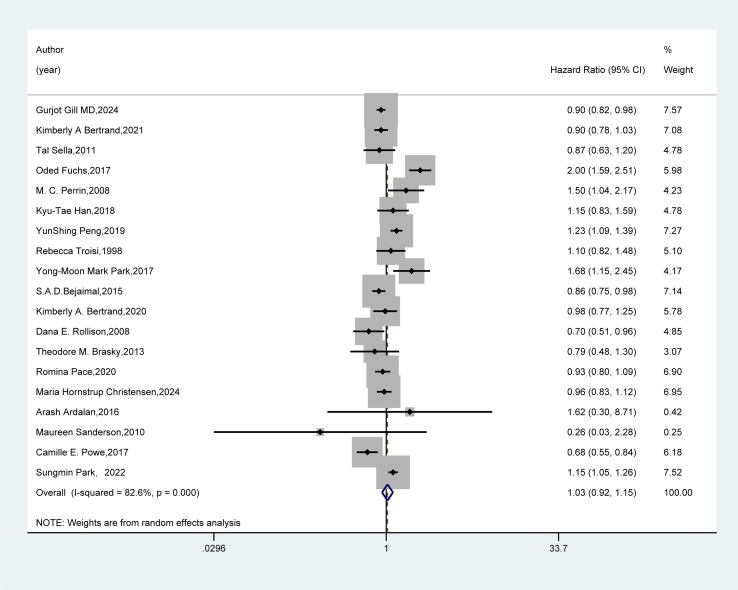
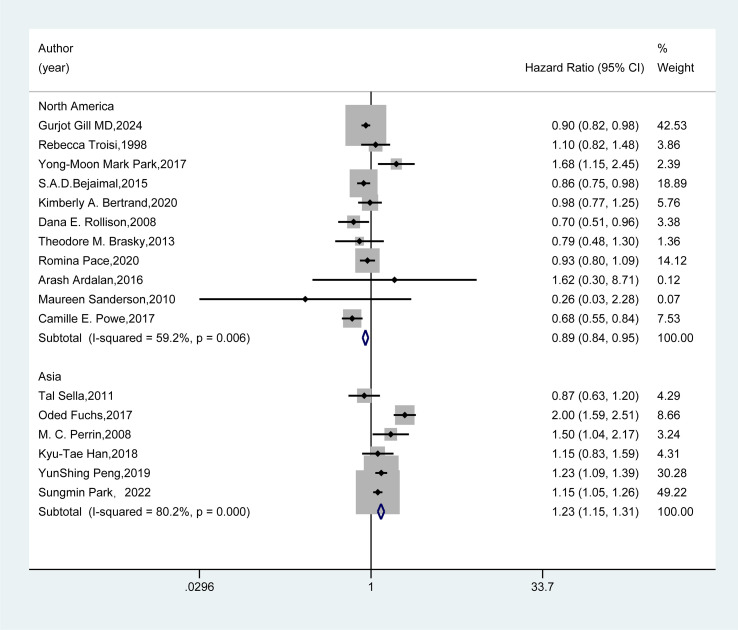
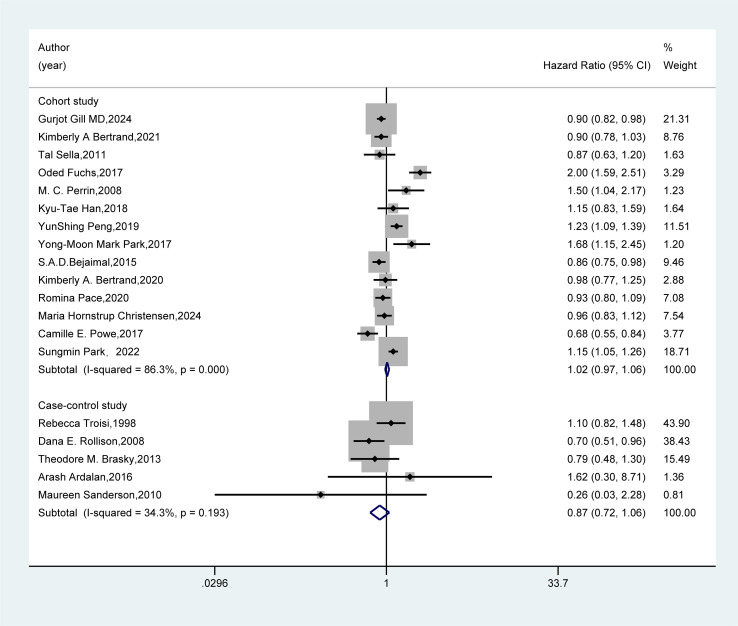
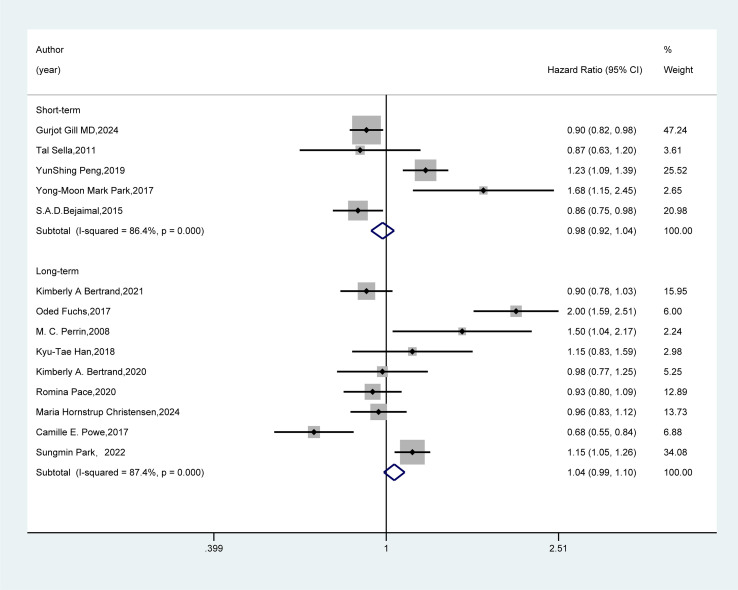
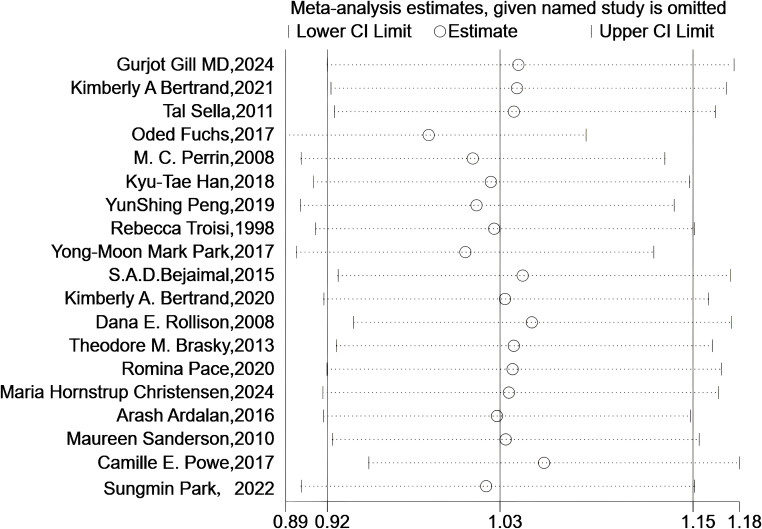
Results: The overall analysis revealed no significant association between GDM and breast cancer risk (HR=1.03, 95%CI: 0.92-1.15). However, subgroup analysis revealed significant regional heterogeneity: within the regional subgroups, North American results showed an association between GDM and a reduced breast cancer risk (HR=0.89, 95%CI: 0.84-0.95), whereas Asian findings suggested an association with an increased risk (HR=1.23, 95%CI: 1.15-1.31). No significant associations were observed in subgroups based on study design (cohort/case-control) or follow-up duration (short-term/long-term). Sensitivity analysis demonstrated robust results, and there was no publication bias in this study.

Conclusion: In summary, there is no significant association between GDM and breast cancer risk overall. However, notable regional heterogeneity exists: in the North American subgroup, GDM is associated with a reduced risk of breast cancer, while in the Asian subgroup, GDM is significantly associated with an increased risk of breast cancer.

Systematic review registration: https://www.crd.york.ac.uk/PROSPERO/, identifier CRD420251032589.

Keywords: PRISMA; breast cancer; gestational diabetes mellitus; meta-analysis; systematic review.


Conflict of interest statement

The authors declare that the research was conducted in the absence of any commercial or financial relationships that could be construed as a potential conflict of interest.

Figures

Figure 1
Figure 1
PRISMA flow diagram depicting the process of study selection for meta-analysis.
Figure 2
Figure 2
Forest plot of random-effects meta-analysis of the association between GDM and breast cancer risk. A random-effects model was used for the Meta-analysis to evaluate the hazard ratio (HR) and 95% confidence interval (CI) of the association between gestational diabetes mellitus (GDM) and breast cancer. A rectangle represented the HR value of each study, and the weight was marked on the right side (for example, the weight of Gurjot Gill MD, 2024 was 7.57%). The horizontal line indicated the range of the 95% CI. The diamond at the bottom represented the pooled effect size: HR = 1.03 (95% CI: 0.92 - 1.15). The heterogeneity test showed that 1-square (I²) = 82.6%, suggesting a high degree of heterogeneity among the studies. The weights were determined by the random-effects model, reflecting the contribution of each study to the pooled results.
Figure 3
Figure 3
Subgroup analysis - region. A random-effects model was employed for the Meta-analysis to assess the hazard ratio (HR) and 95% confidence interval (CI) of the association between gestational diabetes mellitus (GDM) and breast cancer in different regional subgroups. The HR value of each study was presented as a rectangle, with the weight marked on the right side. The horizontal line represented the range of the 95% CI. The diamond at the bottom represented the pooled effect size, and I² represented the degree of heterogeneity among the studies. The weights were determined by the random-effects model, reflecting the contribution of each study to the pooled results.
Figure 4
Figure 4
Subgroup analysis - study design. A random-effects model was used for the Meta-analysis to evaluate the hazard ratio (HR) and 95% confidence interval (CI) of the association between gestational diabetes mellitus (GDM) and breast cancer in the subgroup of cohort studies, while a fixed-effects model was employed for the evaluation of case-control studies. A rectangle represented the HR value of each study, and the weight was marked on the right side. The horizontal line indicated the range of the 95% CI. The diamond at the bottom represented the pooled effect size, and I² represented the degree of heterogeneity among the studies. The weights were determined by the random-effects model, reflecting the contribution of each study to the pooled results. If I² < 50%, it indicates non-significant heterogeneity, and a fixed-effects model should be used. If I² ≥ 50%, significant statistical heterogeneity is considered to exist, and a random-effects model should be selected.
Figure 5
Figure 5
Subgroup analysis - follow-up duration. Meta-analysis was performed using a random-effects model to assess the hazard ratio (HR) and 95% confidence interval (CI) of the association between GDM and breast cancer in different follow-up duration subgroups. A rectangle represented the HR value of each study, and the weight was marked on the right side. The horizontal line indicated the range of the 95% CI. The diamond at the bottom represented the pooled effect size, and I² represented the degree of heterogeneity among the studies. The weights were determined by the random-effects model, reflecting the contribution of each study to the pooled results.
Figure 6
Figure 6
Sensitivity analyses. Sensitivity analysis plot shows meta-analysis estimates when each named study is omitted. The circles represent the effect size estimates, and the horizontal lines denote the 95% confidence intervals (lower and upper limits). Each row corresponds to a study excluded one - by - one, illustrating how the overall meta-analysis result changes with the removal of individual studies.
Figure 7
Figure 7
Funnel plot. A small black dot represents a single study. If all the small black dots are symmetrically distributed, it can be considered that there is no significant publication bias in the results of the meta-analysis. Conversely, if they are not symmetrically distributed, significant publication bias exists.

Similar articles

References

    1. Xu P, Dong S, Wu L, Bai Y, Bi X, Li Y, et al. Maternal and placental DNA methylation changes associated with the pathogenesis of gestational diabetes mellitus. Nutrients. (2022) 15. doi: 10.3390/nu15010070 - DOI - PMC - PubMed
    1. Usman TO, Chhetri G, Yeh H, Dong HH. Beta-cell compensation and gestational diabetes. J Biol Chem. (2023) 299:105405. doi: 10.1016/j.jbc.2023.105405 - DOI - PMC - PubMed
    1. Buchanan TA, Xiang AH, Page KA, Watanabe RM. What is gestational diabetes - really? Diabetes. (2025). doi: 10.2337/dbi24-0041 - DOI - PMC - PubMed
    1. Sweeting A, Hannah W, Backman H, Catalano P, Feghali M, Herman WH, et al. Epidemiology and management of gestational diabetes. Lancet. (2024) 404:175–92. doi: 10.1016/S0140-6736(24)00825-0 - DOI - PubMed
    1. Martín-Estal I, Castorena-Torres F. Gestational diabetes mellitus and energy-dense diet: what is the role of the insulin/IGF axis? Front Endocrinol (Lausanne). (2022) 13:916042. doi: 10.3389/fendo.2022.916042 - DOI - PMC - PubMed

LinkOut - more resources