. 2025 Jul 16;13(7):e70637.
doi: 10.1002/fsn3.70637. eCollection 2025 Jul.

Piperine Enhances Mitochondrial Biogenesis to Mitigate Stress in SH-SY5Y Neuroblastoma Cells

Affiliations

Piperine Enhances Mitochondrial Biogenesis to Mitigate Stress in SH-SY5Y Neuroblastoma Cells

Nongluk Saikachain et al. Food Sci Nutr. .

Abstract

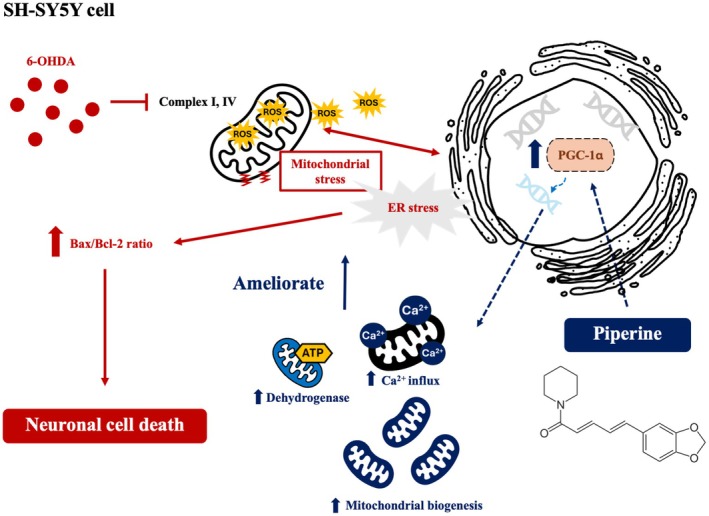
Mitochondrial dysfunction plays a crucial role in neurodegenerative disorders. Enhancing mitochondrial biogenesis is a promising therapeutic strategy for mitigating mitochondrial damage. Piperine, a bioactive alkaloid from black pepper, the fruit of Piper nigrum L. in the family Piperaceae, has demonstrated neuroprotective effects against mitochondrial stress. However, its effects on mitochondrial health remain unclear. This study investigated the effects of piperine on mitochondrial dynamics in SH-SY5Y neuronal cells. Our findings suggest that piperine enhances mitochondrial biogenesis by upregulating peroxisome proliferator-activated receptor gamma coactivator 1-alpha (PPARGC1A) mRNA and translocase of outer mitochondrial membrane 20 (TOM20) protein expression. Additionally, piperine improves Ca2+ transport within mitochondria and boosts mitochondrial metabolic activity without significantly altering mitochondrial morphology. Furthermore, piperine prevents 6-hydroxydopamine (6-OHDA)-induced cellular stress by alleviating the activation of Homo sapiens heat shock protein family A member 5 (HSPA5) and DNA damage inducible transcript 3 (DDIT3) mRNA expression and inhibiting the apoptotic Bcl-2-associated X protein (BAX) to B-cell lymphoma 2 (Bcl-2) pathway. Notably, this neuroprotective effect occurs independently of its antioxidative activity. Taken together, our results reveal a previously unexplored aspect of piperine's neuroprotective mechanism, highlighting its ability to enhance mitochondrial biogenesis and prevent mitochondrial stress in neuronal cells. Further studies, including in vivo investigations and long-term assessments, are warranted to explore the therapeutic potential for mitochondrial dysfunction in the central nervous system.

Keywords: mitochondria; mitochondrial dynamic; neurodegeneration; neuron; piperine.


Conflict of interest statement

The authors declare no conflicts of interest.

Figures

FIGURE 1
FIGURE 1
Piperine enhances mitochondrial biogenesis. (A) Bar graph represents the percentage of SHSY‐5Y cell viability compared to the control after incubating with piperine at the concentrations 5, 10, and 20 μM for 24 h across independent experiments. *p < 0.05 compared with the control group (one‐way ANOVA, n = 4 independent cell culture preparations). (B) Bright field images represent SHSY‐5Y morphology after incubating with 0 (control) and 20 μM of piperine for 24 h. (C) Fluorescent images representing an EdU and Hoechst staining of SH‐SY5Y cells in control, piperine at concentrations of 5, 10, 20 μM, and Growth media. (D) Bar graph represents a percentage of EdU‐positive cell in control, piperine at concentrations of 5, 10, 20 μM, and Growth media. *p < 0.05 compared with control group, one‐way ANOVA, n = 6 independent cell culture preparations. (E) Representative of TOM20 and β‐actin protein expression by Western blot analysis in control and piperine‐treated groups. (F) Bar graph represents normalized densitometric quantification of TOM20 relative to β‐actin, expressed as a fold change compared to the control, in both control and 20 μM of piperine‐treated groups across independent experiments. *p < 0.05 compared with control group, student's test, n = 4 independent cell culture preparations. (G) Bar graph represents normalized mRNA expression levels of PPARGC1A, expressed as a fold change compared to the control, in both control and 20 μM of piperine‐treated groups across independent experiments. *p < 0.05 compared with control group, Mann–Whitney test, n = 4 independent cell culture preparations.
FIGURE 2
FIGURE 2
Morphological analysis of mitochondria in SH‐SY5Y cells treated with piperine. (A) Schematic representation of morphology analysis of mitochondria using the Mitochondrial Network Analysis tool set (Valente et al. 2017). (B) Cumulative distribution of mitochondrial length in control (blue) and 20 μM piperine‐treated (green) groups. Two‐sample Kolmogorov–Smirnov test: D = 0.10, p = 0.10 for control (n = 258 mitochondrial object) vs. piperine (n = 318 mitochondrial object). (Inset) Bar graph representing the median of mitochondrial length in control (blue) and 20 μM piperine‐treated (green) groups. Student's t‐test p = 0.25, n = 3 independent cell culture preparations. (C) Representative of p‐DRP1, DRP1, OPA1, MFN2 and β‐actin protein expression by Western blot analysis in control and 20 μM piperine‐treated groups. (D) Bar graph represents normalized densitometric quantification of p‐DRP1 to total DRP1 (Mann–Whitney, p = 0.14, n = 5), OPA1 to β‐actin (Mann–Whitney, p = 0.13, n = 5) and MFN2 to β‐actin (Mann–Whitney, p = 0.64, n = 5 independent cell culture preparations), expressed as a fold change compared to the control, in both control and 20 μM of piperine‐treated groups across independent experiments.
FIGURE 3
FIGURE 3
Enhanced Oxo‐M induced Ca2+ transfer to mitochondria in piperine‐treated SH‐SY5Y cells. (A) Maximum intensity projection (MIP) images of Mitotracker‐ and Rhod‐2‐loaded SH‐SY5Y cells, showing control and 20 μM piperine‐treated groups at the baseline (before Oxo‐M application) and during Oxo‐M application. (B) Representative traces of Rhod‐2 fluorescence intensity from (A) recorded during Oxo‐M application (indicated by tick mark). (C) Bar graph represents average area under the curve (AUC) of Rhod‐2 fluorescence intensity per cell during Oxo‐M application, expressed as a fold change compared to the control, in both control and 20 μM of piperine‐treated groups across independent experiments. *p < 0.05 compared with a control group, Student's t‐test, n = 4 independent cell culture preparations.
FIGURE 4
FIGURE 4
Piperine prevents 6‐OHDA‐induced‐mitochondrial injury in SH‐SY5Y cells. (A) Cell viability assay in SH‐SY5Y cells treated with 6‐OHDA at concentrations ranging from 0 to 200 μM for 24 h. Cell viability was measured using the MTT assay. Data are representative of 3 independent cell culture preparations. (B) Bright‐field images showing SH‐SY5Y cell morphology in the following groups: control, 6‐OHDA, 6‐OHDA with piperine at concentrations of 5, 10, 20 μM, and 6‐OHDA + NAC. (C) Bar graph represents the percentage of SHSY‐5Y cell viability compared to the control across independent experiments in the following groups: control, 6‐OHDA, 6‐OHDA with piperine at concentrations of 5, 10, 20 μM, and 6‐OHDA + NAC groups. *p < 0.05 compared with 6‐OHDA group, one‐way ANOVA, n = 4 independent cell culture preparations. (D) Bar graph represents the percentage of SHSY‐5Y cell viability compared to the control across independent experiments in the following groups: control, H2O2, H2O2 with piperine at concentrations of 5, 10, 20 μM, and H2O2 + NAC groups. *p < 0.05 compared with H2O2 group, one‐way ANOVA, n = 3 independent cell culture preparations.
FIGURE 5
FIGURE 5
Piperine does not affect antioxidant properties in SH‐SY5Y cells. (A) Fluorescent images representing a TMRM staining of SH‐SY5Y cells in control, 6‐OHDA, 6‐OHDA with piperine at concentrations of 5, 10, 20 μM, and 6‐OHDA + NAC. (B) Bar graph represents percentage TMRM fluorescent intensity compared to the control across independent experiments in control, 6‐OHDA, 6‐OHDA with piperine at concentrations of 5, 10, 20 μM, and 6‐OHDA + NAC. *p < 0.05 compared with 6‐OHDA group, one‐way ANOVA, n = 3 independent cell culture preparations. (C) Bar graph represents normalized mitoSOX intensity as a fold change compared to the control across independent experiments in control, 6‐OHDA, 6‐OHDA with piperine at concentrations of 5, 10, 20 μM, and 6‐OHDA + NAC. *p < 0.05 compared with 6‐OHDA group, one‐way ANOVA, n = 6 independent cell culture preparations. (D) Bar graph representing a normalized DCFDA fluorescent intensity as a fold change compared to the control across independent experiments in control, 6‐OHDA, 6‐OHDA with piperine at concentrations of 5, 10, 20 μM, and 6‐OHDA + Trolox. *p < 0.05 compared with 6‐OHDA group, one‐way ANOVA, n = 3 independent cell culture preparations. (E) Bar graph representing a normalized DCFDA fluorescent intensity as a fold change compared to the control across independent experiments in control, H2O2 with piperine at concentrations of 5, 10, 20 μM, and H2O2 + NAC. *p < 0.05 compared with H2O2 group, one‐way ANOVA, n = 5 independent cell culture preparations. (F) Bar graph representing the relative mRNA expression levels as a fold change compared to the control across independent experiments of SOD1, CAT and GPX1 in control and 20 μM piperine‐treated group (student's test, n = 3 independent cell culture preparations).
FIGURE 6
FIGURE 6
Piperine does not affect antioxidant properties in SH‐SY5Y cells. (A) Bar graphs representing the relative mRNA expression levels as a fold change compared to the control across independent experiments of PINK1 (left), PRKN (middle) and SQSTM1 (right) in control, 20 μM piperine, 6‐OHDA and 20 μM piperine +6‐OHDA treated group (one‐way ANOVA, n = 4–5 independent cell culture preparations). (B) Bar graphs representing the relative mRNA expression as a fold change compared to the control across independent experiments levels of HSPA5 (left) and DDIT3 (right) in control, 20 μM piperine, 6‐OHDA and 20 μM piperine +6‐OHDA treated group (*p < 0.05, compared with 6‐OHDA treated group, one‐way ANOVA, n = 3–4 independent cell culture preparations). (C) Representative of BAX, Bcl‐2 and β‐actin protein expression as a fold change compared to the control across independent experiments by Western blot analysis in control, 20 μM piperine, 6‐OHDA,6‐OHDA +20 μM piperine, 6‐OHDA + NAC. (D) Bar graph represents a normalized densitometric quantification of Bax to Bcl‐2 as a fold change compared to the control across independent experiments in control, 20 μM piperine, 6‐OHDA and 20 μM piperine +6‐OHDA treated group (*p < 0.05 compared with control group, one‐way ANOVA, n = 5 independent cell culture preparations).
FIGURE 7
FIGURE 7
Mechanism by which piperine enhances mitochondrial biogenesis to ameliorate mitochondrial stress. A schematic illustrating piperine increases an expression mitochondrial biogenesis regulator PGC‐1α, leading to an increase in mitochondrial mass, enhanced mitochondrial Ca2+ influx and increased in mitochondrial metabolic enzyme. These effects ameliorate mitochondrial injury‐induced neuronal death caused by 6‐OHDA.

References

    1. Andreux, P. A. , Houtkooper R. H., and Auwerx J.. 2013. “Pharmacological Approaches to Restore Mitochondrial Function.” Nature Reviews. Drug Discovery 12, no. 6: 465–483. 10.1038/nrd4023. - DOI - PMC - PubMed
    1. Azam, S. , Park J. Y., Kim I. S., and Choi D. K.. 2022. “Piperine and Its Metabolite's Pharmacology in Neurodegenerative and Neurological Diseases.” Biomedicine 10, no. 1: 10010154. 10.3390/biomedicines10010154. - DOI - PMC - PubMed
    1. Barazzuol, L. , Giamogante F., Brini M., and Cali T.. 2020. “PINK1/Parkin Mediated Mitophagy, ca(2+) Signalling, and ER‐Mitochondria Contacts in Parkinson's Disease.” International Journal of Molecular Sciences 21, no. 5: 21051772. 10.3390/ijms21051772. - DOI - PMC - PubMed
    1. Bhatti, J. S. , Bhatti G. K., and Reddy P. H.. 2017. “Mitochondrial Dysfunction and Oxidative Stress in Metabolic Disorders ‐ A Step Towards Mitochondria Based Therapeutic Strategies.” Biochimica et Biophysica Acta, Molecular Basis of Disease 1863, no. 5: 1066–1077. 10.1016/j.bbadis.2016.11.010. - DOI - PMC - PubMed
    1. Bi, Y. , Qu P. C., Wang Q. S., et al. 2015. “Neuroprotective Effects of Alkaloids From <styled-content style="fixed-case"> Piper longum </styled-content> in a MPTP‐Induced Mouse Model of Parkinson's Disease.” Pharmaceutical Biology 53, no. 10: 1516–1524. 10.3109/13880209.2014.991835. - DOI - PubMed

LinkOut - more resources