

Genome-wide association study and haplotype analyses reveal the genetic architecture of agronomic traits and sugars in sweet sorghum
- PMID: 40678381
- PMCID: PMC12267045
- DOI: 10.3389/fgene.2025.1611863
Genome-wide association study and haplotype analyses reveal the genetic architecture of agronomic traits and sugars in sweet sorghum
Abstract
Introduction: Sweet sorghum is a C4 tropical grass species that has gained importance quickly as a major bioenergy crop.
Methods: This genome-wide association study (GWAS) utilized a sweet sorghum panel (SSP) of 183 diverse sweet sorghum accessions genotyped by 14,819 high-quality single-nucleotide polymorphism (SNP) markers to identify novel genetic loci that are associated with major agronomic traits and sugars (Brix units, %).
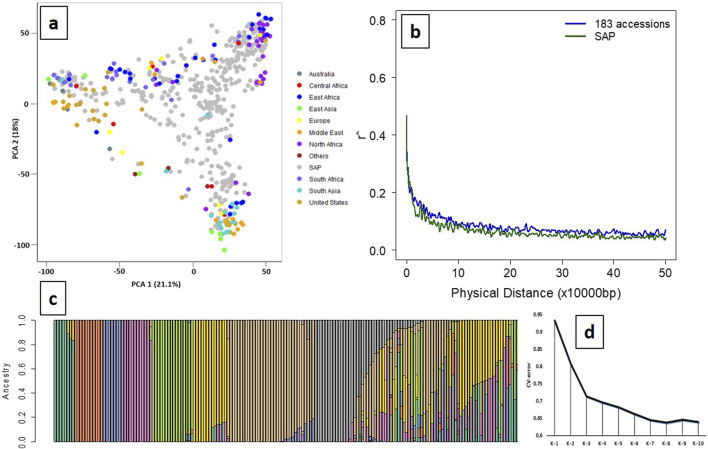
Results: Population stratification revealed a clear separation of the accessions based on geographical origins. The initial 50% linkage disequilibrium (LD) decay was approximately 5 kb, and the background level was approximately 80 kb, similar to that of the previously reported sorghum association panel (SAP), indicating the panel's effectiveness and reliability for GWAS. This study identified 21 significant quantitative trait nucleotides (QTNs) for the studied traits using the three (compressed)-variance component multi-locus random- SNP-effect mixed linear model (3VmrMLM), which were colocalized with previously reported quantitative trait loci (QTLs). The phenotypic variance (R2) explained by these QTNs ranged from 5.11% to 13.86%.
Discussion: Additionally, haplotype analysis revealed significant phenotypic differences between haplotypes for four candidate genes, namely, Sobic.006G128200 (a threonine-specific protein kinase gene) for days to flowering, Sobic.001G387600 (an ethylene-insensitive gene) for Brix, Sobic.003G069950 (a protein kinase domain gene), and Sobic.003G214400 (an amino acid transporter gene) for fresh biomass.
Keywords: Brix; GWAS; agronomic traits; haplotype analysis; sweet sorghum.
Copyright © 2025 Umar, Ramalingam, Sadia, Awan, Khan, Nasir, Bernardo, St. Amand, Bai, Prasad and Perumal.
Conflict of interest statement
The authors declare that the research was conducted in the absence of any commercial or financial relationships that could be construed as a potential conflict of interest.
Figures


References
-
- Allen T. T. (2019). Software overview and methods review: Minitab. Introduction to engineering statistics and lean six sigma: statistical quality control and design of experiments and systems. London: Springer. 10.1007/978-1-4471-7420-2_24 - DOI
-
- Almodares A., Hadi M. R. (2009). Production of bioethanol from sweet sorghum: a review. Afr. J. Agric. Res. 4, 772–780.
-
- Anami S. E., Zhang L. M., Xia Y., Zhang Y. M., Liu Z. Q., Jing H. C. (2015). Sweet sorghum ideotypes: genetic improvement of the biofuel syndrome. Food. Energy. secur. 4, 159–177. 10.1002/fes3.63 - DOI
LinkOut - more resources
Full Text Sources
Research Materials
Miscellaneous