. 2025 Jun;15(6):101275.
doi: 10.1016/j.jpha.2025.101275. Epub 2025 Mar 21.

Adaptive multi-view learning method for enhanced drug repurposing using chemical-induced transcriptional profiles, knowledge graphs, and large language models

Affiliations

Adaptive multi-view learning method for enhanced drug repurposing using chemical-induced transcriptional profiles, knowledge graphs, and large language models

Yudong Yan et al. J Pharm Anal. 2025 Jun.

Abstract

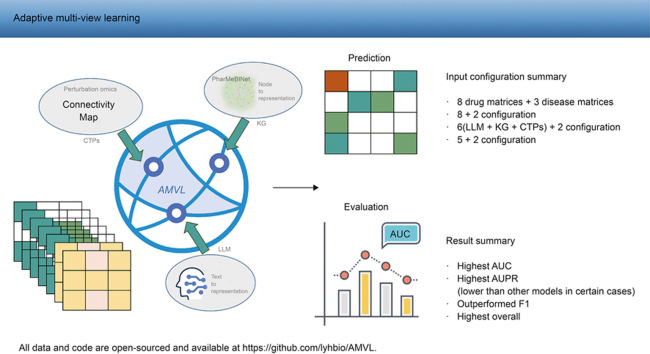
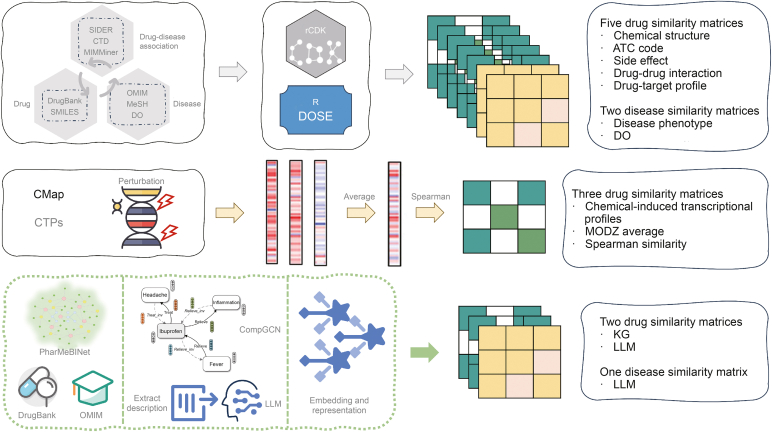
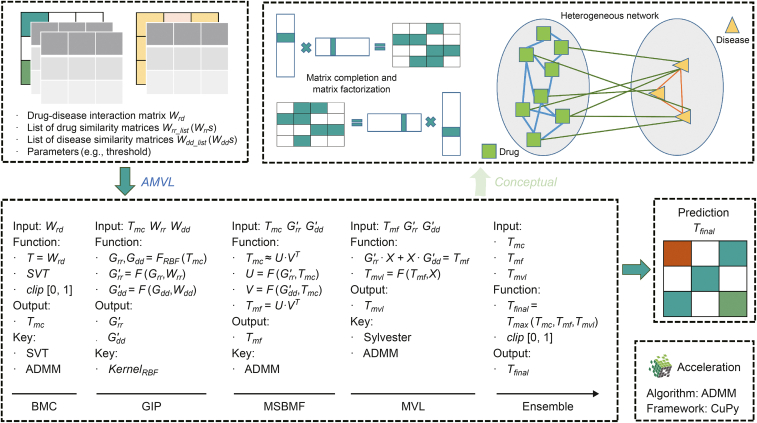
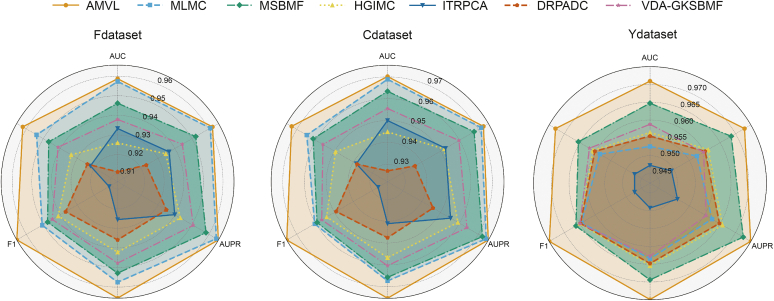
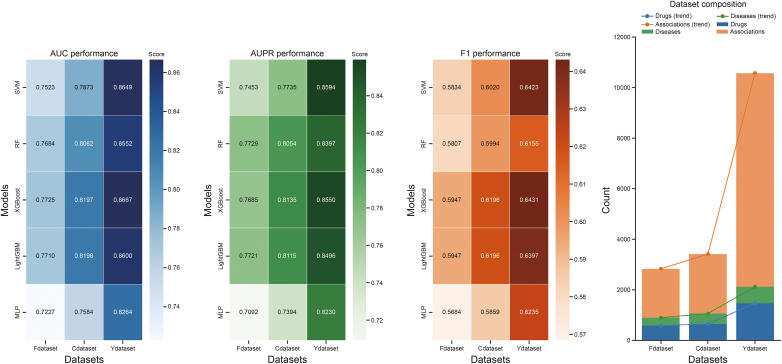
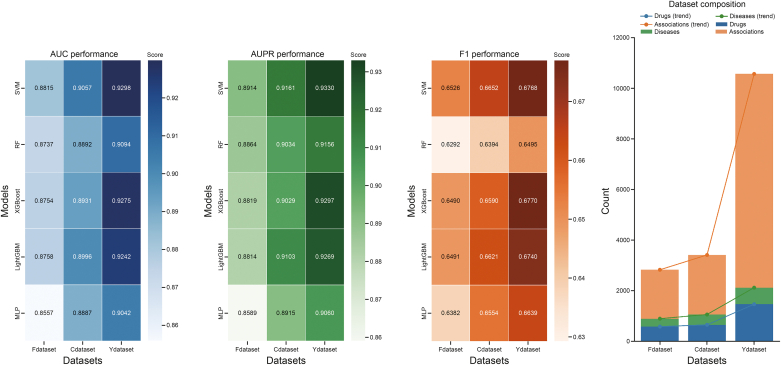
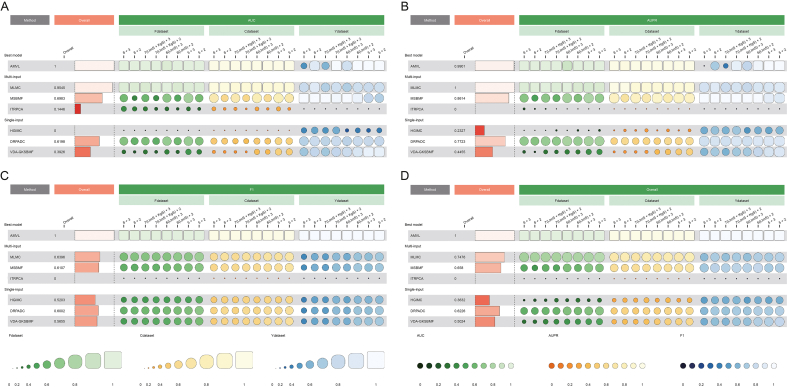
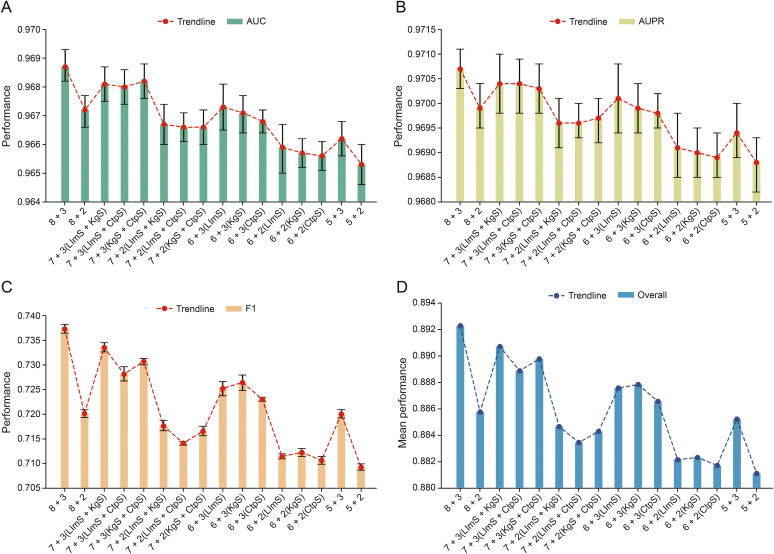
Drug repurposing offers a promising alternative to traditional drug development and significantly reduces costs and timelines by identifying new therapeutic uses for existing drugs. However, the current approaches often rely on limited data sources and simplistic hypotheses, which restrict their ability to capture the multi-faceted nature of biological systems. This study introduces adaptive multi-view learning (AMVL), a novel methodology that integrates chemical-induced transcriptional profiles (CTPs), knowledge graph (KG) embeddings, and large language model (LLM) representations, to enhance drug repurposing predictions. AMVL incorporates an innovative similarity matrix expansion strategy and leverages multi-view learning (MVL), matrix factorization, and ensemble optimization techniques to integrate heterogeneous multi-source data. Comprehensive evaluations on benchmark datasets (Fdataset, Cdataset, and Ydataset) and the large-scale iDrug dataset demonstrate that AMVL outperforms state-of-the-art (SOTA) methods, achieving superior accuracy in predicting drug-disease associations across multiple metrics. Literature-based validation further confirmed the model's predictive capabilities, with seven out of the top ten predictions corroborated by post-2011 evidence. To promote transparency and reproducibility, all data and codes used in this study were open-sourced, providing resources for processing CTPs, KG, and LLM-based similarity calculations, along with the complete AMVL algorithm and benchmarking procedures. By unifying diverse data modalities, AMVL offers a robust and scalable solution for accelerating drug discovery, fostering advancements in translational medicine and integrating multi-omics data. We aim to inspire further innovations in multi-source data integration and support the development of more precise and efficient strategies for advancing drug discovery and translational medicine.

Keywords: Chemical-induced transcriptional profile; Drug repurposing; Heterogeneous network; Knowledge graph; Large language model; Multi-view learning.


Conflict of interest statement

The authors declare that there are no conflicts of interest.

Figures

Image 1
Graphical abstract
Fig. 1
Fig. 1
Enhanced workflow of adaptive multi-view learning (AMVL) incorporating chemical-induced transcriptional profiles (CTPs), knowledge graph (KG), and large language model (LLM) for drug-disease association prediction. The comprehensive workflow of AMVL for predicting drug-disease associations. The process begins with data collection from diverse resources (e.g., PubMed, DrugBank, Comparative Toxicogenomics Database (CTD), Medical Subject Headings (MeSH), and Disease Ontology (DO), capturing multi-modal information, such as chemical structures, side effects, and drug-drug interactions. Multiple similarity matrices are constructed for drugs and diseases, expanding from a previous configuration of 5 + 2 matrices to 8 + 3 matrices by integrating new data sources, such as CTPs, KG, and LLM. These matrices are processed through multi-view learning (MVL) techniques, including matrix completion and matrix factorization, to predict drug-disease relationships. The framework is benchmarked against seven models using three standard datasets to ensure robust evaluation. Additionally, a two-step validation phase is performed, which includes testing on a large-scale dataset and cross-referencing with evidence from literature validation to ensure the reliability and biological plausibility of the predicted associations. SIDER: Side Effect Resource; CMap: ConnectivityMap; OMIM: Online Mendelian Inheritance in Man; ATC: anatomical therapeutic chemical; AUC: area under the receiver operating characteristic curve.
Fig. 2
Fig. 2
Multi-source data integration and similarity matrix construction in adaptive multi-view learning (AMVL). This figure illustrates how AMVL processes and integrates diverse data sources to build multi-view similarity matrices for drug-disease association analysis. Various databases, including Side Effect Resource (SIDER), Comparative Toxicogenomics Database (CTD), DrugBank, Medical Subject Headings (MeSH), and MIMMiner, supply drug-related information (chemical structures, anatomical therapeutic chemical (ATC) codes, side effects, drug-drug interactions, and target profiles), which are used to construct five initial drug similarity matrices. Simultaneously, disease phenotype and ontology data yield two disease similarity matrices. ConnectivityMap (CMap) provides chemical-induced transcriptional profiles (CTPs), which undergo averaging and Spearman's correlation to form additional drug similarity matrices. Knowledge graph (KG) embeddings (from PharMeBINet) and large language model (LLM) outputs further enrich both the drug and disease similarity matrices, providing a comprehensive set of multi-source features ready for subsequent learning tasks. SMILES: simplified molecular input line entry system; OMIM: Online Mendelian Inheritance in Man; rCDK: R interface to the chemistry development kit; DOSE: disease ontology (DO) semantic and enrichment; MODZ: moderated z-score; Treat_inv: the inverse relations of treat; Relieve_inv: the inverse relations of relieve; CompGCN: composition-based graph convolutional network.
Fig. 3
Fig. 3
Methodological workflow of the adaptive multi-view learning (AMVL) algorithm. The core algorithmic steps of AMVL, which leverages matrix completion and factorization to refine drug-disease association predictions. The inputs include the known drug-disease interaction matrix, multiple drug similarity matrices, and disease similarity matrices, as well as relevant hyperparameters (e.g., thresholds). AMVL combines methods, such as multi-view learning (MVL), bi-relational matrix completion (BMC), Gaussian interaction profile similarity (GIP), and multi-similarity bilinear matrix factorization (MSBMF), employing an ensemble strategy to integrate multi-view information and generate the final prediction matrix. Computational acceleration is achieved via graphics processing unit (GPU)-based optimization (CuPy) and the alternating direction method of multipliers (ADMM), enabling efficient large-scale data processing while preserving predictive performance. Wrd: original drug-disease association matrix; Wrr_list: list of drug similarity matrices; Wrrs: combined drug similarity matrix after weighted integration; Wdd_list: list of disease similarity matrices; Wdds: combined disease similarity matrix after weighted integration; T: original drug-disease association matrix; SVT: singular value thresholding operator; Tmc: completed drug-disease association matrix from BMC; Grr: GIP matrix for drugs; Gdd: GIP matrix for diseases; FRBF: radial basis function kernel matrix; G'rr: adjusted GIP matrix for drugs; G'dd: adjusted Gaussian similarity matrix for diseases; U: lagrange multipliers in ADMM optimization; VT: transposed right singular matrix in factorization; Tmf: predicted drug-disease association matrix from MSBMF; X: latent feature matrix or solution matrix in the Sylvester equation; Tmvl: predicted drug-disease association matrix from MVL; Tfinal: final ensemble-optimized association matrix; Fmax: thresholded and clipped final prediction matrix.
Fig. 4
Fig. 4
Comparative benchmark of adaptive multi-view learning (AMVL) and state-of-the-art (SOTA) models on drug-disease association prediction. The benchmark results of AMVL alongside several SOTA models across three datasets using area under the receiver operating characteristic curve (AUC), area under the precision-recall curve (AUPR), and F1 scores as evaluation metrics. Each radar chart shows the model performance across these metrics, illustrating the relative strengths of each model in drug-disease association prediction tasks. To enhance interpretability, an extended hexagonal radar format is used, incorporating virtual indicators between original metrics for smoother transitions and nuanced comparisons. The expanded structure allows for a more comprehensive assessment of each model capabilities, showcasing the ability of AMVL to integrate multi-view data effectively and achieve superior accuracy across all datasets. MLMC: multi-view learning with matrix completion; MSBMF: multi-similarity bilinear matrix factorization; HGIMC: heterogeneous graph inference with matrix completion; ITRPCA: improved tensor robust principal component analysis; DRPADC: drug repositioning algorithm predicting adaptive drugs; VDA-GKSBMF: virus-drug association Gaussian kernel similarity bilinear matrix factorization.
Fig. 5
Fig. 5
Benchmark evaluation of knowledge graph (KG) representations combined with machine learning and deep learning models for drug repurposing. The performance comparison of various machine learning models (support vector machine (SVM), random forest (RF), extreme gradient boosting (XGBoost), and light gradient boosting machine (LightGBM)) and a deep learning model (MLP) using KG representations for drug repurposing tasks across three datasets. The heatmaps display model performance across area under the receiver operating characteristic curve (AUC), area under the precision-recall curve (AUPR), and F1 metrics, highlighting differences in predictive capabilities among models. XGBoost and LightGBM exhibit strong performance in AUC and AUPR, particularly with the Ydataset, while F1 scores remain relatively low across models and datasets, indicating challenges in achieving balanced precision and recall. The bar chart on the right visualizes the composition of each dataset (drugs, diseases, and associations) and includes trend lines, showing an upward trajectory in dataset size.
Fig. 6
Fig. 6
Benchmark Evaluation of large language model (LLM) representations combined with machine learning and deep learning models for drug repurposing. The performance of machine learning models (support vector machine (SVM), random forest (RF), extreme gradient boosting (XGBoost), and light gradient boosting machine (LightGBM)) and a deep learning model (MLP) using LLM representations for drug repurposing tasks across three datasets. The heatmaps illustrate model performance based on area under the receiver operating characteristic curve (AUC), area under the precision-recall curve (AUPR), and F1 scores, showcasing the enhanced predictive capabilities of LLM representations compared to knowledge graph (KG) representations. SVM and XGBoost demonstrate consistently high AUC and F1 scores, especially with Cdataset and Ydataset, highlighting LLM representation effectiveness in capturing complex drug-disease associations. The dataset composition bar chart on the right indicates an upward trend in dataset size, which correlates with improved model performance across all metrics.
Fig. 7
Fig. 7
Performance comparison of adaptive multi-view learning (AMVL) and baseline models under different data configurations and similarity matrix inputs. This figure compares the performance of AMVL with various baseline models across different data configurations and similarity matrix inputs, including 8 + 3, 8 + 2, 6 (large language models (LLMs)' similarity (LlmS)), 6 (knowledge graphs (KG)' similarity (KgS)), and 5 + 2. Here, “8 + 3” and “8 + 2” represent configurations with eight drug similarity matrices and three or two disease similarity matrices, respectively, while “6 (LlmS)” and “6 (KgS)” correspond to configurations using six similarity matrices derived from LLM and KG, respectively. The 5 + 2 configuration includes 5 drug and 2 disease similarity matrices, as established in prior research. Each panel evaluates a different performance metric: (A) area under the receiver operating characteristic curve (AUC), (B) area under the precision-recall curve (AUPR), (C) F1 scores, and (D) overall performance, which combines all three metrics. (A) AMVL shows strong performance in AUC, with multi-similarity bilinear matrix factorization (MSBMF) marginally surpassing it under the 8 + 3 configuration on Ydataset. (B) AUPR results similarly show the robust performance of AMVL, though MSBMF occasionally edges it out under certain configurations. (C) The superior F1 scores of AMVL across configurations, where it outperforms all other models. (D) The combined overall score, emphasizing the consistency and dominance of AMVL across all metrics, especially in F1, which underscores its inclusiveness and robustness in practical applications. MLMC: multi-view learning (MVL) with matrix completion; ITRPCA: improved tensor robust principal component analysis; HGIMC: heterogeneous graph inference with matrix completion; DRPADC: drug repositioning algorithm predicting adaptive drugs; VDA-GKSBMF: virus-drug association Gaussian kernel similarity bilinear matrix factorization.
Fig. 8
Fig. 8
Adaptive multi-view learning (AMVL) performance metrics across configurations on the iDrug dataset. Visualization of AMVL performance on the iDrug dataset under various configurations (8 + 3, 8 + 2, 7 + 3, 7 + 2, 6 + 3, 6 + 2, 5 + 3, and 5 + 2). (A–C) The area under the receiver operating characteristic curve (AUC) (A), area under the precision-recall curve (AUPR) (B), and F1 metrics (C). (D) The mean performance of the three metrics. Each bar includes error bars to indicate variability, and trendlines are overlaid to highlight the performance trajectory across configurations. LlmS: large language models (LLMs)' similarity; KgS: knowledge graphs (KG)' similarity; CtpS: chemical-induced transcriptional profiles (CTPs)' similarity.

Similar articles

References

    1. Chong C.R., Sullivan D.J., Jr New uses for old drugs. Nature. 2007;448:645–646. - PubMed
    1. Pushpakom S., Iorio F., Eyers P.A., et al. Drug repurposing: Progress, challenges and recommendations. Nat. Rev. Drug Discov. 2019;18:41–58. - PubMed
    1. Li Y., Yang Y., Tong Z., et al. A comparative benchmarking and evaluation framework for heterogeneous network-based drug repositioning methods. Brief. Bioinform. 2024;25 - PMC - PubMed
    1. Tan S.Y., Grimes S. Paul Ehrlich (1854–1915): Man with the magic bullet. Singapore Med. J. 2010;51:842–843. - PubMed
    1. Cheng F., Desai R.J., Handy D.E., et al. Network-based approach to prediction and population-based validation of in silico drug repurposing. Nat. Commun. 2018;9 - PMC - PubMed

LinkOut - more resources