. 2025 Jun;15(6):101295.
doi: 10.1016/j.jpha.2025.101295. Epub 2025 Apr 9.

Perturbation response scanning of drug-target networks: Drug repurposing for multiple sclerosis

Affiliations

Perturbation response scanning of drug-target networks: Drug repurposing for multiple sclerosis

Yitan Lu et al. J Pharm Anal. 2025 Jun.

Abstract

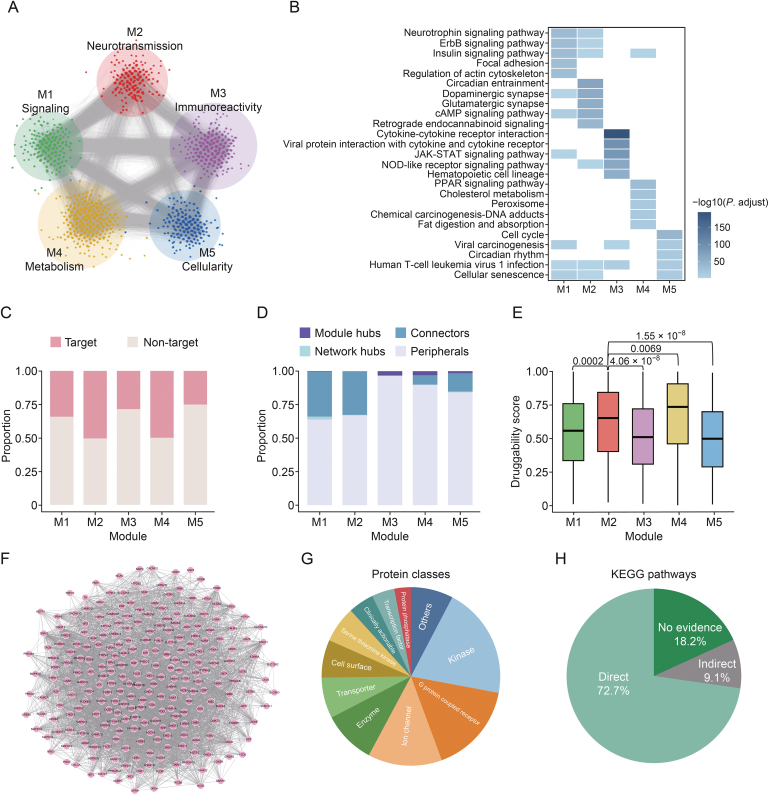
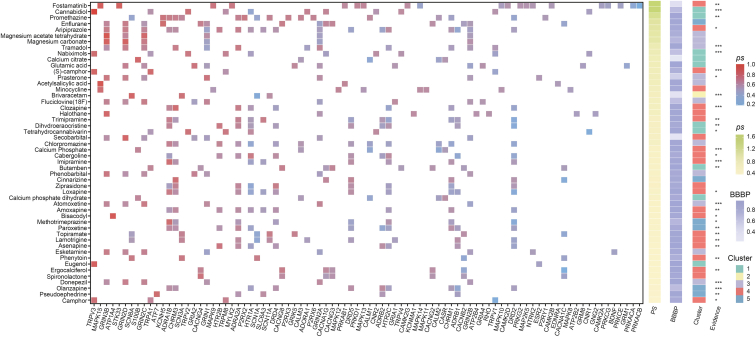
Combined with elastic network model (ENM), the perturbation response scanning (PRS) has emerged as a robust technique for pinpointing allosteric interactions within proteins. Here, we proposed the PRS analysis of drug-target networks (DTNs), which could provide a promising avenue in network medicine. We demonstrated the utility of the method by introducing a deep learning and network perturbation-based framework, for drug repurposing of multiple sclerosis (MS). First, the MS comorbidity network was constructed by performing a random walk with restart algorithm based on shared genes between MS and other diseases as seed nodes. Then, based on topological analysis and functional annotation, the neurotransmission module was identified as the "therapeutic module" of MS. Further, perturbation scores of drugs on the module were calculated by constructing the DTN and introducing the PRS analysis, giving a list of repurposable drugs for MS. Mechanism of action analysis both at pathway and structural levels screened dihydroergocristine as a candidate drug of MS by targeting a serotonin receptor of serotonin 2B receptor (HTR2B). Finally, we established a cuprizone-induced chronic mouse model to evaluate the alteration of HTR2B in mouse brain regions and observed that HTR2B was significantly reduced in the cuprizone-induced mouse cortex. These findings proved that the network perturbation modeling is a promising avenue for drug repurposing of MS. As a useful systematic method, our approach can also be used to discover the new molecular mechanism and provide effective candidate drugs for other complex diseases.

Keywords: HTR2B; Mechanism of action; Multiple sclerosis; Network perturbations.


Conflict of interest statement

The authors declare that there are no conflicts of interest.

Figures

Image 1
Graphical abstract
Fig. 1
Fig. 1
The overview of the perturbation response scanning (PRS)-based drug repurposing method. DTN: drug-target network; DTI: drug-target interaction; GNM: Gaussian Network Model; ps: perturbation score; PS: the cumulative score of the normalized ps of drugs targeting multiple proteins.
Fig. 2
Fig. 2
Generation of the multiple sclerosis (MS) comorbidity network. (A) Venn diagram illustrating the collection of MS disease genes. (B) Venn diagram showing the shared gene count between MS and other diseases. (C) The seed protein-protein interaction network (PPIN) with 80 share genes as nodes, and 406 interactions as edges. (D) Degree distribution of the seed PPIN. (E) The MS comorbidity network obtained by network propagation, with seed proteins highlighted in red and enlarged. (F) Degree distribution of the MS comorbidity network. (G) The reachability of candidate proteins in the MS comorbidity network is significantly higher relative to all other proteins in the human PPIN. (H, I) The top 10 significant entries from the Gene Ontology (GO) biological processes and Kyoto Encyclopedia of Genes and Genomes (KEGG) pathway enrichment results of the seed network (H) and the MS comorbidity network (I).
Fig. 3
Fig. 3
Identification of M2 as the “therapeutic module” in the multiple sclerosis (MS) comorbidity network. (A) Five functional modules with proteins in each module represented by different colors, whose detailed biological function annotations were found at Text S1. (B) The top five significantly enriched pathways for each module. Each row corresponds to a distinct pathway, while each column represents a unique module. (C) Bar graph showing the enrichment of drug targets in each module. (D) Bar graph depicting the proportions of the four node categories in each module. (E) The distribution of druggability scores for nodes in each module. The significance of druggability scores between M2 and other modules was annotated. (F) The architecture of M2. (G) The protein class ontology results of M2. (H) The relationship of Kyoto Encyclopedia of Genes and Genomes (KEGG) pathways with MS pathogenic mechanisms. See Table S3 for more information.
Fig. 4
Fig. 4
Drug repurposing through the perturbation response scanning (PRS)-based approach. (A) The pipeline of drug repurposing based on PRS. (B) The weighted drug-target network (DTN) constructed from M2. (C) Visualization heatmap of the calculated PRS matrix for illustrating the propagation of perturbation effects through the identified therapeutic module M2 when specific drugs interact with their target proteins. Row averages and column averages of the PRS matrix indicate the sensitivity (right vertical axis) and effectiveness (bottom horizontal axis) of each node.
Fig. 5
Fig. 5
The heatmap of the top 50 ranked drugs based on their perturbation score (ps) scores. Each row corresponds to a drug, and the color gradients along the row represent the drug's ps pertaining to each target protein, and the accumulated score of these ps along a row yields the cumulative score PS for that drug. BBBP: blood-brain barrier permeability.
Fig. 6
Fig. 6
Mechanism of action (MoA) analysis. (A) The line graph depicts the Davies-Bouldin index (DBI) values obtained using different numbers of clusters. This visualization reveals an optimal clustering delineation at five clusters, where the DBI value is the lowest at 0.94. (B) The self-organizing map (SOM) component plot displays five clusters selected using the U-matrix and DBI. The clusters of each SOM neuron can be distinguished by their respective colors. The number of pathways mapped to each neuron is represented by the displayed value within the neuron. (C) The heatmap of the interaction patterns across various MS-related pathways (‘Synaptic’, ‘Signaling’, and ‘Disease’) associated with different clusters. See Table S6 for the detailed information of pathways. (D) The relationship between drugs in Cluster 4 and their associated pathways. The drugs mapped to the corresponding neurons in Cluster 4 are shown on the left, and the pathways mapped to the corresponding neurons in Cluster 4 are shown on the right. The connection lines between the drugs and pathways depict the drug-pathway interactions within Cluster 4.
Fig. 7
Fig. 7
Molecular docking and simulation of the dihydroergocristine-serotonin 2B receptor (HTR2B) complex. (A) The binding pose and affinity of the dihydroergocristine-HTR2B complex based on molecular docking. (B) The binding pose of the equilibrium state after 500 ns molecular dynamics (MD) simulation, and the binding free energy from MD trajectory. (C) Root mean square deviations (RMSDs) for apo and dihydroergocristine binding HTR2B during the MD simulations. (D) Root mean square fluctuation (RMSF) results for α-carbon atoms of apo and dihydroergocristine binding HTR2B systems, highlighting two regions become more stable after the dihydroergocristine binding (E).
Fig. 8
Fig. 8
Alteration of serotonin 2B receptor (HTR2B) in a cuprizone-induced chronic demyelination model. (A) Scheme profile of the cuprizone diet-induced chronic-myelinating mouse model. (B) Quantitative analysis of the weight of mice with a control diet or cuprizone diet each week. (C) Quantitative analysis of total distances of mice in the open field test. (D) Quantitative analysis of time to descend of mice in the pole test. (E) Quantitative analysis of latency to fall of mice in the rotarod test. (F) Representative Western blots (WB) and quantitative analysis of myelin basic protein (MBP) and tubulin proteins in the corpus callosum. (G) Representative images and quantitative analysis of MBP staining in the corpus callosum. (H) Representative images and quantitative analysis of ionized calcium-binding adapter molecule 1 (Iba1) staining of the corpus callosum. (I) Representative WB and quantitative analysis of HTR2B and Tubulin proteins in the corpus callosum and cortex. (J) Representative immunostaining and quantitative analysis of HTR2B protein in the cortex. n = 11 control chow (Ctrl) mice and 12 cuprizone chow (CPZ) mice in the behavioral studies (B–E), n = 3 mice/group (F–J). P <0.05, ∗∗P <0.01, ∗∗∗P <0.001, ∗∗∗∗P <0.0001, ns: not significant. DAPI: 4′,6-diamidino-2-phenylindole.

Similar articles

References

    1. Fiscon G., Conte F., Farina L., et al. A comparison of network-based methods for drug repurposing along with an application to human complex diseases. Int. J. Mol. Sci. 2022;23 - PMC - PubMed
    1. Morselli Gysi D., do Valle I., Zitnik M., et al. Network medicine framework for identifying drug-repurposing opportunities for COVID-19. Proc. Natl. Acad. Sci. U. S. A. 2021;118 - PMC - PubMed
    1. Fiscon G., Paci P. SAveRUNNER: An R-based tool for drug repurposing. BMC Bioinf. 2021;22:150. - PMC - PubMed
    1. Fiscon G., Conte F., Amadio S., et al. Drug repurposing: A network-based approach to amyotrophic lateral sclerosis. Neurotherapeutics. 2021;18:1678–1691. - PMC - PubMed
    1. Zhou Y., Hou Y., Shen J., et al. Network-based drug repurposing for novel coronavirus 2019-nCoV/SARS-CoV-2. Cell Discov. 2020;6:14. - PMC - PubMed

LinkOut - more resources