. 2025 May 22;5(5):100537.
doi: 10.1016/j.bpsgos.2025.100537. eCollection 2025 Sep.

The Impact of Overexpression of the Mouse Ortholog of CACNA1C on Behavior and Cortical Dynamics

Affiliations

The Impact of Overexpression of the Mouse Ortholog of CACNA1C on Behavior and Cortical Dynamics

Rachel Parent et al. Biol Psychiatry Glob Open Sci. .

Abstract

Background: Mental disorders are common in the United States. According to the National Institute of Mental Health more than 23% of the adult population in the United States live with some form of mental illness. Genome-wide association studies have implicated CACNA1C, which encodes the L-type voltage-gated calcium channel CaV1.2, and it has been suggested that the expression levels of CACNA1C may be associated with mental illness. To this end, we have generated a novel mouse line that conditionally overexpresses the mouse ortholog Cacna1c.

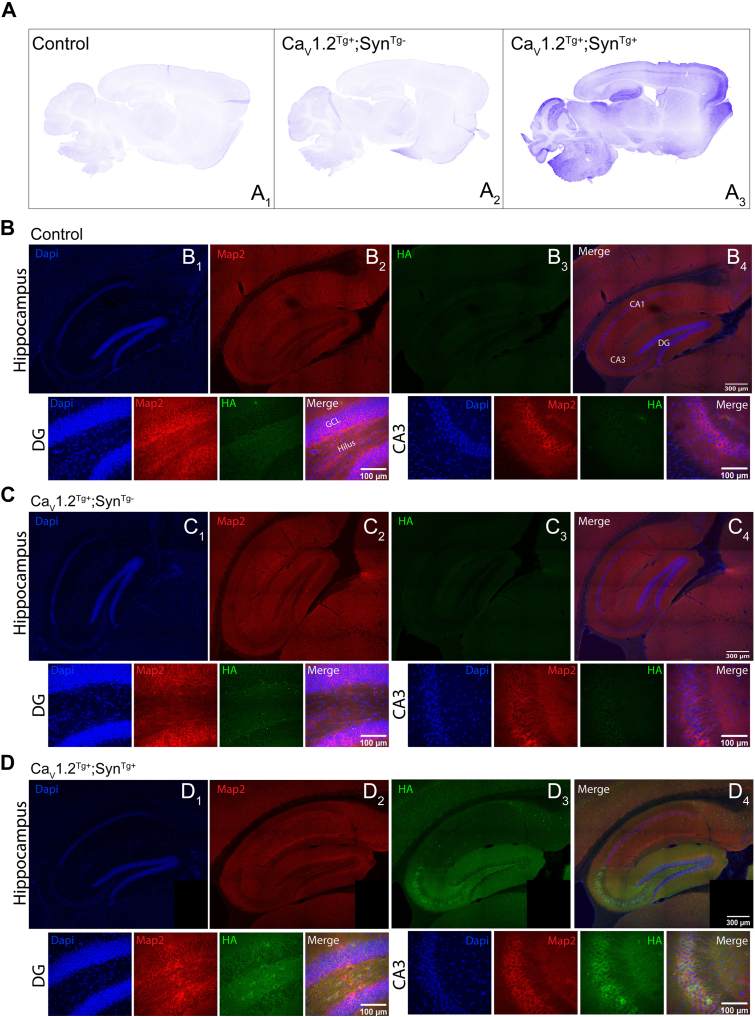
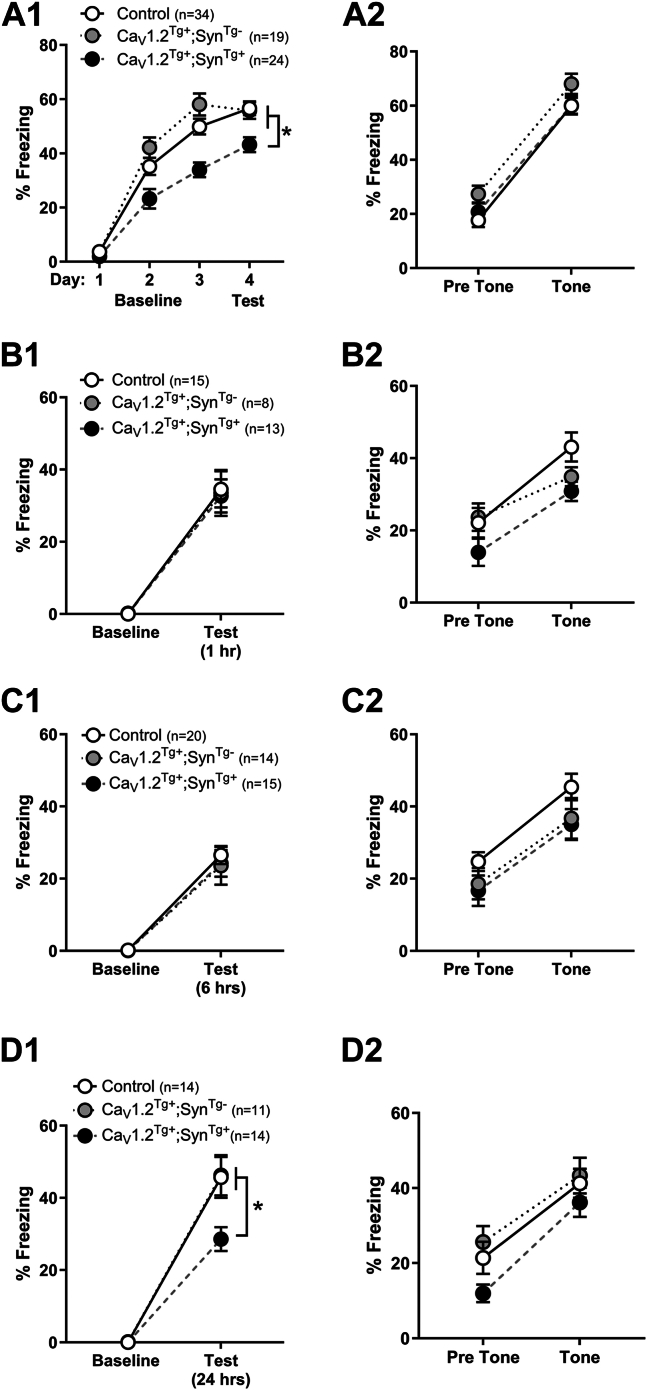
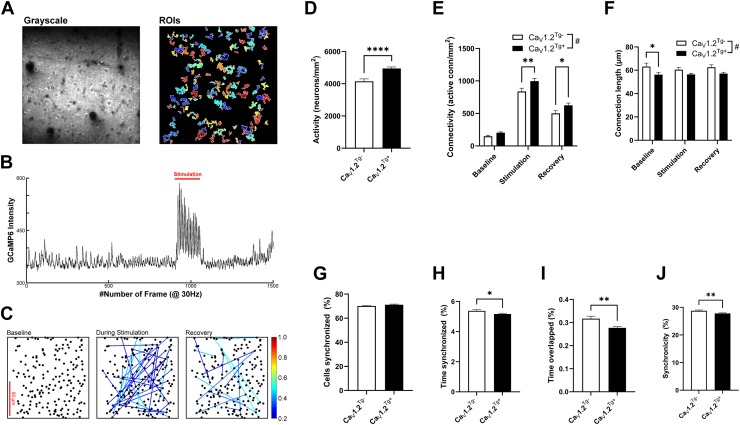
Methods: Transgenic mice (CaV1.2Tg+ mice) were characterized for expression and distribution of CaV1.2. The CaV1.2Tg+ mice were compared with control littermates using assays that examined cognitive and affective behaviors. Cortical network dynamics were assessed using in vivo multiphoton calcium imaging.

Results: Compared with their control littermates, CaV1.2Tg+ mice exhibited a ∼1-fold increase in CaV1.2 expression. Behavioral characterization of the CaV1.2Tg+ mice revealed a complex phenotype in which they exhibited deficits in the consolidation of fearful memories and an increase in anxiolytic-like behavior. The CaV1.2Tg+ mice also appeared to have altered cortical dynamics in which the network was more dense but less synchronized.

Conclusions: We have successfully generated mice that overexpress the mouse ortholog of a gene that has been implicated in several psychiatric diseases. Our initial characterization suggests that these mice have alterations in behavior and neural function that have been linked to mental illness. It is anticipated that future studies will reveal additional neurobehavioral alterations whose mechanisms will be studied.

Keywords: Bipolar disorder; Cortical subnetworks; L-type calcium channel CaV1.2; Psychiatric risk variant; Schizophrenia.

Plain language summary

More than 23% of the adult population in the United States live with some form of mental illness. Several genes have been identified, which appear more frequently in people diagnosed with a psychiatric condition, that have small alterations of unknown significance. There is some evidence suggesting that expression levels of one of these genes, CACNA1C, may be altered in psychiatric patients. To address this question, using genetic engineering, we have generated mice that overexpress the mouse version of CACNA1C. Our initial characterization suggests that these mice have alterations in behavior and neural function that have been linked to mental illness.


Figures

Figure 1
Figure 1
CaV1.2 transgene injection construct and expression analysis. (A) Schematic of the injection construct consisting of the CAG promoter, Loxp-3xStop-Loxp cassette cassette, 5′ UTR, CaV1.2Tg and 3′ UTR, as well as PCR primer and poly-A consensus sequence locations. The 12-kB transgene was linearized for injection using NotI restriction enzyme digestion. (B) Cartoon of the CaV1.2Tg protein product including the location of the HA epitope. (C) The CaV1.2Tg injection construct was expressed in HEK293 alone or with pCAG-ERT2-Cre-ERT2. Blots containing whole-cell lysates were probed with rat anti-HA to detect the presence of the transgenic protein and anti β-actin as a loading control. Only those samples co-expressing Cre recombinase (CaV1.2Tg+; SynTg+) also expressed CaV1.2Tg. (D) Representative Western blots containing cell lysates from whole-brain tissue. Membranes were probed with either anti-CaV1.2 or anti-HA where appropriate and anti β-actin as a loading control. (D1) Immunoblotting with an HA-specific antibody reveals staining that is only present in tissue harvested from CaV1.2Tg+; SynTg+ mice. (D2) Western blot of total CaV1.2 protein (transgenic and endogenous). (E) Quantification of total CaV1.2. CaV1.2Tg+; SynTg+ mice express approximately 100% more CaV1.2 than their control or CaV1.2Tg+; SynTg− littermates (F2,18 = 1.612, p = .0013; significant post hoc comparisons: wild-type × CaV1.2Tg+; SynTg+, ∗∗p = .007. CaV1.2Tg+; SynTg− × CaV1.2Tg+; SynTg+, ∗∗p = .0018). All data are presented as mean ± SEM. HA, hemagglutinin; PCR, polymerase chain reaction; UTR, untranslated region.
Figure 2
Figure 2
Expression pattern of CaV1.2Tg in adult brain. (A) Representative confocal images of anti-HA staining of 25-μm sagittal sections of whole brain (4×). CaV1.2Tg expression is restricted to CaV1.2Tg+; SynTg+ brains (A3), confirming a lack of transgene expression without co-expression of Cre recombinase. (B–D) Representative confocal images (20×) of sagittal sections of the hippocampus taken from control (B), CaV1.2Tg+; SynTg−(C) and CaV1.2Tg+; SynTg+(D) mice immunostained with antibodies specific for DAPI (blue), MAP2 kinase (red), and HA (green). Staining for the HA tag is only observable in hippocampus recovered from the CaV1.2Tg+; SynTg+ mice (D3) and is particularly abundant in the DG and CA3 regions (40× images below main images). Note in panels (D1–D4), a tile is missing in the lower right corner that was lost during image acquisition. DG, dentate gyrus; GCL, granule cell layer; HA, hemagglutinin.
Figure 3
Figure 3
CaV1.2Tg+; SynTg+ mice exhibit deficits in memory consolidation of fearful contexts. (A1) Mice were exposed to a single tone-shock pairing each day for 3 days and subsequently returned to the same context 24 hours later, and freezing was measured in the absence of tone or shock. While all groups exhibited an increase in freezing across the 3 days of training, the CaV1.2Tg+; SynTg+ mice exhibited less freezing 24 hours after the first training session (day 2), a deficit which persisted across 3 days of training and was maintained during a context test on the fourth day (effect of training: F2.638,172.9 = 197.0, p < .0001; effect of genotype: F2,73 = 20.42, p < .0001; training × genotype interaction: F6,219 = 3.194, p = .005; post hoc analysis indicates CaV1.2Tg+; SynTg+ froze less than CaV1.2Tg+; SynTg− and control mice on days 2, 3, and 4. ∗p < .05; Tukey). (A2) On the day following the context test, mice were placed in a novel context, and freezing was measured during a brief baseline period (pretone) and during the presentation of the same tone previously associated with the foot shock on days 1 to 3 (tone). In contrast to the deficits in memory consolidation for context, mice exhibited freezing levels similar to that observed in littermate control and CaV1.2Tg+; SynTg− mice (effect of training: F1,60 = 201.2, p < .0001; effect of genotype: F2,60 = 1.966, p = .1489). To determine to what extent the deficits in context conditioning were due to a failure in acquisition or memory consolidation, a series of additional experiments were performed using 3 separate cohorts of mice (B–D). Mice were placed in the training chambers, and after a brief baseline period, 3 tone-shock pairings were delivered, and after 30 seconds mice were returned to their home cage. Mice were returned to the same context in which they were trained after 1, 6, or 24 hours, and freezing was measured in the absence of tone or shock. (B1) Compared with baseline, all mice exhibited significant freezing after a 1-hour delay; however, there were no significant differences in freezing levels between the 3 genotypes (effect of training: F1,33 = 115.8, p < .0001; effect of genotype: F2,33 = 0.03593, p = .9647). (B2) All groups exhibited significant freezing during the tone presentation (effect of tone: F1,33 = 59.12, p < .0001), which did not differ significantly across the 3 genotypes (F2,33 = 2.729, p = .08). (C1) Similarly, 6 hours after training, control mice, CaV1.2Tg+; SynTg−, and CaV1.2Tg+; SynTg+ mice all exhibited similar levels of freezing when returned to the training context (effect of training: F1,46 = 132.4, p < .0001; effect of genotype: F2,46 = 0.1987, p = .8205). (C2) When placed into a novel context 24 hours later, all mice exhibited robust freezing during the tone presentation that did not differ across the 3 genotypes (effect of tone: F1,46 = 52.90, p < .0001; effect of genotype: F2,46 = 2.311, p = .1105). (D1) In contrast, when returned to the same context 24 hours after a single contextual fear conditioning session, CaV1.2Tg+; SynTg+ mice exhibited less freezing than their control and CaV1.2Tg+; SynTg− littermates (effect of training: F1,36 = 199.3, p < .0001; effect of genotype: F2,36 = 4.323, p = .0208; training × genotype interaction: F2,36 = 4.331, p = .0206). Post hoc analysis indicates CaV1.2Tg+; SynTg+ mice froze less than CaV1.2Tg+; SynTg− and control mice during the context test 24 hours after training (∗p < .01; Tukey) (D2) without exhibiting a tone condition deficit (effect of training: F1,36 = 63.62, p < .0001; effect of genotype: F2,36 = 2.760, p = .0767). All data are presented as mean ± SEM.
Figure 4
Figure 4
Overexpression of CaV1.2 results in mild anxiolytic behavior in the absence of sensory or motor deficits. (A) Zero maze. CaV1.2Tg+; SynTg+ mice spent significantly more time in the open quadrants as a percentage of total time (5 min) on the elevated zero maze (F2,71 = 5.149, p = .0053. Significant post hoc comparisons: control × CaV1.2Tg+; SynTg+, p = .0055; CaV1.2Tg+; SynTg− × CaV1.2Tg+; SynTg+, ∗p = .0386; Tukey). (B) Elevated plus maze: CaV1.2Tg+; SynTg+ mice spent more time in the open arms of the elevated plus maze than their control and CaV1.2Tg+; SynTg− littermates (F2,41 = 9.466, p = .0014. Significant post hoc comparisons: control × CaV1.2Tg+; SynTg+, p = .0017; CaV1.2Tg+; SynTg− × CaV1.2Tg+; SynTg+, ∗p = .0136; Tukey). (C) Open field: mice were placed individually into an open field and allowed to explore for 5 minutes. There were no significant differences between groups in the total distance traveled (F2,74 = 0.0131, p = .8027) during the trial. (D) Rotarod: mice were placed onto the accelerating rotarod (1–60 rpm over 300 s) once per day for 5 days, and latency to fall was recorded. Across groups, there was a main effect of training day (F3.469,246.3 = 15.32, p < .0001) but no effect of genotype (F2,73 = 2.491, p = .0899) and no training day × genotype interaction (F8,284 = 0.4399, p = .8965). (E) Porsolt forced swim test: all 3 groups of mice exhibited similar amounts of time immobile during the forced swim test (F2,39 = 1.098, p = .8208). (F) Marble burying test: mice were placed individually into corncob bedding-filled cages that contained 24 marbles and were allowed to explore for 30 minutes. There were no significant differences between groups in the number of marbles buried during the marble burying test (F2,42 = 0.3991, p = .1646). (G) In order to assess sociability, mice were placed into an arena for 5 minutes with the option to explore either a novel mouse or an inanimate object. There were no significant differences between groups (F2,37 = 1.110, p = .4265); however, all groups preferred interaction with a novel mouse over the object, as indicated by a positive discrimination ratio (∗p < .05; 1-sample t test). (H) Short-term social memory was tested by giving the mice an option to explore either the mouse that they had previously investigated or an unfamiliar mouse. Similarly to sociability, there were no significant differences between groups (F2,32 = 0.8612, p = .2552), while all of the groups showed a preference for the novel mouse (∗p < .05; 1-sample t test). All data are presented as mean ± SEM.
Figure 5
Figure 5
Cortical network alterations in mice that overexpress CaV1.2. (A) Representative FOV in grayscale (left) and with pseudocolored ROIs (right). (B) Raw GCaMP6 signal before, during, and after tactile stimulation during a 50-second recording. (C) Network connectivity correlogram. The size of the dot (neuron) represents the sum of that neuron’s weighted CC with all other neurons. The color of the line between 2 dots indicates the unweighted CC between that pair of neurons. Recordings were made from 6 mice in each genotype (CaV1.2Tg− = 95 FOV; CaV1.2Tg+ = 143 FOV). (D) Mice that overexpressed CaV1.2 exhibited significantly more active neurons per mm2 than their WT littermate controls (t236 = 4.67, ∗∗∗∗p = .007; unpaired t test). (E) In addition to the increase in number of active neurons in the CaV1.2Tg+ mice, the number of active connections was greater than those observed in the CaV1.2Tg− mice both during stimulation and the recovery period (effect of genotype F1,708 = 15.06, #p = .0001, ∗∗p = .005, ∗p = .041; Sidak’s). (F) Connection lengths were overall shorter in the CaV1.2Tg+ mice (F1,256 = 14.52, #p = .0002; restricted maximum likelihood), which was most apparent during the baseline period (t256 = 2.65, ∗p = .026; Sidak’s). (G–I) In contrast to the presence of more densely connected neurons, network activity in the CaV1.2Tg+ mice appeared to be less synchronized during the stimulation period. (G) The average percentage of cells that were synchronized with the 3-Hz paw stimulation was ∼70% and was not different between the 2 genotypes. (H) The percentage of time that cells in the FOV were synchronized to the input frequency was modestly reduced in the CaV1.2Tg+ mice compared with their WT littermates (t236 = 2.49, ∗p = .0134; unpaired t test). (I) Similarly, overlapping events between pairs of cells in the CaV1.2Tg+ mice was significantly reduced (t148 = 3.01, ∗∗p = .0023; t test with Welch’s correction). (J) Lastly, network synchronicity during the 3-Hz stimulation (calculated as the number of consecutive events detected divided by 15 and presented as percentage of time) was modestly reduced in the CaV1.2Tg+ mice (t236 = 2.69, ∗∗p = .008; t test). All data are presented as mean ± SEM. CC, correlation coefficient; FOV, field of view; ROI, region of interest; WT, wild-type.

References

    1. Berger S.M., Bartsch D. The role of L-type voltage-gated calcium channels CaV1.2 and CaV1.3 in normal and pathological brain function. Cell Tissue Res. 2014;357:463–476. - PubMed
    1. Catterall W.A. Voltage-gated calcium channels. Cold Spring Harb Perspect Biol. 2011;3 - PMC - PubMed
    1. Nanou E., Catterall W.A. Calcium channels, synaptic plasticity, and neuropsychiatric disease. Neuron. 2018;98:466–481. - PubMed
    1. Moon A.L., Haan N., Wilkinson L.S., Thomas K.L., Hall J. CACNA1C: Association with psychiatric disorders, behavior, and neurogenesis. Schizophr Bull. 2018;44:958–965. - PMC - PubMed
    1. Moore S.J., Murphy G.G. The role of L-type calcium channels in neuronal excitability and aging. Neurobiol Learn Mem. 2020;173 - PMC - PubMed

LinkOut - more resources