. 2025 Dec;17(1):2527863.
doi: 10.1080/19490976.2025.2527863. Epub 2025 Jul 18.

Deciphering the microbiome-metabolome landscape of an inflammatory bowel disease inception cohort

Affiliations

Deciphering the microbiome-metabolome landscape of an inflammatory bowel disease inception cohort

Shiva T Radhakrishnan et al. Gut Microbes. 2025 Dec.

Abstract

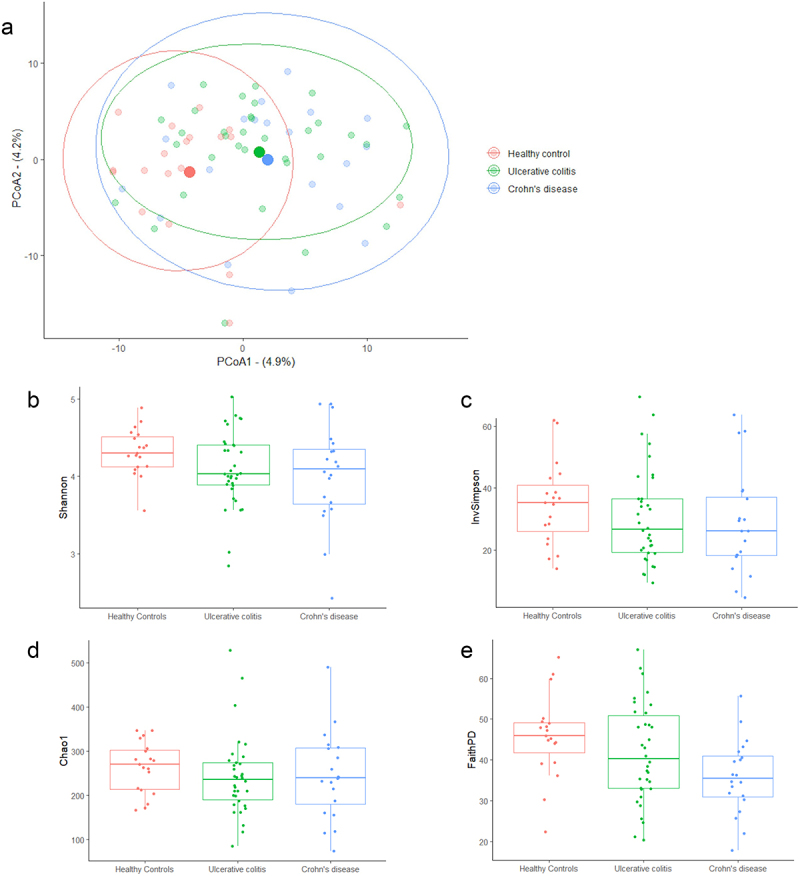
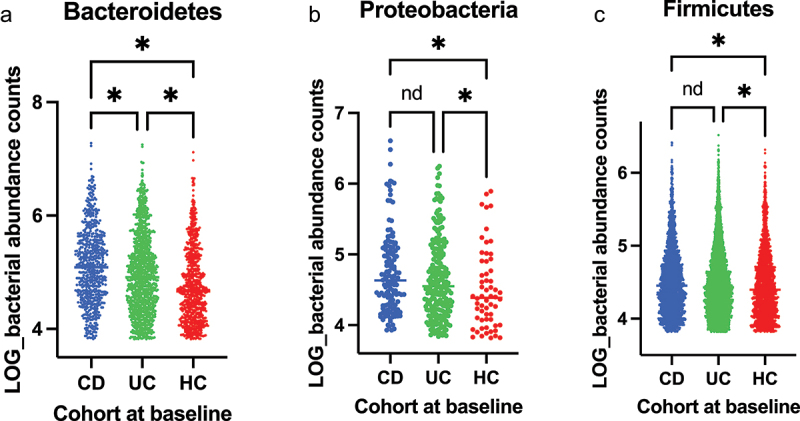
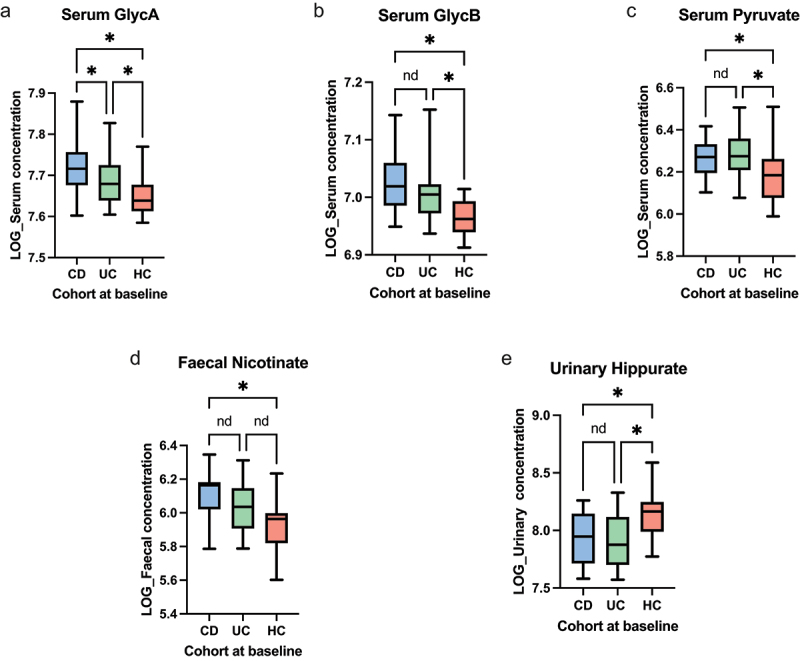
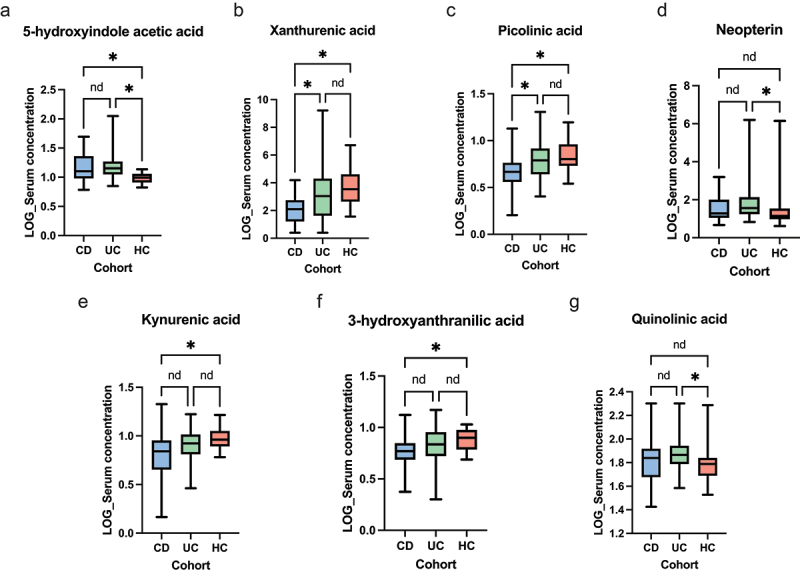
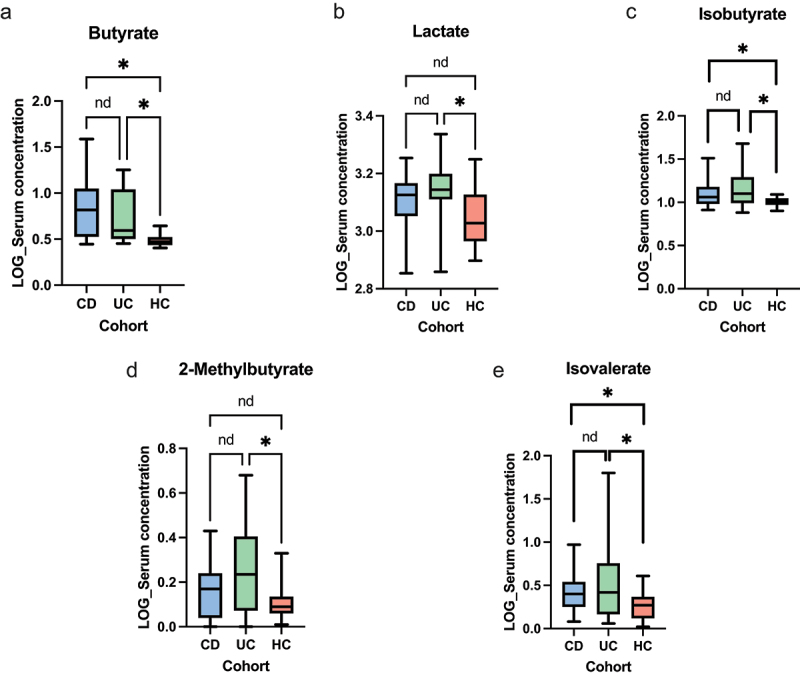
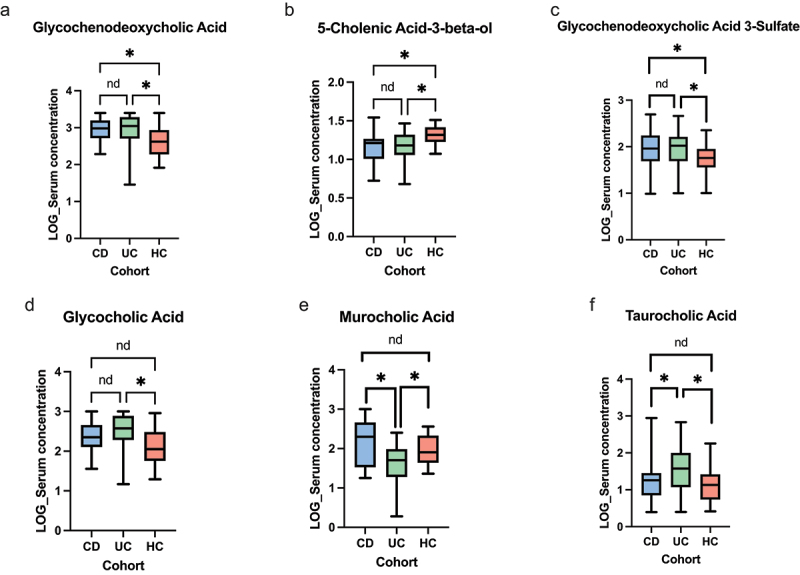
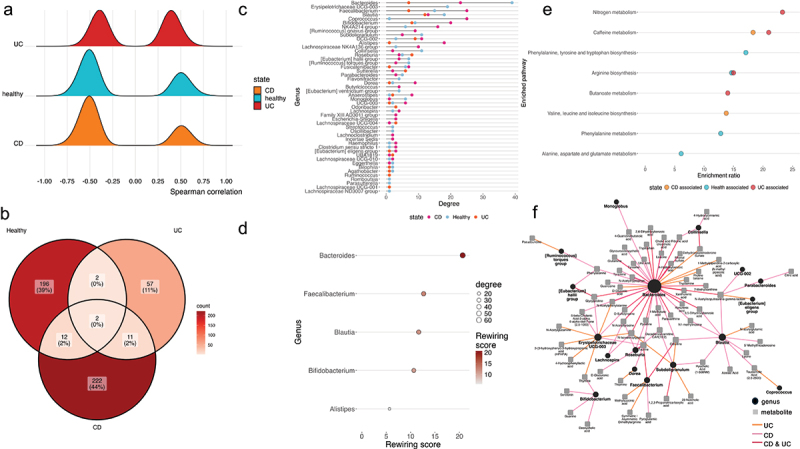
The gut microbiota contribute to the etiopathogenesis of inflammatory bowel disease (IBD), but limitations of prior studies include the use of sequencing alone (restricting exploration of the contribution of microbiota functionality) and the recruitment of patients with well-established disease (introducing potential confounders, such as immunomodulatory medication). Here, we analyze a true IBD inception cohort and healthy controls (HCs) via stool 16S rRNA gene sequencing and multi-system metabolomic phenotyping (using nuclear magnetic spectroscopy and mass spectroscopy), with subsequent integrative network analysis employed to delineate novel microbiota-metabolome interactions in IBD. Marked differences in β diversity and taxonomic profiles were observed both between IBD and HCs, as well as between Crohn's disease (CD) and ulcerative colitis (UC) patients. Multiple between-group metabolomic differences were also observed, particularly with regard to tryptophan-/indole-related metabolites; for example, UC patients had higher levels of serum metabolites including xanthurenic acid (q = 0.0092) and picolinic acid (q = 0.018). Network analysis demonstrated multiple unique interactions in CD compared to HCs with minimal overlap, indicating a loss of 'health-associated' interactions in CD. Compared to HCs, UC patients demonstrated increased pathway activity related to nitrogen and butanoate metabolism, whilst CD patients displayed increased leucine and valine synthesis. Networks from IBD patients overall showed negative correlation with health-specific associations, including an increase in taurine metabolism. Collectively, this work characterizes multiple novel perturbed microbiota-metabolome interactions that are present even at the diagnosis of IBD, which may inform potential future targets to aid diagnosis and direct therapeutic options.

Keywords: Crohn‘s Disease; IBD; Inception cohort; Metabolome; Microbiome; Network analyses; Ulcerative Colitis.


Conflict of interest statement

STR has received conference fees from Pfizer and Vifor with advisory fees from Galapagos. BHM has received consultancy fees from Finch Therapeutics Group, Akebia Therapeutics Inc, and Ferring Pharmaceuticals, and speaker fees from Yakult. SB has received conference fees from Dr Falk and Ferring. RWP declares conference fee support from Ferring. NP declares advisory and/or speaker fees from Abbvie, Allergan, Celgene, Debiopharm, Ferring and Vitor Pharma, and lecture fees from Allergan, Dr Falk Pharma, Janssen, Takeda and Tillotts Pharma. JRM has been paid for consultancy by Cultech Ltd and Enterobiotix Ltd. JLA has received conference fees from Celltrion, Tillots Pharma and Takeda with speaker fees from Abbvie and Johnson & Johnson. HRTW has received financial support to attend conferences from Takeda and has been an advisory board member for Pfizer.

Figures

Figure 1.
Figure 1.
(a) PCoA of β diversity measurements HC vs UC vs CD (Ellipses representing 95% CI) p=0.018. Alpha diversity measurements HCs vs UC vs CD utilizing. (b) Shannon Index. (c) Inverse Simpson Index. (d) Chao 1 Index, E. Faith’s PD.(Median signified by middle horizontal line, 25% and 75% confidence intervals (CI) by box ends).
Figure 2.
Figure 2.
Median bacterial phyla count (qPCR data), HCs vs CD vs UC for (a) Bacteroidetes (ANOVA p < 0.001, CD vs HCs q < 0.001, UC vs HCs q < 0.001, CD vs UC q < 0.001). (b) Proteobacteria (ANOVA p = 0.01, CD vs HCs q = 0.0075, UC vs HCs q = 0.043, CD vs UC q = 0.16). (c) Firmicutes (ANOVA p = 0.001, CD vs HCs q < 0.001, UC vs HCs q = 0.011, CD vs UC q = 0.17). The level of significance is represented by: *<0.05, nd=no difference.
Figure 3.
Figure 3.
Univariate analyses of 1H-NMR data from inception cohort – (a) Serum GlycA (ANOVA p < 0.001, CD vs HCs q < 0.001, UC vs HCs q = 0.019, CD vs UC q = 0.048). (b) Serum GlycB (ANOVA p < 0.001, CD vs HCs q < 0.001, UC vs HCs q = 0.0017, CD vs UC q = 0.10). (c) Serum pyruvate (ANOVA p = 0.0079, CD vs HCs q = 0.028, UC vs HCs q = 0.0072, CD vs UC q = 0.64). (d) Fecal nicotinate (ANOVA p = 0.0047, CD vs HCs q = 0.0032, UC vs HCs q = 0.071, CD vs UC q = 0.083). (e) Urinary hippurate (ANOVA p < 0.001, CD vs HCs q = 0.0027, UC vs HCs q < 0.001, CD vs UC q = 0.74). The level of significance is represented by: *q<0.05, nd=no difference.
Figure 4.
Figure 4.
Univariate analyses of serum tryptophan metabolites, inception cohort (a) 5-HIAA (ANOVA p < 0.001, CD vs HCs q = 0.0057, UC vs HCs q < 0.001, CD vs UC q = 0.35) (b) Xanthurenic acid (ANOVA p = 0.0018, CD vs HCs q = 0.0018, UC vs HCs q = 0.20, CD vs UC q = 0.013). (c) Picolinic acid (ANOVA p = 0.0055, CD vs HCs q = 0.0092, UC vs HCs q = 0.56, CD vs UC q = 0.0092). (d) Neopterin (ANOVA p = 0.018, CD vs HCs q = 0.19, UC vs HCs q = 0.015, CD vs UC q = 0.19). (e) Kynurenic acid (ANOVA p = 0.018, CD vs HCs q = 0.015, UC vs HCs q = 0.17, CD vs UC q = 0.10). (f) 3-HAA (ANOVA p = 0.034, CD vs HCs q = 0.031, UC vs HCs q = 0.24, CD vs UC q = 0.12). (g) Quinolinic acid (ANOVA p = 0.039, CD vs HCs q = 0.23, UC vs HCs q = 0.034, CD vs UC q = 0.23). The level of significance is represented by *q<0.05, nd=no difference.
Figure 5.
Figure 5.
Univariate analyses of serum scfas, inception cohort (a) Butyrate (ANOVA p < 0.001, CD vs HCs q < 0.001, UC vs HCs q < 0.001, CD vs UC q = 0.58). (b) Lactate (ANOVA p = 0.0049, CD vs HCs q = 0.11, UC vs HCs q = 0.0034, CD vs UC q = 0.11). (c) Isobutyrate (ANOVA p = 0.029, CD vs HCs q = 0.054, UC vs HCs q = 0.032, CD vs UC q = 0.80). (d) 2-methylbutyrate (ANOVA p = 0.012, CD vs HCs q = 0.24, UC vs HCs q = 0.011, CD vs UC q = 0.13). (e) Isovalerate (ANOVA p = 0.029, CD vs HCs q = 0.054, UC vs HCs q = 0.032, CD vs UC q = 0.80). The level of significance is represented by *q<0.1, nd= no difference.
Figure 6.
Figure 6.
Univariate analyses of serum BAs inception cohort. (a) Glycochendeoxycholic acid (ANOVA p = 0.0065, CD vs HCs q = 0.014, UC vs HCs q = 0.0081, CD vs UC q = 0.89). (b) 5-cholenic acid-3-beta-ol (ANOVA p = 0.0071, CD vs HCs q = 0.011, UC vs HCs q = 0.010, CD vs UC q = 0.98). (c) Glycochenodeoxycholic acid 3-sulfate (ANOVA p = 0.059, CD vs HCs q = 0.078, UC vs HCs q = 0.072, CD vs UC q = 0.90). (d) Glycocholic acid (ANOVA p = 0.0072, CD vs HCs q = 0.19, UC vs HCs q = 0.0062, CD vs UC q = 0.13). (e) Murocholic acid (ANOVA p = 0.0082, CD vs HCs q = 0.45, UC vs HCs q = 0.070, CD vs UC q = 0.0099). (f) Taurocholic acid (ANOVA p = 0.017, CD vs HCs q = 0.58, UC vs HCs q = 0.029, CD vs UC q = 0.059). The level of significance is represented by *q<0.1, nd=no difference.
Figure 7.
Figure 7.
(a) Distribution of correlation values across disease and health states (b) Venn-diagram of strongly positive (r ≥ 0.5) associations across cohorts. (c) Number of strongly positive associations per genera and state (d) Genera with the most variable strongly positive associations across states (e) KEGG pathway enrichment of strongly positive associations across states (f) Associations strongly positively correlated with health and negatively correlated with ulcerative colitis and/or Crohn’s disease.

Similar articles

References

    1. Zhang Y-Z, Li Y-Y.. Inflammatory bowel disease: pathogenesis. World J Gastroenterol: WJG. 2014;20(1):91. doi: 10.3748/wjg.v20.i1.91. - DOI - PMC - PubMed
    1. Wlodarska M, Kostic AD, Xavier RJ. An integrative view of microbiome-host interactions in inflammatory bowel diseases. Cell Host & Microbe. 2015;17(5):577–17. doi: 10.1016/j.chom.2015.04.008. - DOI - PMC - PubMed
    1. Fyderek K, Strus M, Kowalska-Duplaga K, Gosiewski T, Wedrychowicz A, Jedynak-Wasowicz U, Sładek M, Pieczarkowski S, Adamski P, Kochan P, Heczko, PB. Mucosal bacterial microflora and mucus layer thickness in adolescents with inflammatory bowel disease. World J Gastroenterol. 2009;15(42):5287–5294. doi: 10.3748/wjg.15.5287. - DOI - PMC - PubMed
    1. Larsson JM, Karlsson H, Crespo JG, Johansson ME, Eklund L, Sjovall H, Hansson GC. Altered O-glycosylation profile of MUC2 mucin occurs in active ulcerative colitis and is associated with increased inflammation. Inflamm Bowel Dis. 2011;17(11):2299–2307. doi: 10.1002/ibd.21625. - DOI - PubMed
    1. Imhann F, Vich Vila A, Bonder MJ, Fu J, Gevers D, Visschedijk MC, Spekhorst LM, Alberts R, Franke L, van Dullemen HM, Ter Steege, RWF, Huttenhower, C, Dijkstra, G, Xavier, RJ, Festen, EAM, Wijmenga, C, Zhernakova, A, Weersma, RK. Interplay of host genetics and gut microbiota underlying the onset and clinical presentation of inflammatory bowel disease. Gut. 2018;67(1):108–119. doi: 10.1136/gutjnl-2016-312135. - DOI - PMC - PubMed

MeSH terms

Substances

LinkOut - more resources