. 2025 Jul 18:10.1152/physiolgenomics.00136.2024.
doi: 10.1152/physiolgenomics.00136.2024. Online ahead of print.

Dynamic rewiring of microRNA networks in the brainstem autonomic control circuits during hypertension development in the female spontaneously hypertensive rat

Affiliations

Dynamic rewiring of microRNA networks in the brainstem autonomic control circuits during hypertension development in the female spontaneously hypertensive rat

Alison Moss et al. Physiol Genomics. .

Abstract

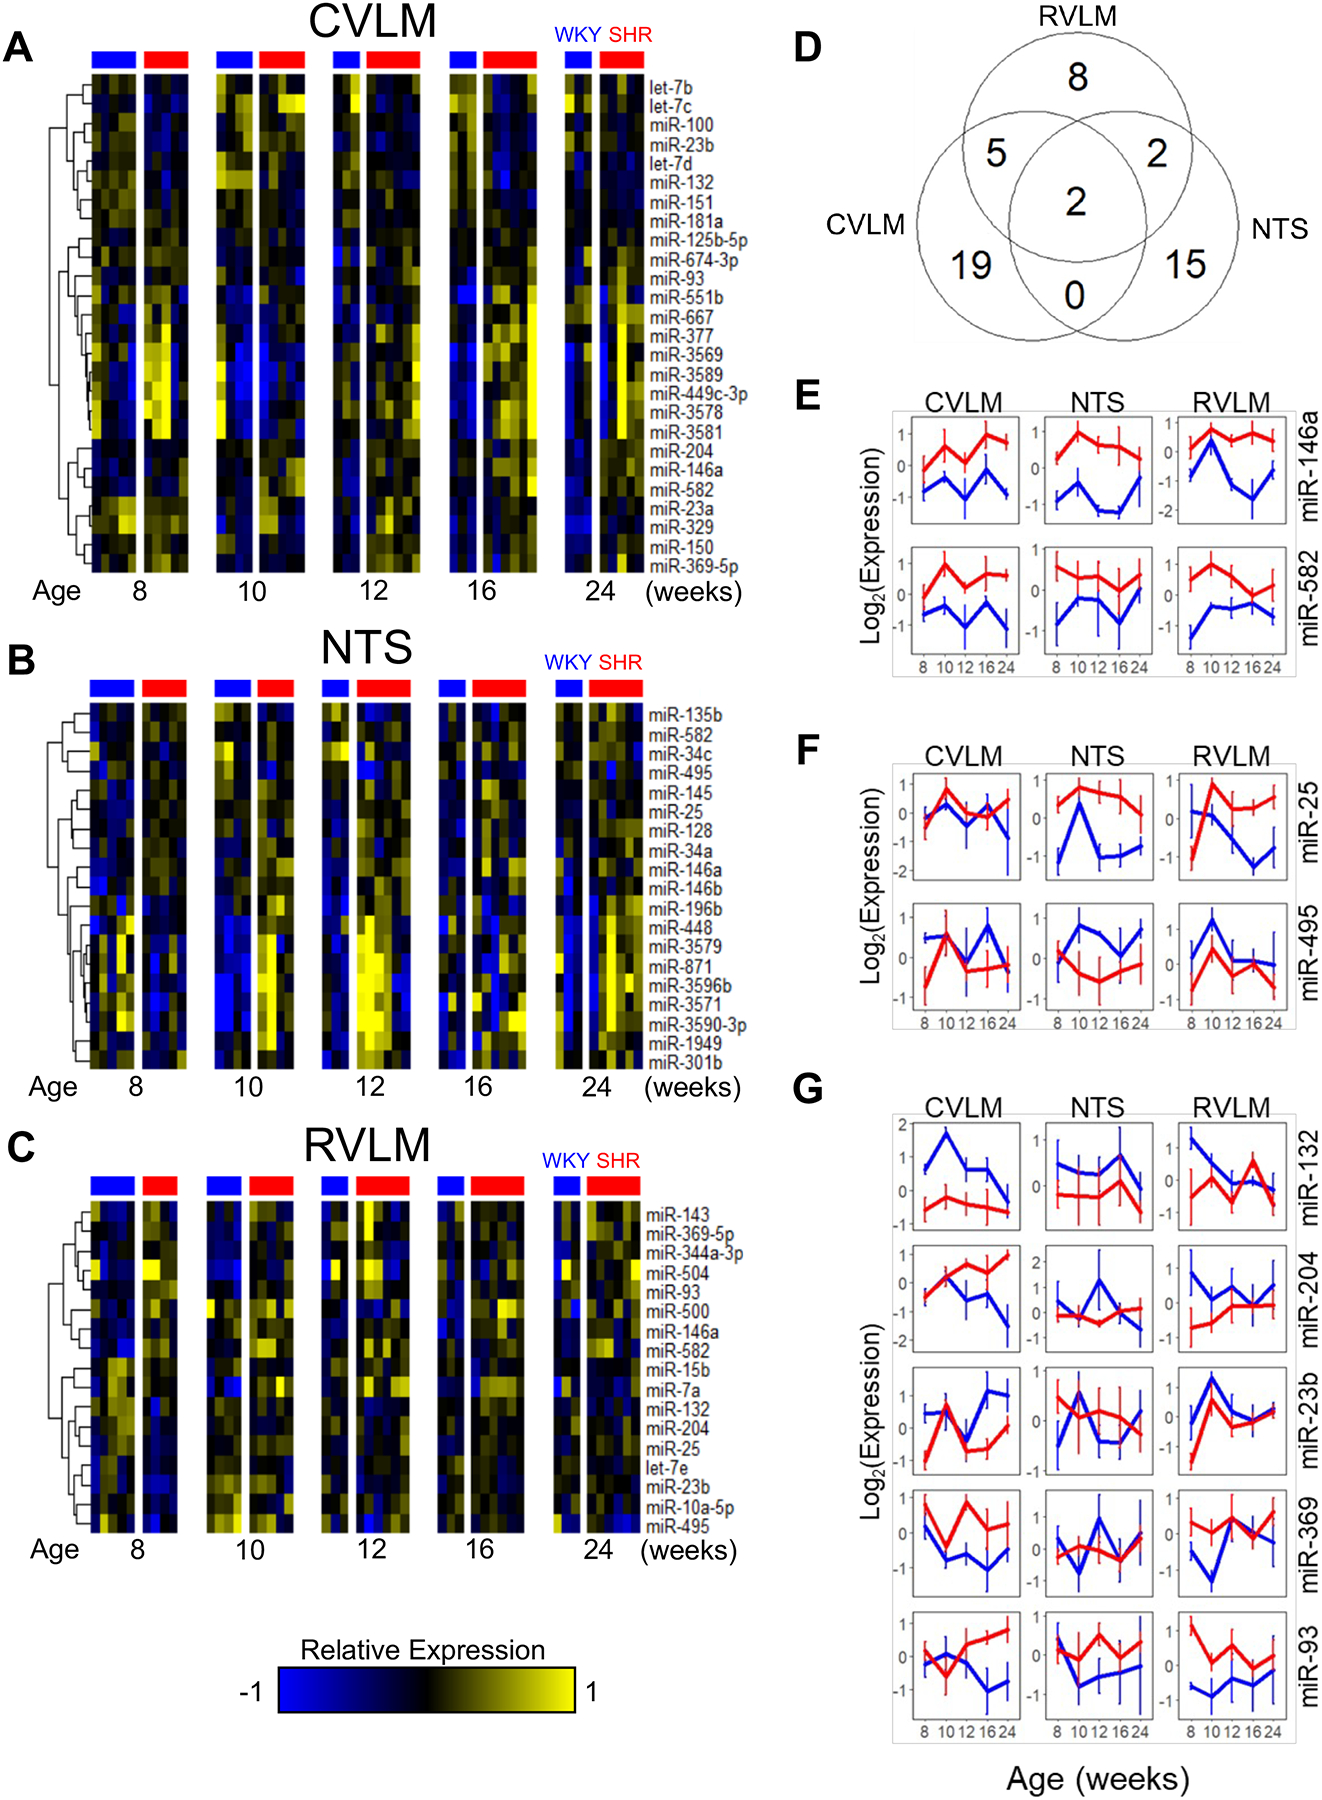
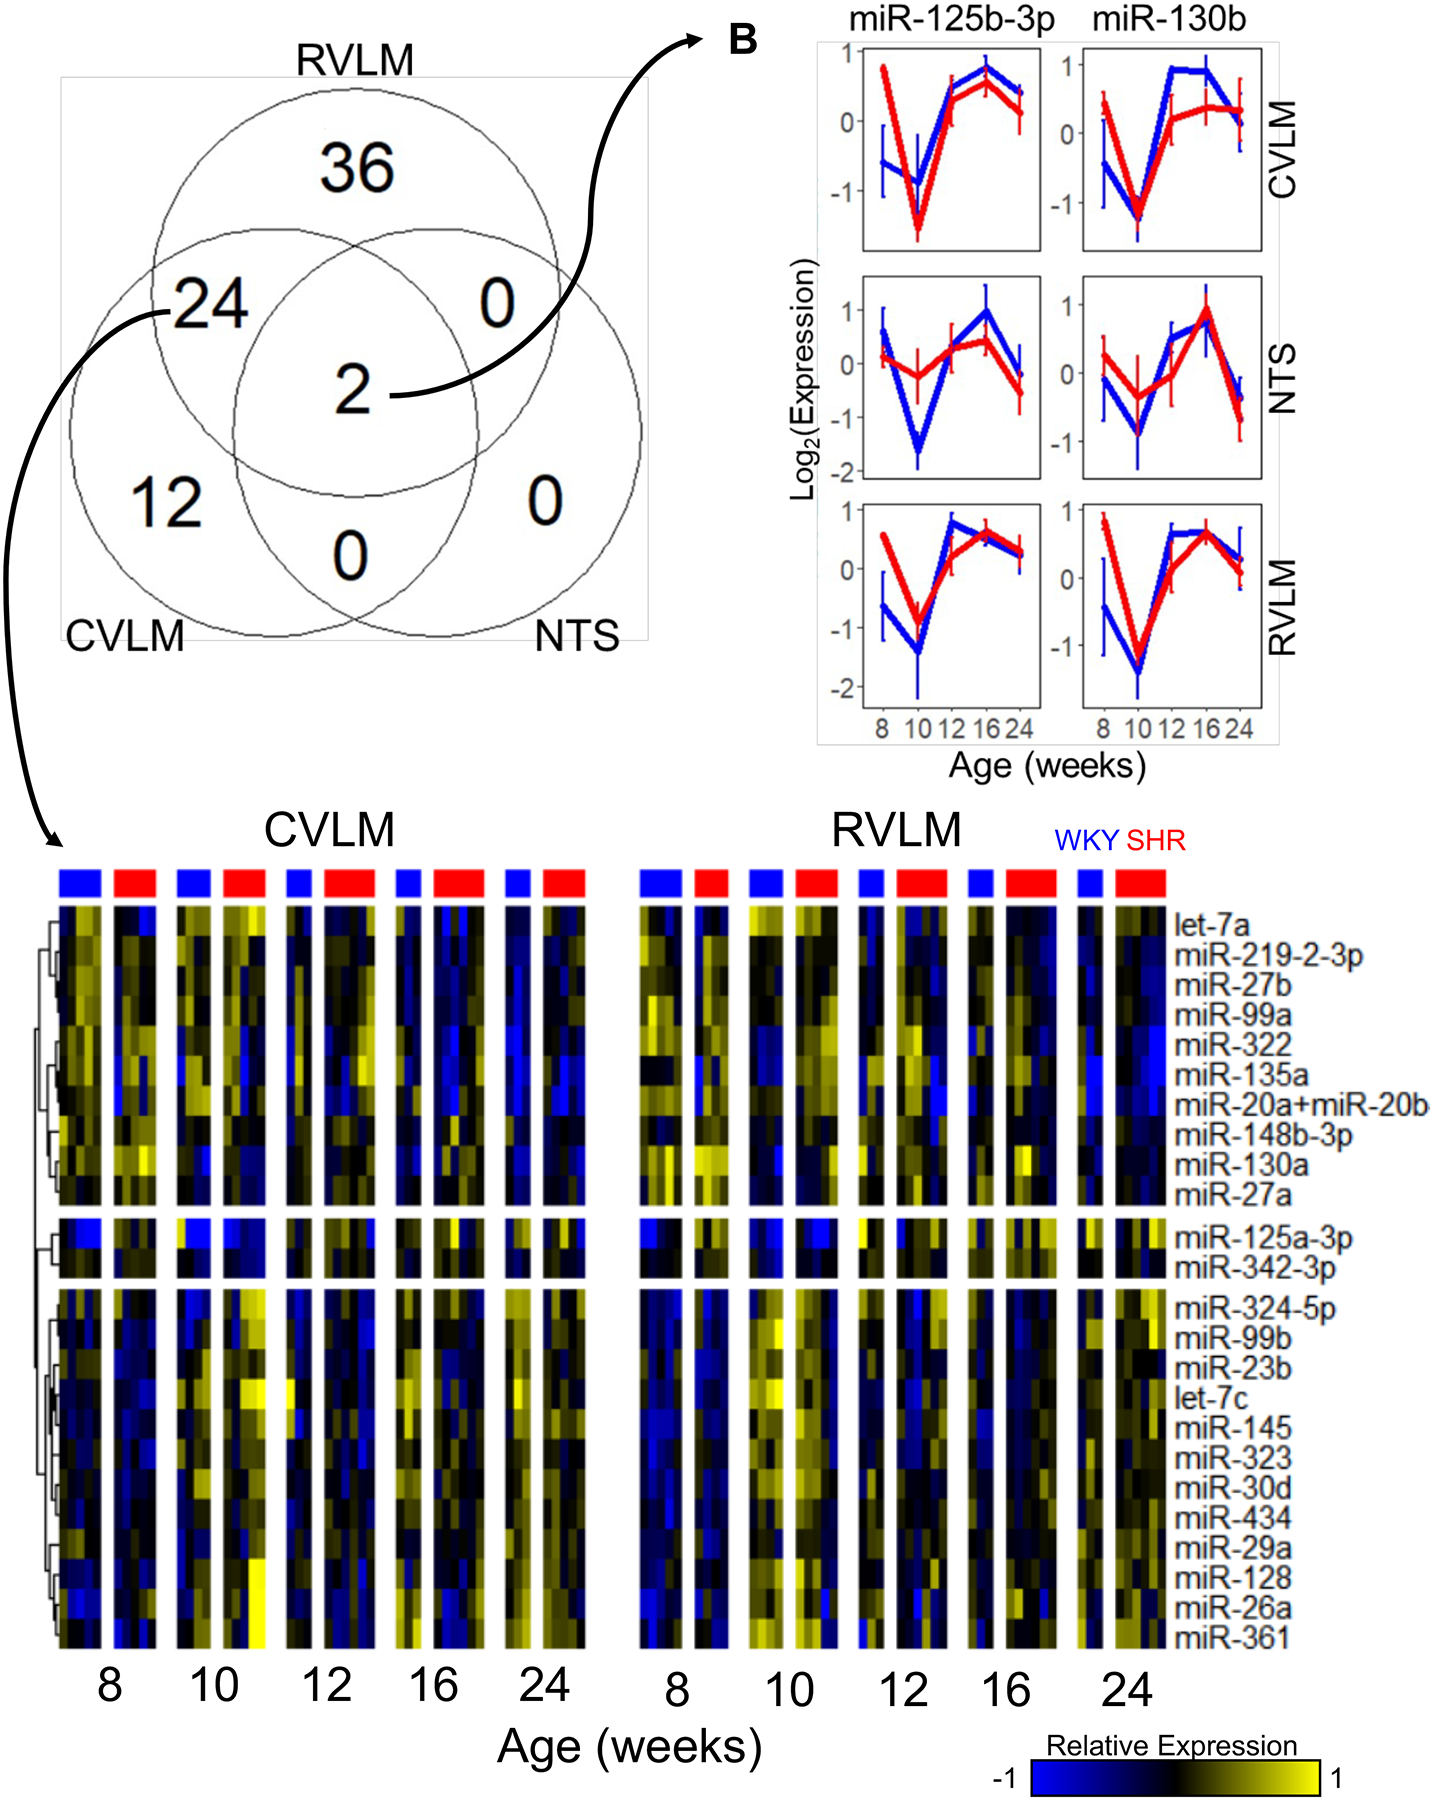
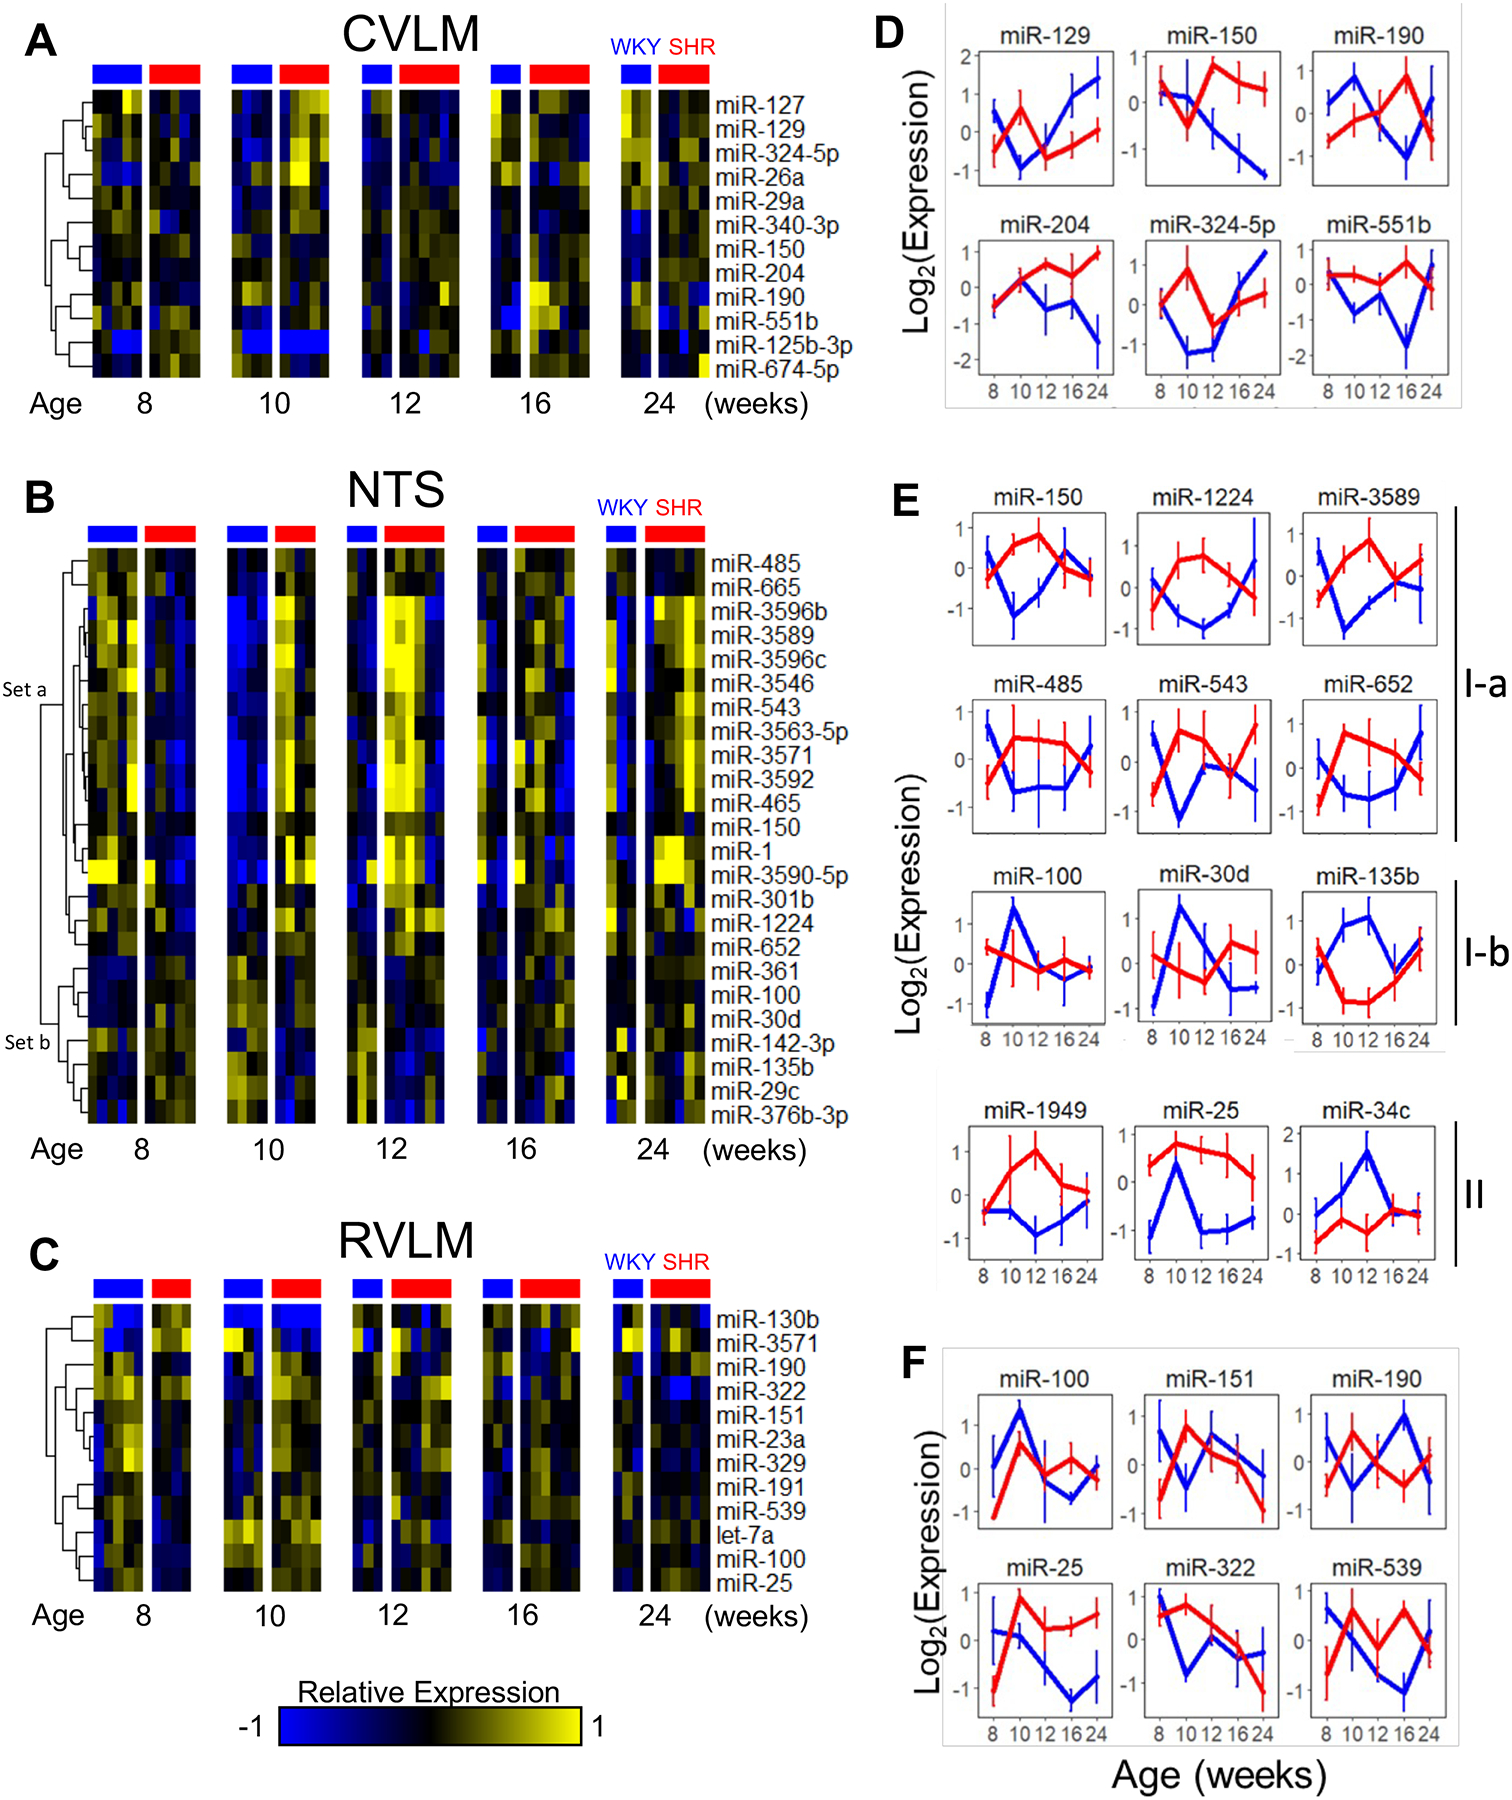
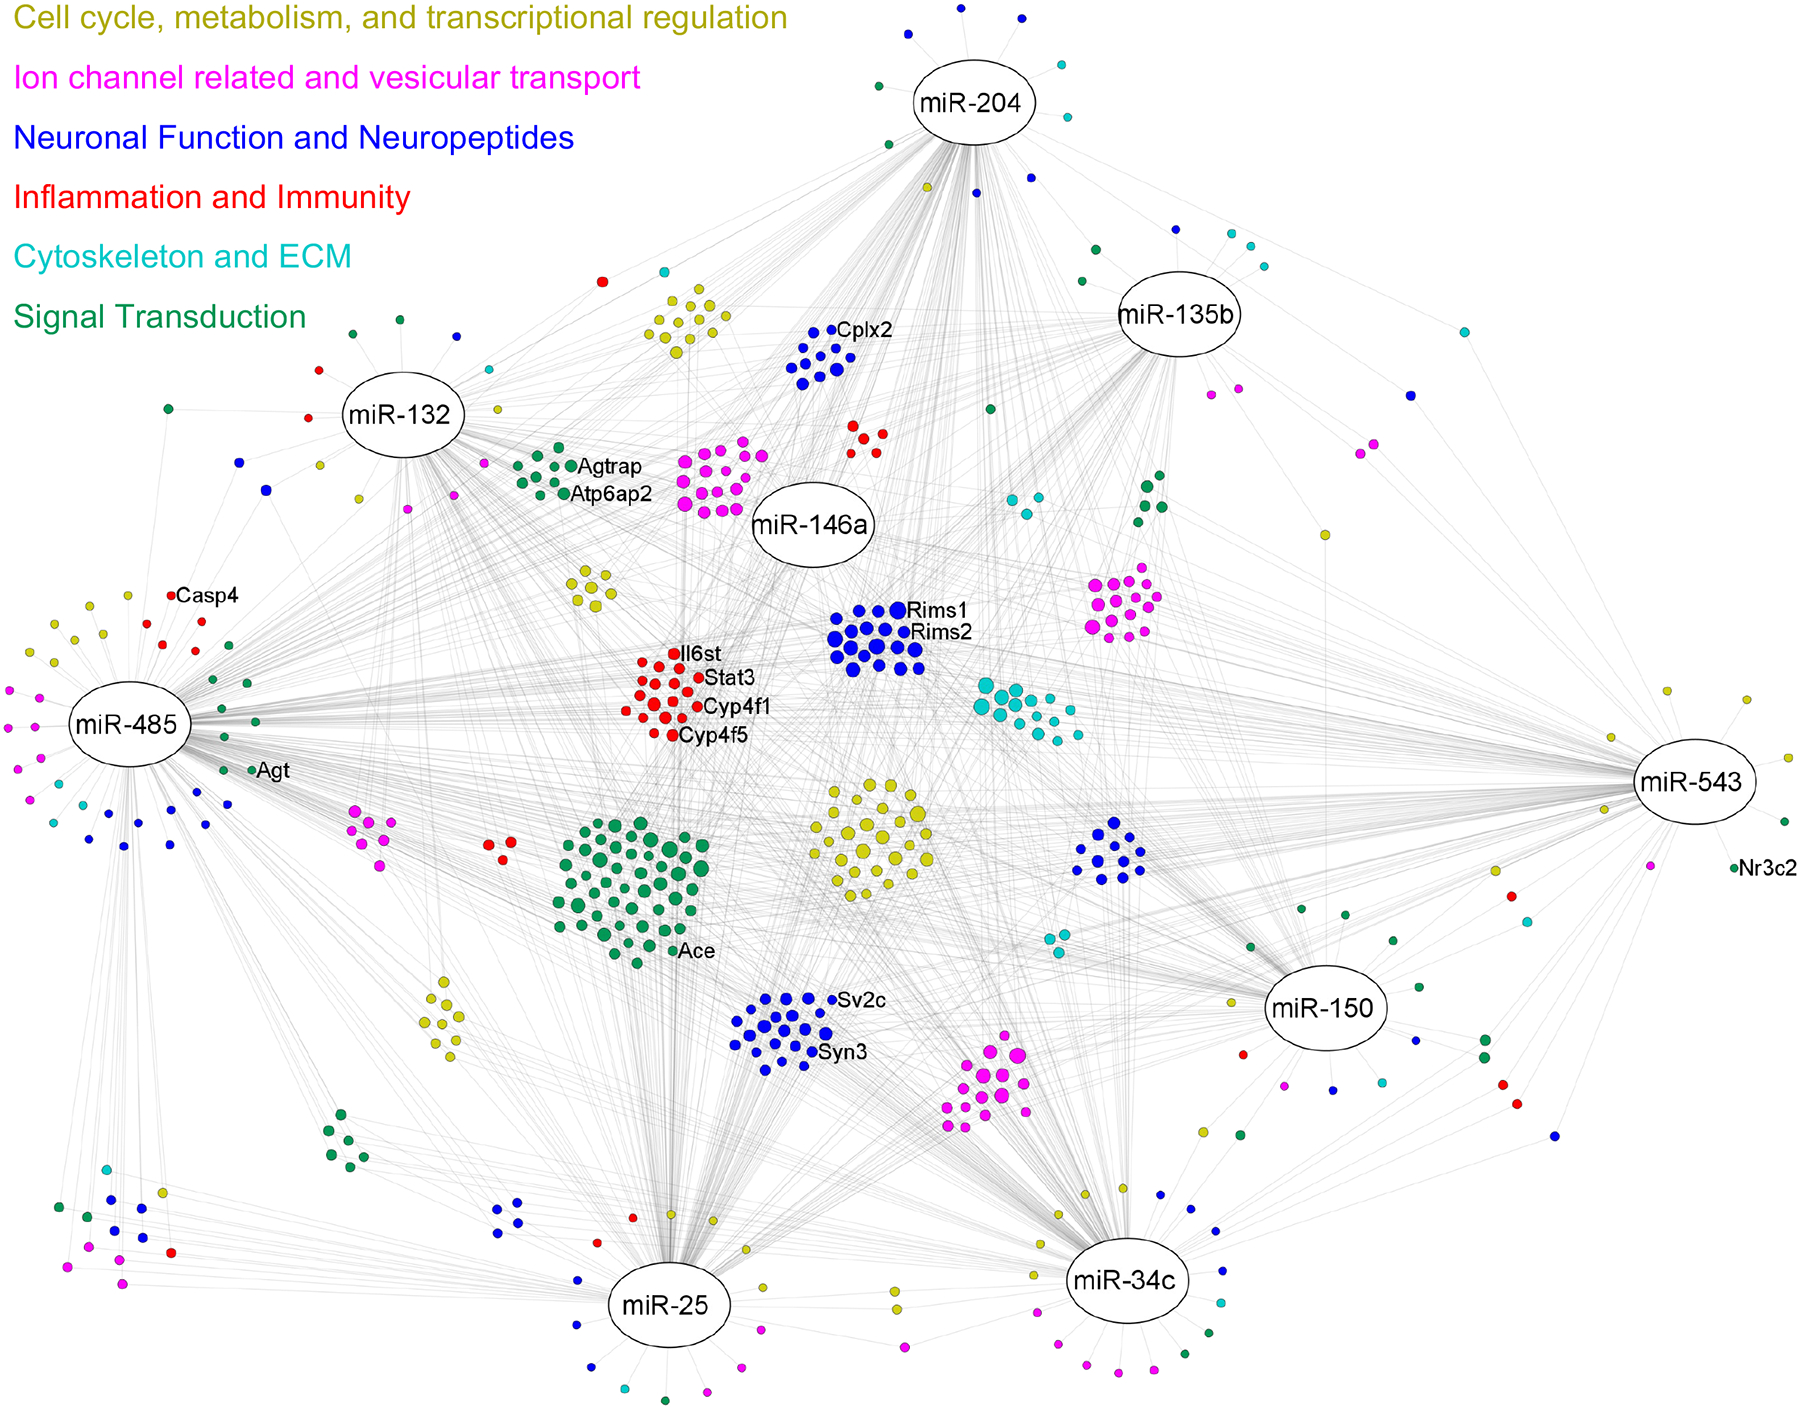
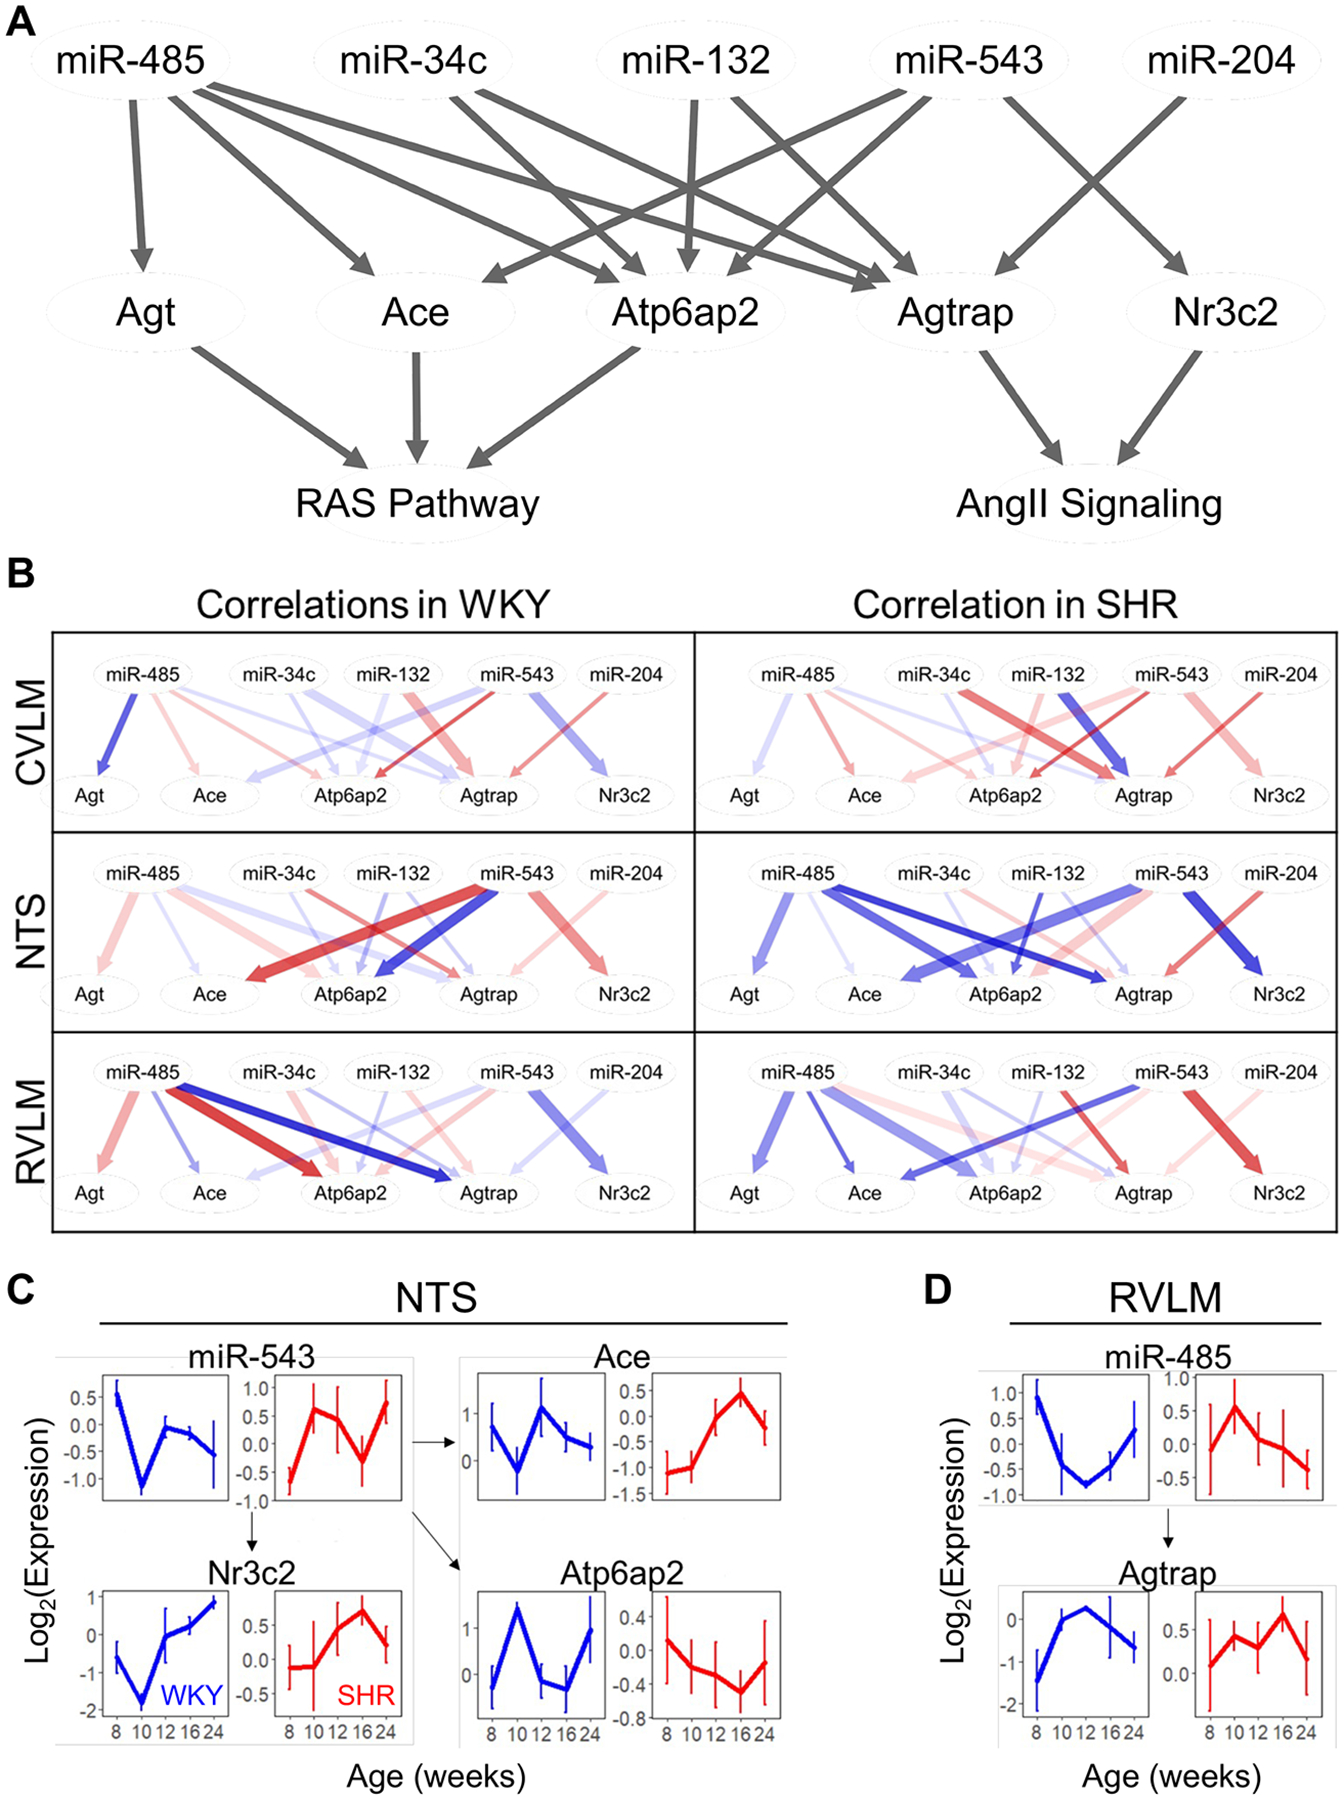
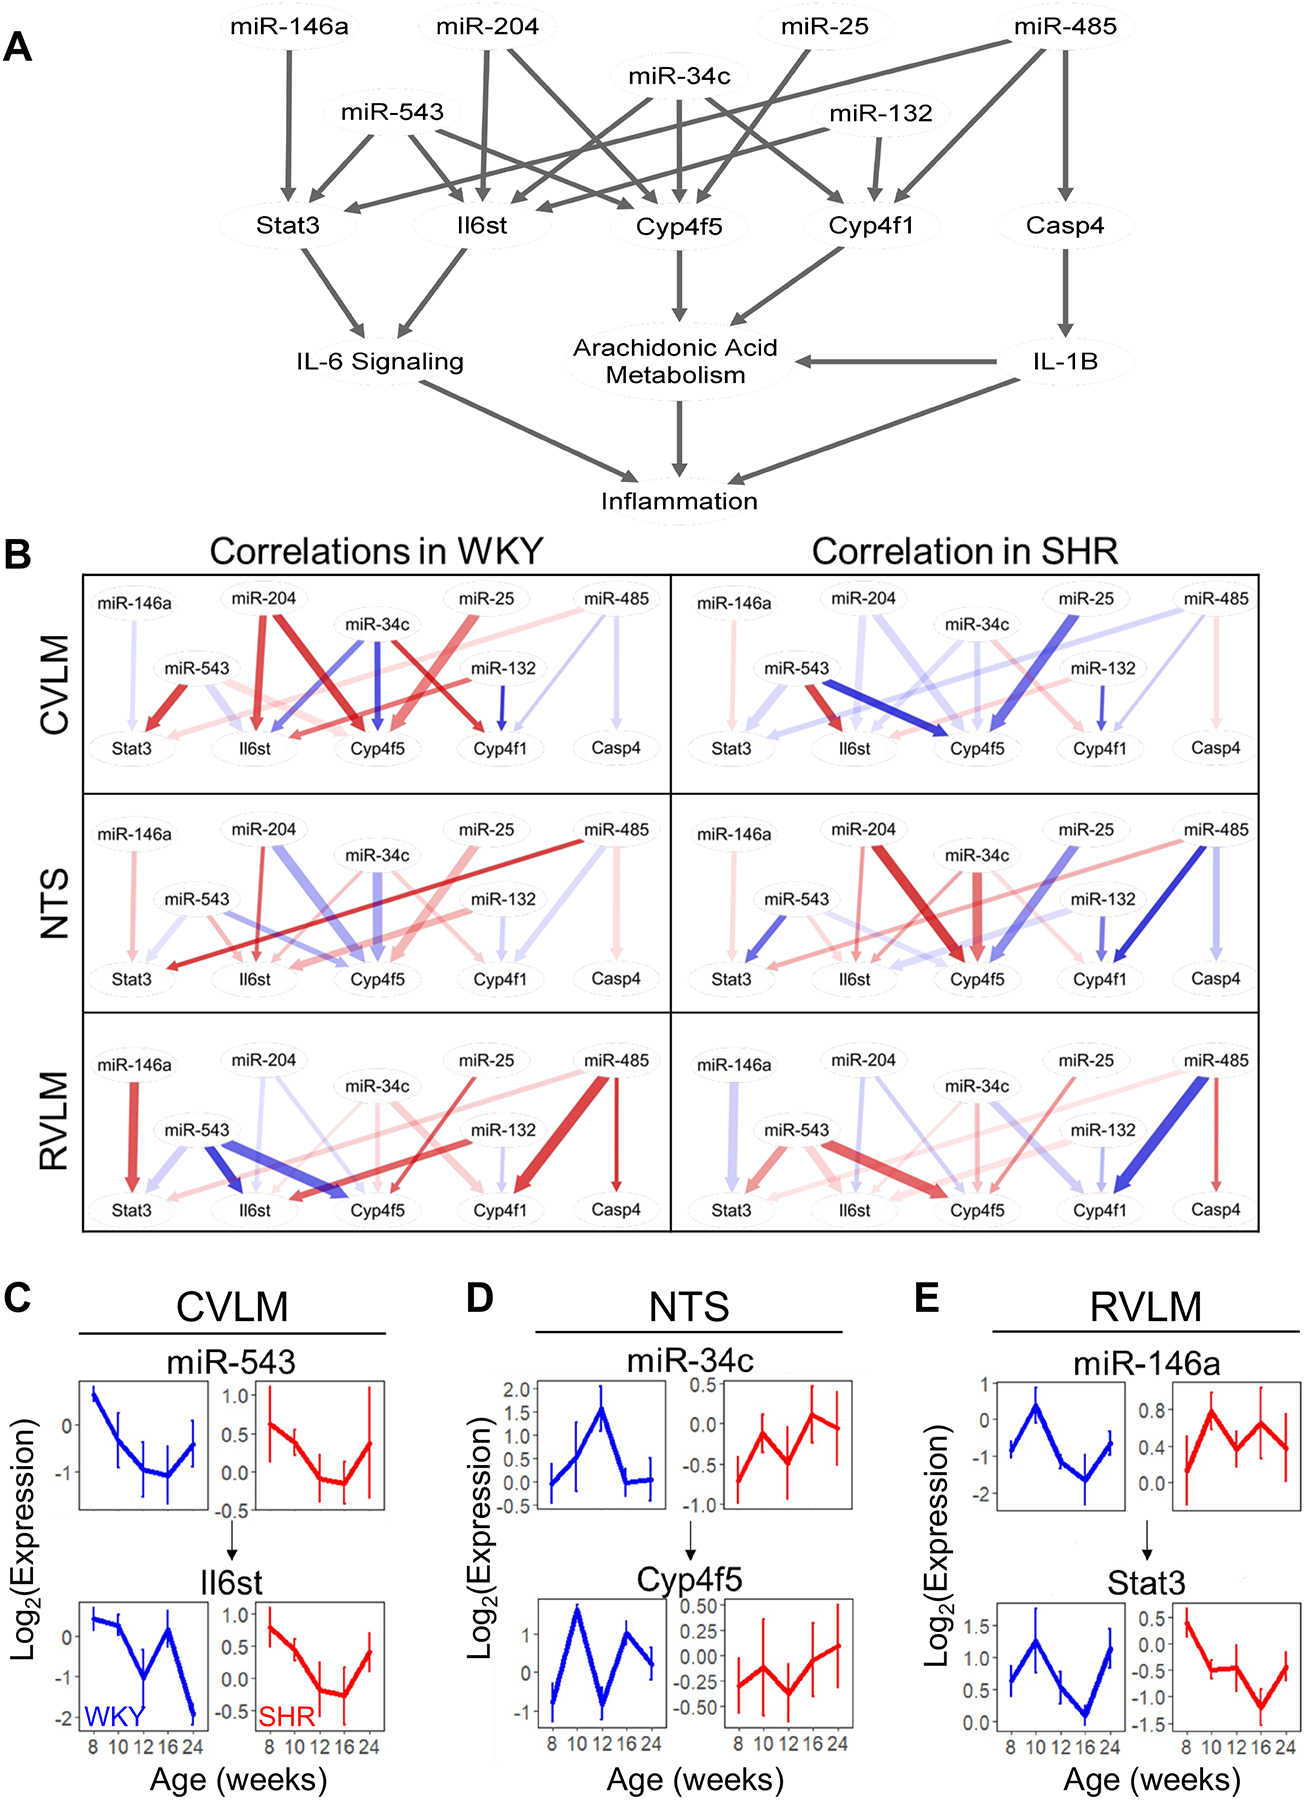
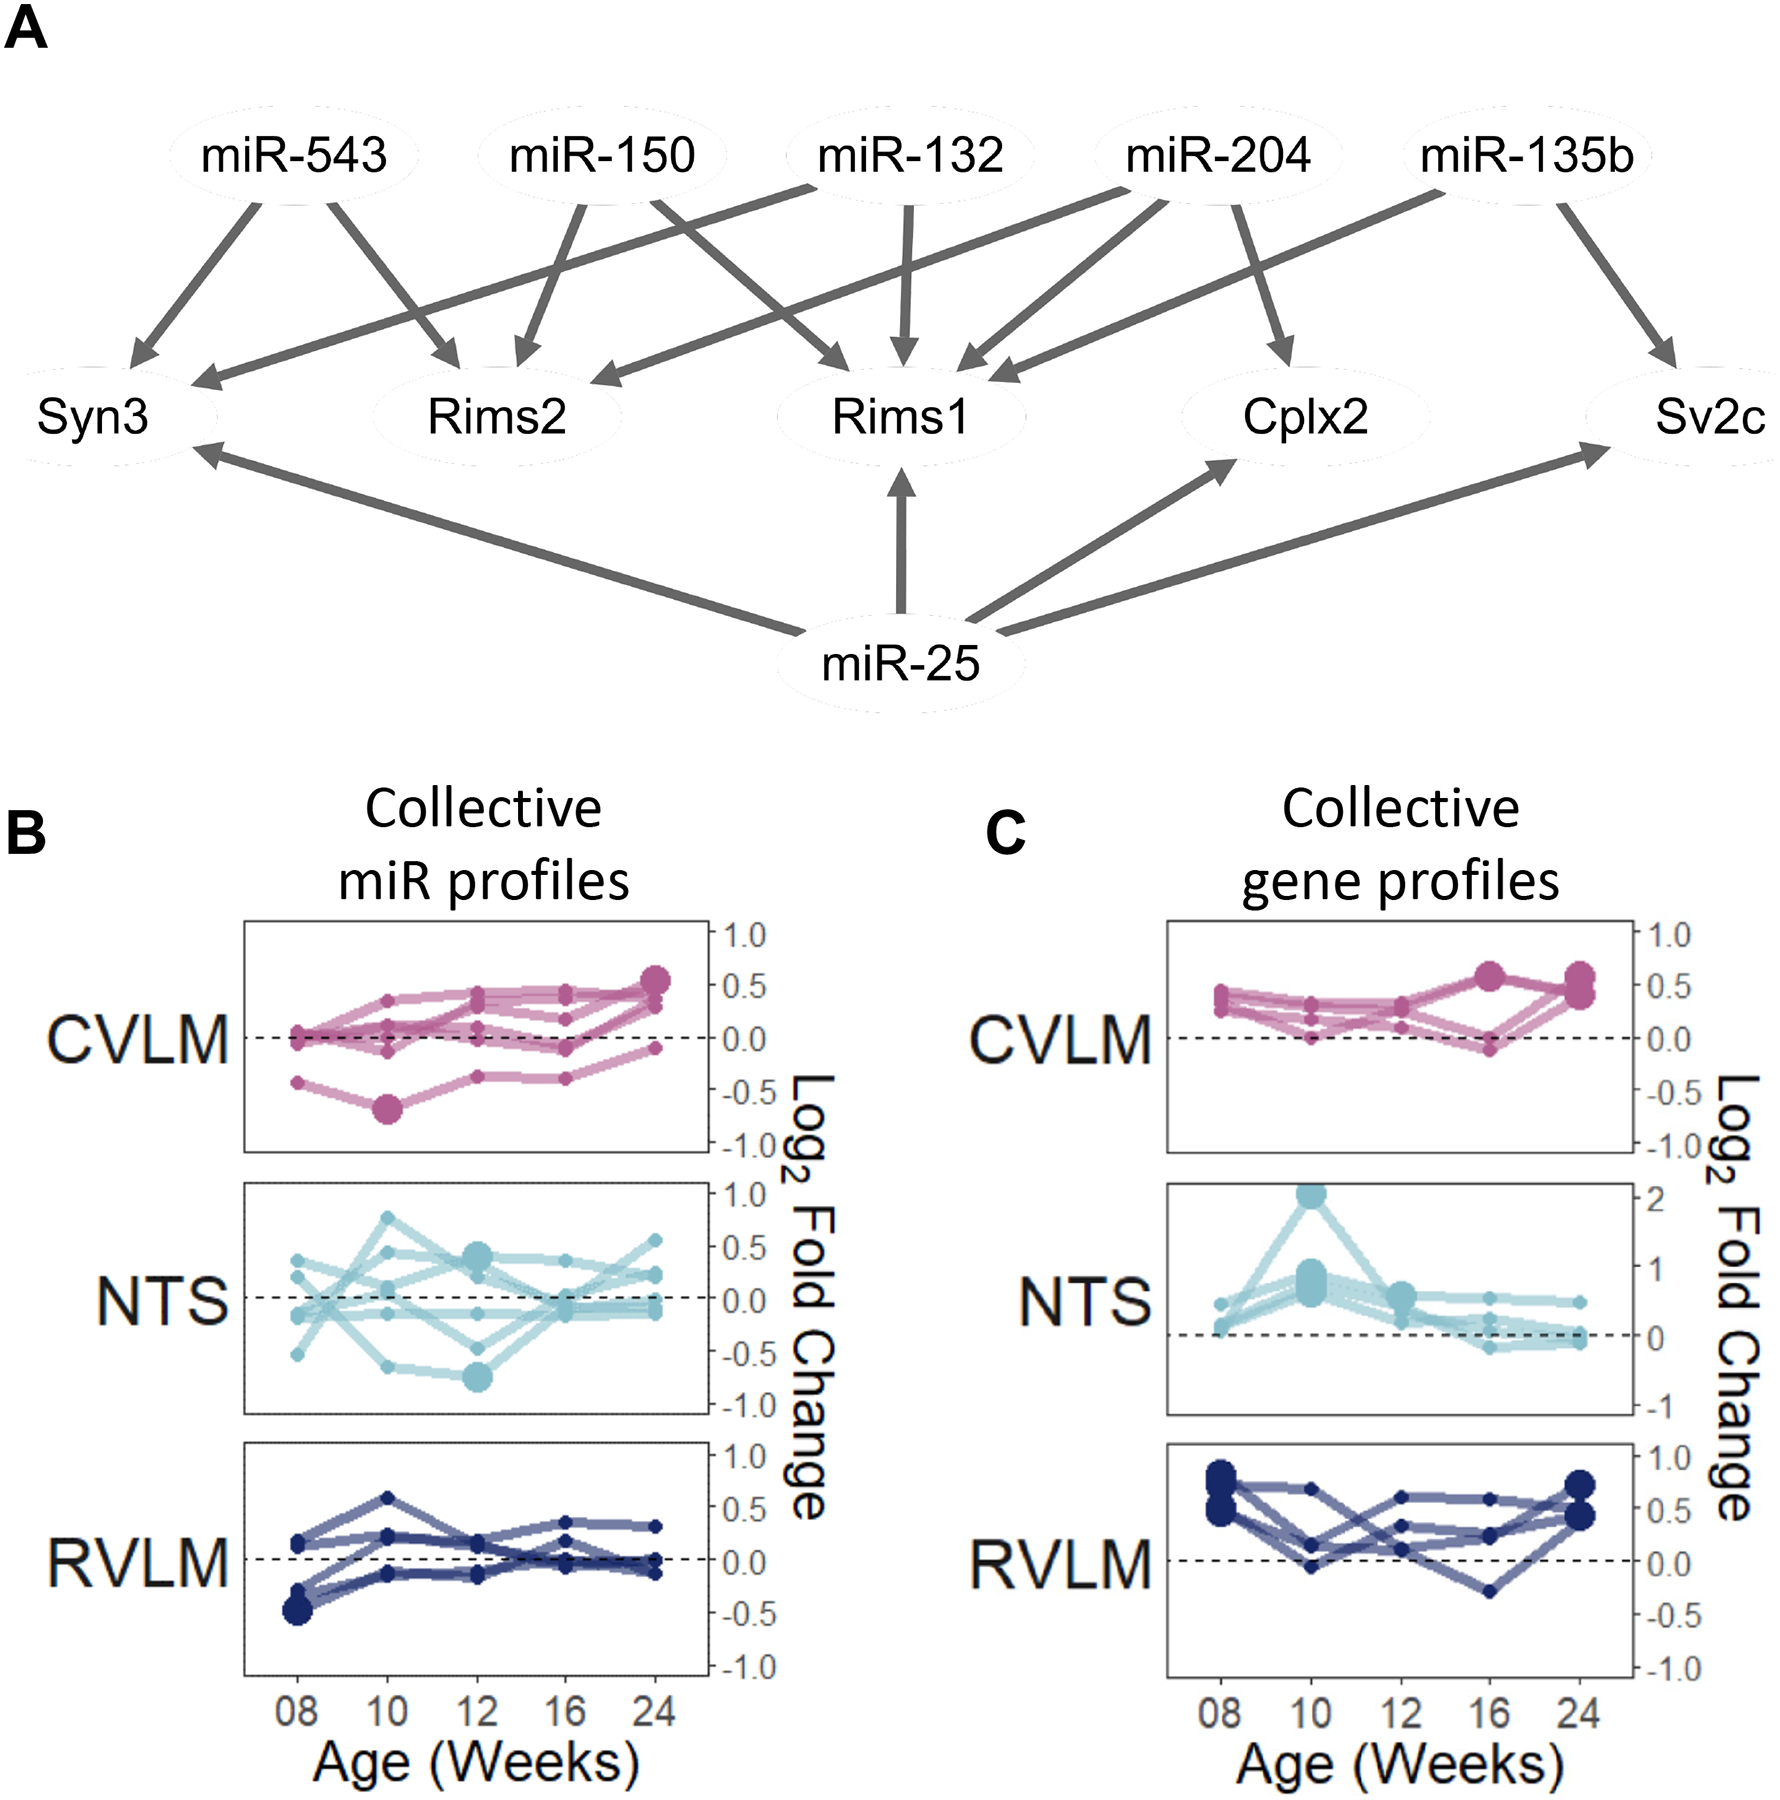
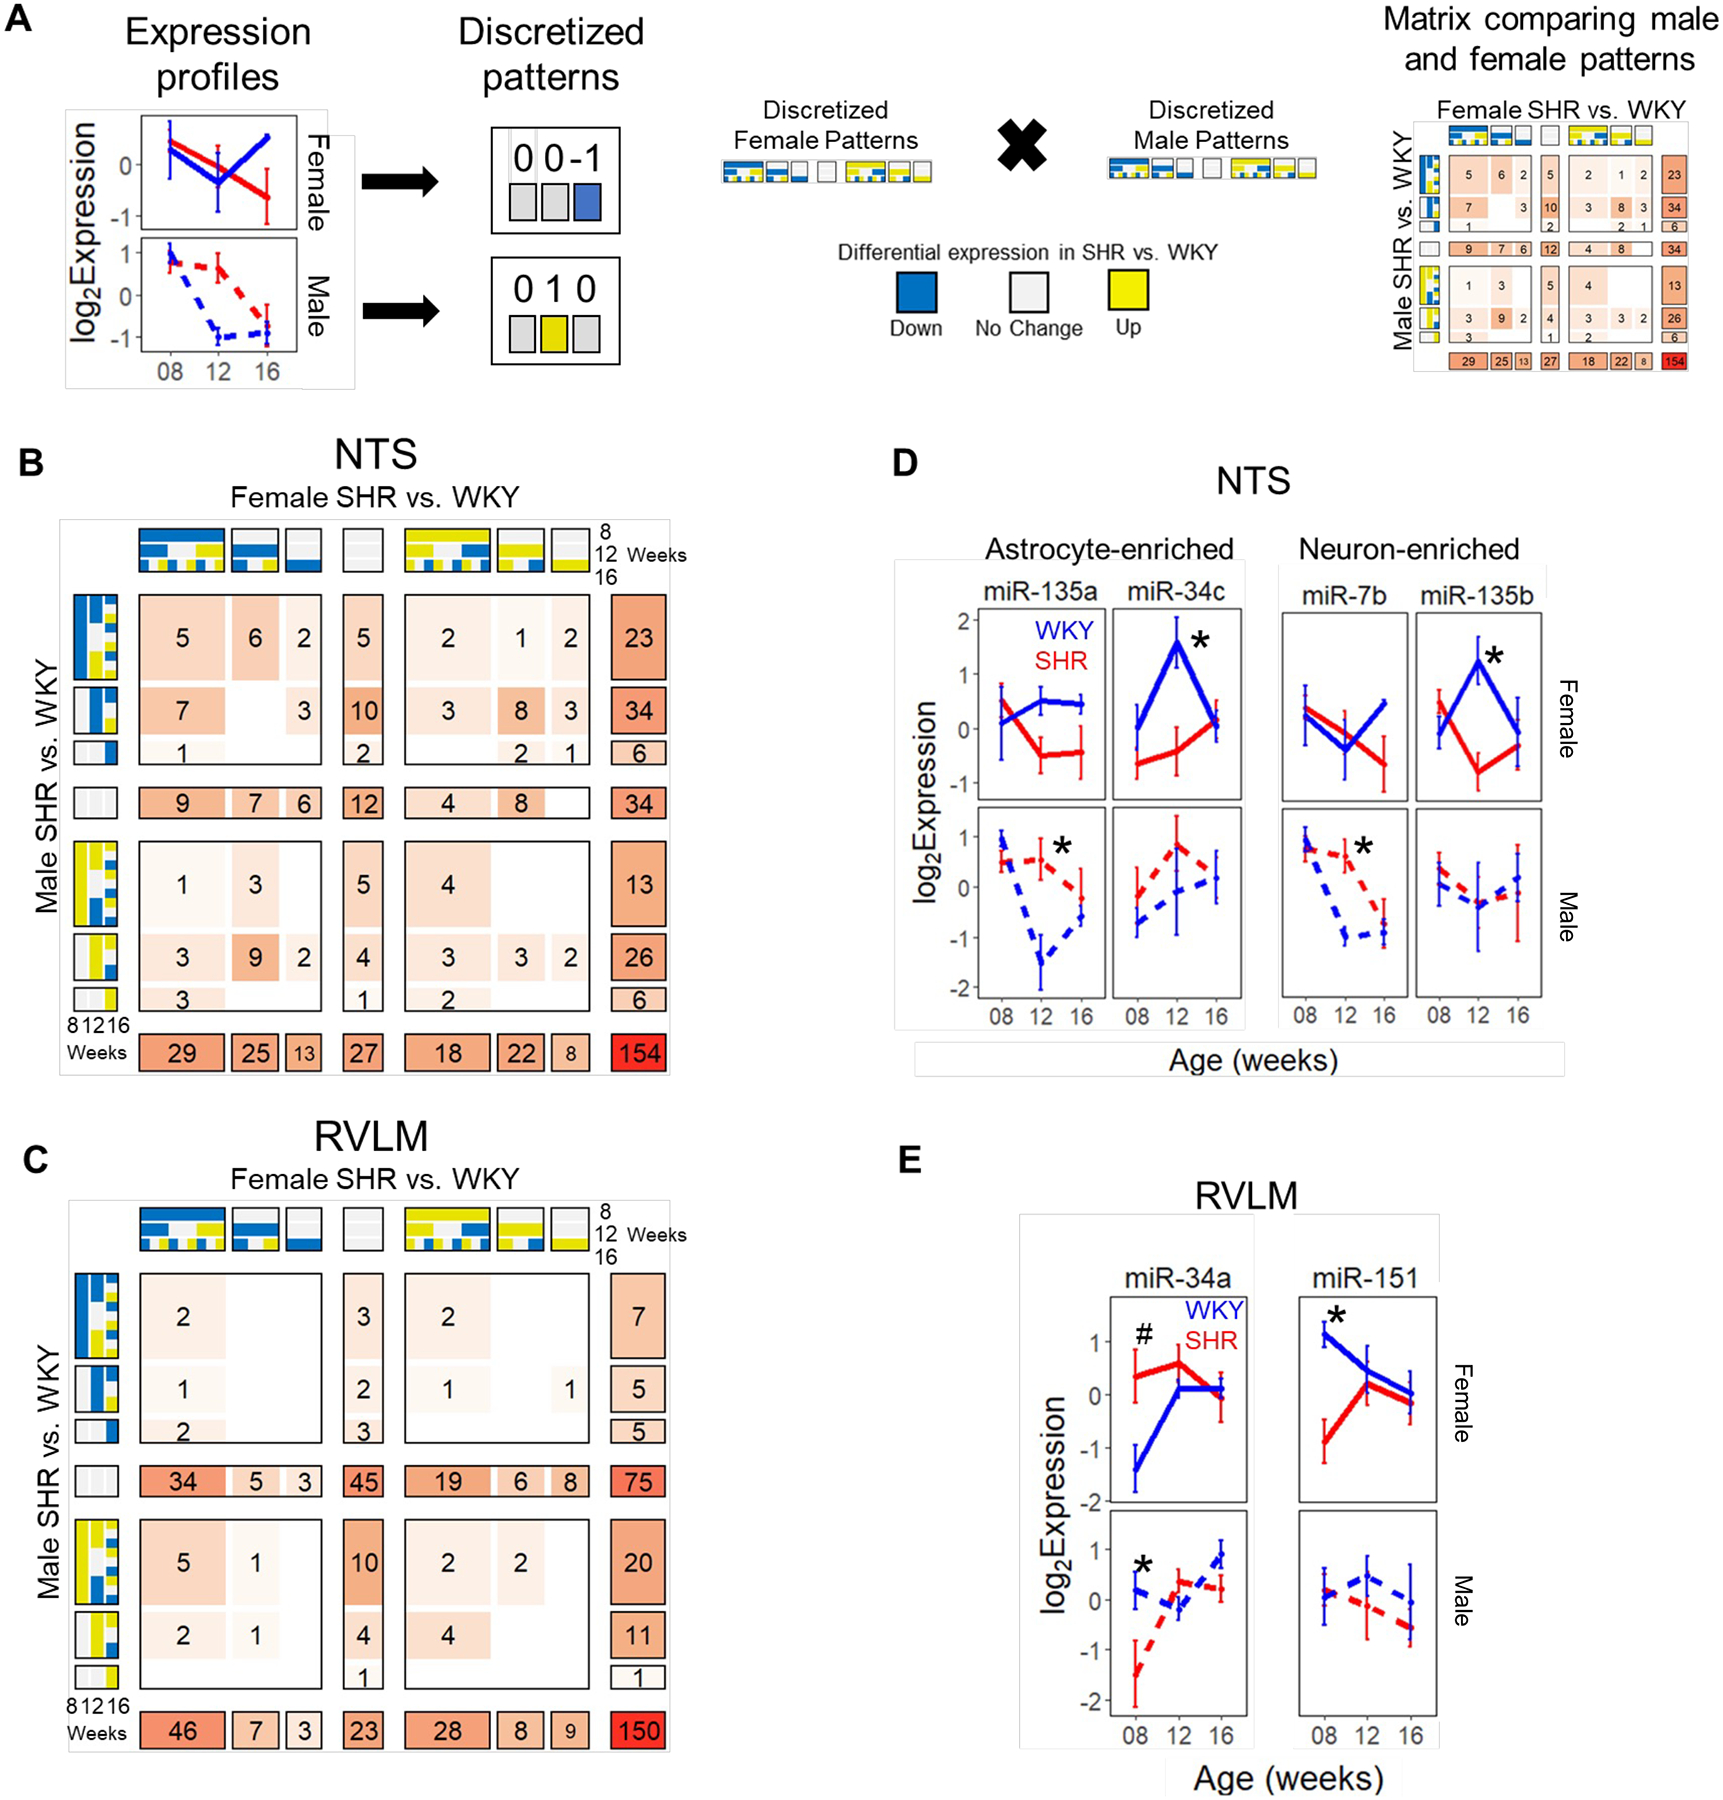
We describe global miRNA changes in the central autonomic control circuits during the development of neurogenic hypertension. Using the female spontaneously hypertensive rat (SHR) and the normotensive Wistar Kyoto (WKY), we analyzed the dynamic miRNA expression changes in three brainstem regions, the nucleus of the solitary tract (NTS), caudal ventrolateral medulla (CVLM), and rostral ventrolateral medulla (RVLM) as a time series beginning at 8 weeks of age prior to hypertension onset through to extended chronic hypertension. Our analysis yielded nine miRNAs that were significantly differentially regulated in all three regions between SHR and WKY over time. We collated computationally predicted gene targets of these nine miRNAs in pathways related to neuronal plasticity and autonomic regulation to construct a putative miRNA target gene network involved in the development of neurogenic hypertension. We analyzed the dynamic correlations between the miRNAs and their putative targets to identify the regulatory interactions shifting between WKY and SHR. Comparing the results with previously published data in male SHR and WKY identified miRNA network dynamics specific to female SHR during hypertension development. Collectively, our results point to distinct rewiring of the miRNA regulatory networks governing angiotensin signaling and homeostasis, neuronal plasticity, and inflammatory processes contributing to the development of hypertension in female SHR.

Keywords: Autonomic Control Circuits; Neurogenic hypertension; Spontaneously Hypertensive Rat; microRNA networks; microRNA profiling.


Conflict of interest statement

Disclosures

No conflicts of interest, financial or otherwise, are declared by the authors.

Figures

Figure 1.
Figure 1.. Differentially regulated miRNAs in the brainstem autonomic nuclei in SHR vs. WKY during the development of hypertension.
A-C) Clustered groups of miRNAs showing strain-dependent differential expression (SHR vs. WKY) in the CVLM (A), NTS (B), and RVLM (C). ANOVA p < 0.05. D) Overlap between NTS, CVLM and RVLM in strain-dependent differential expression of miRNAs. E-G) Dynamic profiles of miRNA showing statistically significant strain-dependent differential expression common to all three regions (E), in the NTS and RVLM (F) and in the CVLM and RVLM (G). (ANOVA p < 0.05). Plots represent mean +/− standard error of normalized expression values.
Figure 2.
Figure 2.. Age-dependent differentially expressed miRNAs in autonomic nuclei.
A) Summary of miRNAs differentially expressed over time across the three autonomic nuclei. ANOVA p < 0.05. B) Dynamic profiles of miRNAs that show statistically significant age-dependent changes in all three autonomic nuclei. Plots represent mean +/− standard error of normalized expression values. C) Clustering of the 24 miRNAs differentially expressed in an age-dependent manner in both CVLM and RVLM suggests three broad groups.
Figure 3.
Figure 3.. Hypertension stage specific differential expression of miRNAs across the brainstem regions.
A-C) Clustered groups of miRNAs showing statistically significant differential expression between strains (SHR vs. WKY) in an age-dependent manner (i.e., the interaction term in ANOVA) in the CVLM (A), NTS (B), and RVLM (C). ANOVA p < 0.05. B) Hierarchical clustering points to two sets of correlated miRNAs in NTS based on the expression pattern in SHR and WKY over time (Sets a and b). D-F) Dynamic profiles of miRNAs differential expressed between strains in an age-dependent manner in the CVLM (D), NTS (E) and RVLM (F). Panel E includes miRNAs that were significant in the NTS for the interaction between strain and age (group I, from both sets a and b shown in panel B) as well as those that showed significant differences between strains in one or more stages in post hoc testing but not the interaction term (group II, not included in panel B). ANOVA p < 0.05, post hoc Tukey p < 0.05. Plots represent mean +/− standard error of normalized expression values.
Figure 4.
Figure 4.. Network representation of nine prioritized miRNAs and their putative target genes.
The miRNA and target gene regulatory network was constructed based on combined predictions from miRWalk and multiMiR tools. The target genes were filtered for pathways known to influence neuronal function, autonomic regulation, and hypertension development. The pathway-filtered gene set was further pruned based on the abundance of expression in one of the three brainstem regions. The nodes representing the genes are colored according to pathway annotation derived from literature and gene ontology. The size of a gene node is scaled to the number of miRNAs predicted to target that gene.
Figure 5.
Figure 5.. SHR vs. WKY differential correlations in the miRNA regulatory network putatively controlling the expression of the renin-angiotensin system and angiotensin II signaling components.
A) Subset of the larger miRNA regulatory network focused on the renin angiotensin system (RAS) pathway and downstream angiotensin II signaling. Arrows from miRNAs to genes represent miRNA-target pairs, while arrows from gene to pathway indicate pathways or processes that the genes influence, regardless of whether they activate or inhibit the pathway in question. B) miRNA regulatory networks detailing the dynamic correlations between miRNAs and their putative targets in the SHR and WKY and the shift in correlations between strains. Edges are mapped to the correlation values in each strain (blue, negative; red, positive, transparency is proportional to overall strength in correlation) and line width is mapped to the difference in correlation between SHR and WKY. C) Dynamic profiles of miR-543 and its putative targets Nr3c2, Ace, and Atp6ap2 (prorenin receptor, PRR) in the NTS, illustrating the shift in dynamic correlation between WKY (blue) and SHR (red). Pearson correlation shifts from 0.75 to −0.94 for Nr3c2, 0.92 to −0.81 for Ace, −0.92 to 0.59 for Atp6ap2. D) Dynamic profiles of miR-485 and its putative target Agtrap in the RVLM, illustrating the negative correlation in WKY (blue; corr = −0.99) that is lost in SHR (red, corr = 0.04). Plots represent mean +/− standard error of normalized expression values.
Figure 6.
Figure 6.. Hypertension-dependent shift in miRNA regulatory network correlations influencing inflammatory signaling.
A) Subset of the larger miRNA regulatory network focused on inflammatory signaling. Arrows from miRNAs to genes represent miRNA-target pairs while arrows from gene to pathway indicate pathways or processes that the genes influence, regardless of whether they activate or inhibit the pathway in question. B) miRNA regulatory networks detailing the dynamic correlations between miRNAs and their putative targets in the SHR and WKY and the shift in correlations between strains. Edges are mapped to the correlation values in each strain (blue, negative; red, positive, transparency is proportional to overall strength in correlation) and line width is mapped to the difference in correlation between SHR and WKY. C) Dynamic profiles of miR-543 and its putative target Il6st in the CVLM, illustrating the shift in dynamic correlation between WKY and SHR where miR-543 and Il6st are positively correlated in the SHR. Pearson correlation shifted from −0.27 in WKY to 0.96 in SHR. D) Dynamic profiles of miR-34c and its putative target Cyp4f5 in the NTS, illustrating the shift in dynamic correlation between WKY and SHR where there is a shift from negative to positive correlation (corr = −0.69 to 0.84). E) Dynamic profiles of miR-146a and its putative target Stat3 in the RVLM, illustrating the shift in dynamic correlation between WKY and SHR where there is a shift from positive to negative correlation (corr = 0.91 to −0.52). Plots represent mean +/− standard error of normalized expression values.
Figure 7.
Figure 7.. Hypertension-dependent differential correlations in the miRNA regulatory network putatively influencing synaptic vesicle trafficking.
A) A subset of the larger miRNA regulatory network highlighting genes involved in synaptic vesicle trafficking. B-C) Collective profiles of the miRNAs (B) and genes (C) involved in regulation of synaptic vesicle trafficking. Values represent the pairwise log2(fold change) in SHR compared to WKY at each time point. Enlarged points represent statistically significant data. For the collective miR profiles, enlarged points represent p < 0.1 based on Tukey’s Honest Significant Difference post hoc analysis. For the collective gene profiles, enlarged points represent q < 0.2 based on DESeq analysis.
Figure 8.
Figure 8.. Comparative pattern count analysis (COMPACT) to analyze similarities and differences between male and female dynamic miRNA expression profiles.
A) miRNA differential expression profiles are discretized into three digit codes based on whether or not a given miRNA is up- or downregulated above a certain threshold in SHR compared to WKY at each time point (differential average Z-score of 0.75). Upregulation in SHR compared to WKY is designated with a ‘1’ and colored in yellow, downregulation is designated with a ‘−1’ and shown in blue. ‘0’ indicates no dysregulation and is shown in grey. The discretized pattern approach was applied to the female SHR dataset as well as the available male SHR data at the time points common to both datasets: 8, 12, and 16 weeks. The data transformation results in a possible 27 patterns for each miRNA profile (3 discretizations, 3 timepoints, 33 = 27), which are subsequently grouped based on the time point of initial dysregulation in SHR. Intersecting the 1-way distributions of the male and female pattern counts results in a histogram matrix representing the 2-way distribution of miRNA dysregulatory patterns. B-C) COMPACT matrix comparing male and female discretized differential expression patterns in the NTS (B) and RVLM (C). D-E) Comparison of dynamic profiles of miRNAs showing differential expression in either male (bottom) or female (top) SHR at the onset in NTS (D) and at the prehypertensive stage in RVLM (E). (✱p < 0.05, #p < 0.1). Plots represent mean +/− standard error of normalized expression values.

Similar articles

References

    1. Zhou S-S, Jin J-P, Wang J-Q, Zhang Z-G, Freedman JH, Zheng Y, Cai L. miRNAS in cardiovascular diseases: potential biomarkers, therapeutic targets and challenges. Acta Pharmacol Sin 39: 1073–1084, 2018. 10.1038/aps.2018.30. - DOI - PMC - PubMed
    1. Siasos G, Tousoulis D, Tourikis P, Mazaris S, Zakynthinos G, Oikonomou E, Kokkou E, Kollia C, Stefanadis C. MicroRNAs in cardiovascular therapeutics. Curr Top Med Chem 13: 1605–1618, 2013. 10.2174/15680266113139990109. - DOI - PubMed
    1. Wang J, Zhang J, Ding X, Wang Y, Li Z, Zhao W, Jia J, Zhou J, Ge J. Differential microRNA expression profiles and bioinformatics analysis between young and aging spontaneously hypertensive rats. Int J Mol Med 41: 1584–1594, 2018. 10.3892/ijmm.2018.3370. - DOI - PMC - PubMed
    1. Marques FZ, Booth SA, Charchar FJ. The emerging role of non-coding RNA in essential hypertension and blood pressure regulation. J Hum Hypertens 29: 459–467, 2015. 10.1038/jhh.2014.99. - DOI - PubMed
    1. Badawy H, Mesbah N, Abo-El-Matty D. A Brief review of Circulating MicroRNAs and Essential Hypertension. Records of Pharmaceutical and Biomedical Sciences 2: 32–45, 2018. 10.21608/rpbs.2018.5986.1016. - DOI

LinkOut - more resources