. 2025 Jul 18;20(7):e0326881.
doi: 10.1371/journal.pone.0326881. eCollection 2025.

Transcranial photobiomodulation therapy with 808 nm light changes expression of genes and proteins associated with neuroprotection, neuroinflammation, oxidative stress, and Alzheimer's disease: Whole RNA sequencing of mouse cortex and hippocampus

Affiliations

Transcranial photobiomodulation therapy with 808 nm light changes expression of genes and proteins associated with neuroprotection, neuroinflammation, oxidative stress, and Alzheimer's disease: Whole RNA sequencing of mouse cortex and hippocampus

Binjun Li et al. PLoS One. .

Abstract

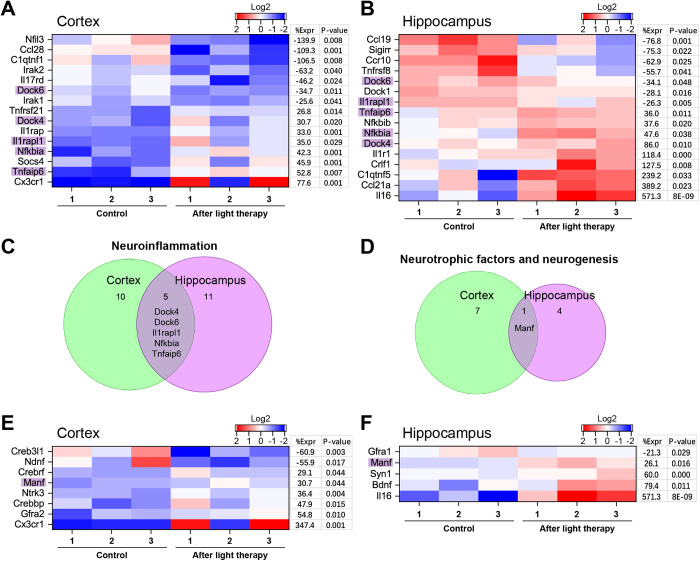
Light therapy, using red and near-infrared (NIR) irradiation, is currently applied for the treatment of various neurodegenerative diseases, such as Alzheimer's disease (AD). Transcranial photobiomodulation therapy (tPBMT) can alleviate neurodegeneration, neuronal loss, and β-amyloid peptide plaque burden. Alternatively, potential early inhibition of oxidative stress, neuroinflammation, apoptosis, and amyloidogenic cellular pathways may constrain pathological changes with aging. In this research, we conduct an 808-nm tPBMT with a 30-day course of daily 1-hour sessions for mice and assess its influence on molecular mechanisms related to the potential onset of neurodegeneration. To comprehensively identify molecular mechanisms of tPBMT on the brain cells, the next-generation whole RNA sequencing of over 30,000 mRNA of the cortex and hippocampus of BALB/c mice is performed. After tPBMT, transcriptional alterations are found in 1,005 genes in the hippocampus and 1,482 genes in the cortex. Pathway-gene enrichment network analysis identifies genes associated with about 20 pathways of neurodegeneration, and a disease-gene network is constructed. Particularly, tPBMT alters the transcription and expression of the essential genes associated with oxidative stress (NF-κBIα, JUN, JUND, and PKC genes), inflammation (DOCK4/6, IL-1RAPL1, and TNFαIP6), and apoptosis (CASP3, TNFαIP6, AKT3, CDKN1A, CYP51, RASA2, and RESTAT). Additionally, 808-nm light modulates the main risk genes for AD (BACE1, BACE2, PSEN2, APH1B, GATA2, YY2, RELA, STAT3, JUN, JUND, ARNTL, CREB3L1, CELF2, E2F4, ELK3, and CEBPD), involved in APP processing supporting AD development. Moreover, the APP concentration is reduced after tPBMT. Hence, PBMT may help inhibit the development of different neurodegeneration types and maintain normal brain conditions.


Conflict of interest statement

None of the authors has a conflict of interest. All the data are available on request to authors.

Figures

Fig 1
Fig 1. Transcranial light therapy (tPBMT).
(A) The experimented mice with shaved heads were placed in a chamber illuminated by an 808-nm LED array with a power density of 30 mW/cm2; a schematic illustration of LED arrays showed the distribution of light in a chamber. (B) Schematically illustrated measurements of the power density of incident light at the top of the mouse skull and the light penetration through the skull tissues. (C) The monitoring of temperature on a shaved mouse head during PBM treatment. The thermal imaging camera shows that the temperature of the head skin does not rise above 34°C.
Fig 2
Fig 2. Whole-transcriptome analysis of two brain regions of BALB/c mice.
(A) Statistically significant differentially expressed coding RNAs in the hippocampus and cortex of BALB/c mice after transcranial 808 nm light therapy. (B) Differential expression gene screening. Each point of the volcano chart represents a gene; the abscissa represents the value of log2FC, and │log2FC│ ≥ 1 is set as a significantly different gene, where the dots of ≥1/ ≤ –1 represent genes significantly upregulated/downregulated in the experimental group compared to the control group; the ordinate represents –log10 (P-value) and when p ≤ 0.05, so, significantly different genes. Therefore, the blue and purple dots on the left of 0 represent significantly downregulated genes, the red and purple dots on the right represent significantly upregulated genes, and the gray dots represent the non-significant difference genes. (C) Venn diagram for the indicated comparisons showing overlap among the up- and down-regulated genes identified by RNA-seq in different brain regions after light therapy.
Fig 3
Fig 3. Significant enrichment tree chart of genes modulated by 808 nm light in the hippocampus.
Each gene ontology (GO) category of molecular functions shows the top 10 GOs with significant enrichment (in the boxes). Each node represents a GO, with the color depth indicating the degree of enrichment. The darker the color, the higher the degree of enrichment, and each node displays a GO name and P-value. The tree charts for biological process, molecular function, and cellular component changes in the hippocampus and cortex are in Figs D-I in S3 File.
Fig 4
Fig 4. Network diagrams for the cortex and hippocampus modulated by 808 nm light, according to the sorting data of –log10 (P-value).
(Left) Disease network diagram, where the ratio of the number of overlapping genes to the number of unique genes of the two is ≥ 20%, a node size indicates the total number of candidate genes belonging to a disease, and the color indicates –log10 (P-value). (Right) Network diagram of the disease and candidate genes, where a node size indicates the total number of candidate genes belonging to a disease. The high-resolution diagrams can be found in Figs N and O in S3 File.
Fig 5
Fig 5. Oxidative stress modulated by 808 nm tPBMT in mice.
Oxidative stress RNA-seq heatmaps of light-modulated genes for the cortex (A) and hippocampus (B), showing the gene expression log2 level, percentage of gene expression (%Expr), and P-value. (C) A Venn diagram showing the overlap of two genes between the cortex and hippocampus results.
Fig 6
Fig 6. Western blotting of proteins and immunohistochemical analysis of microglia phenotype for the mouse brain after 808 nm tPBMT.
(A) WB protein bands and their normalized integrated optical density for (B) the cortex and (C) hippocampus areas. The representative fluorescence microscopy images of the brain tissue (D) before and (E) after 808 nm tPBMT, stained with Arginase1 antibody (green), iNOS antibody (red), and DAPI (blue); and (F) the relative fluorescence intensities of the antibodies. The data are presented as M ± SD (N = 3), *P < 0.05, **P < 0.01 for data with a statistically significant difference.
Fig 7
Fig 7. Neuroinflammation inhibition and neurogenesis activation by 808 nm tPBMT in mice.
(A,B) Neuroinflammation and (E,F) neurotrophic factors/neurogenesis heatmaps of light-modulated genes for the cortex (A,E) and hippocampus (B,F), showing gene expression log2 level, percentage of gene expression (%Expr), and P-value. A Venn diagram showing the overlap of (C) five genes for neuroinflammation and (D) one gene for neurotrophic factors/neurogenesis between the cortex and hippocampus data.
Fig 8
Fig 8. Neuronal apoptosis suppressed by 808 nm tPBMT in mice.
Neuronal apoptosis processes heatmaps of light-modulated genes for the cortex (A) and hippocampus (B), showing gene expression log2 level, percentage of gene expression (%Expr), and P-value. (C) A Venn diagram showing the overlap of six genes between the cortex and hippocampus data.
Fig 9
Fig 9. AD risk gene expression modulated by 808 nm tPBMT in mice.
Alzheimer’s disease risk gene expression heatmaps of light-modulated genes for the cortex (A) and hippocampus (B), showing gene expression log2 level, percentage of gene expression (%Expr), and P-value. (C) A Venn diagram showing the overlap of seven genes between the cortex and hippocampus results.

Similar articles

References

    1. Rheaume YL, Manning BC, Harper DG, Volicer L. Effect of light therapy upon disturbed behaviors in Alzheimer patients. Am J Alzheimer’s Dis. 1998;13(6):291–5. doi: 10.1177/153331759801300604 - DOI
    1. Iaccarino HF, Singer AC, Martorell AJ, Rudenko A, Gao F, Gillingham TZ, et al. Gamma frequency entrainment attenuates amyloid load and modifies microglia. Nature. 2016;540(7632):230–5. doi: 10.1038/nature20587 - DOI - PMC - PubMed
    1. Ismail R, Hansen AK, Parbo P, Brændgaard H, Gottrup H, Brooks DJ, et al. The effect of 40-Hz light therapy on amyloid load in patients with prodromal and clinical Alzheimer’s disease. Int J Alzheimers Dis. 2018;2018:6852303. doi: 10.1155/2018/6852303 - DOI - PMC - PubMed
    1. Singer AC, Martorell AJ, Douglas JM, Abdurrob F, Attokaren MK, Tipton J, et al. Noninvasive 40-Hz light flicker to recruit microglia and reduce amyloid beta load. Nat Protoc. 2018;13(8):1850–68. doi: 10.1038/s41596-018-0021-x - DOI - PubMed
    1. Zhang Z, Shen Q, Wu X, Zhang D, Xing D. Activation of PKA/SIRT1 signaling pathway by photobiomodulation therapy reduces Aβ levels in Alzheimer’s disease models. Aging Cell. 2020;19(1):e13054. doi: 10.1111/acel.13054 - DOI - PMC - PubMed

MeSH terms