

AI-powered skin spectral imaging enables instant sepsis diagnosis and outcome prediction in critically ill patients
- PMID: 40680113
- PMCID: PMC12273750
- DOI: 10.1126/sciadv.adw1968
AI-powered skin spectral imaging enables instant sepsis diagnosis and outcome prediction in critically ill patients
Abstract
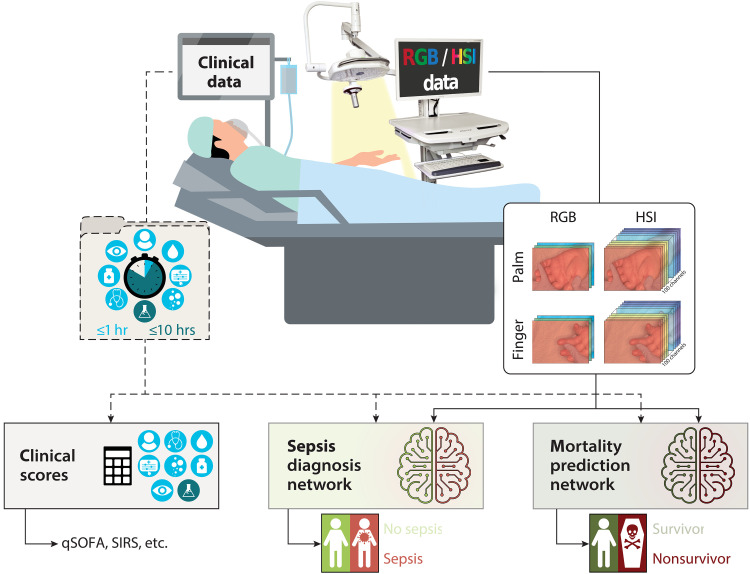
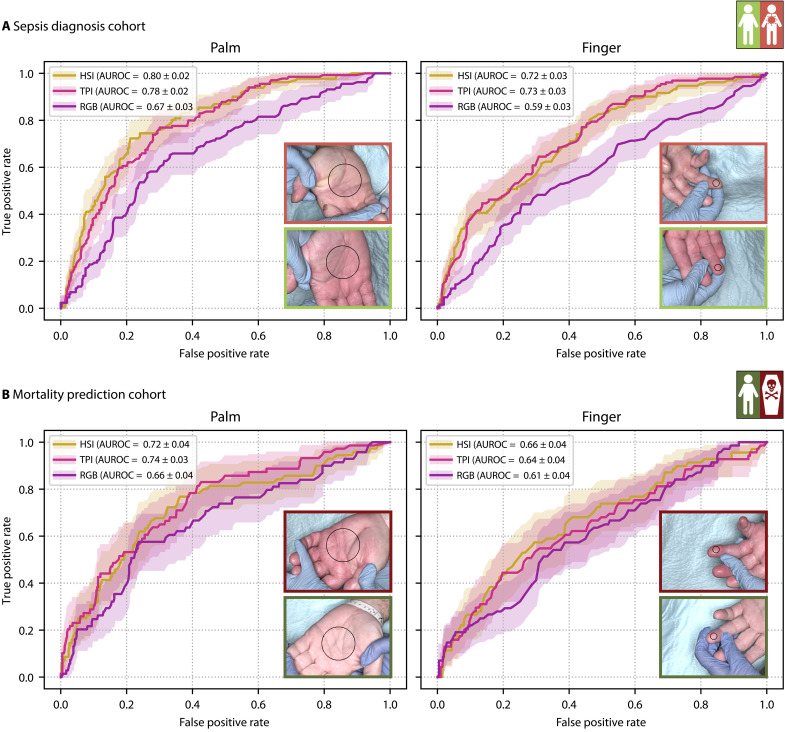
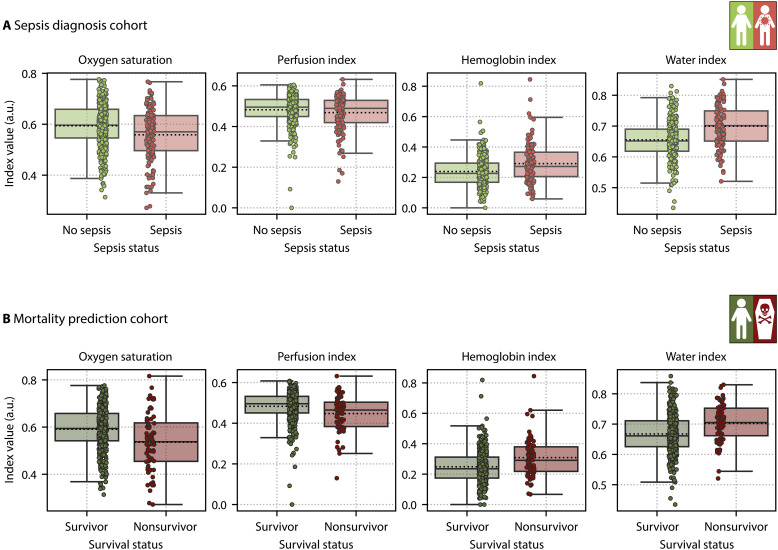
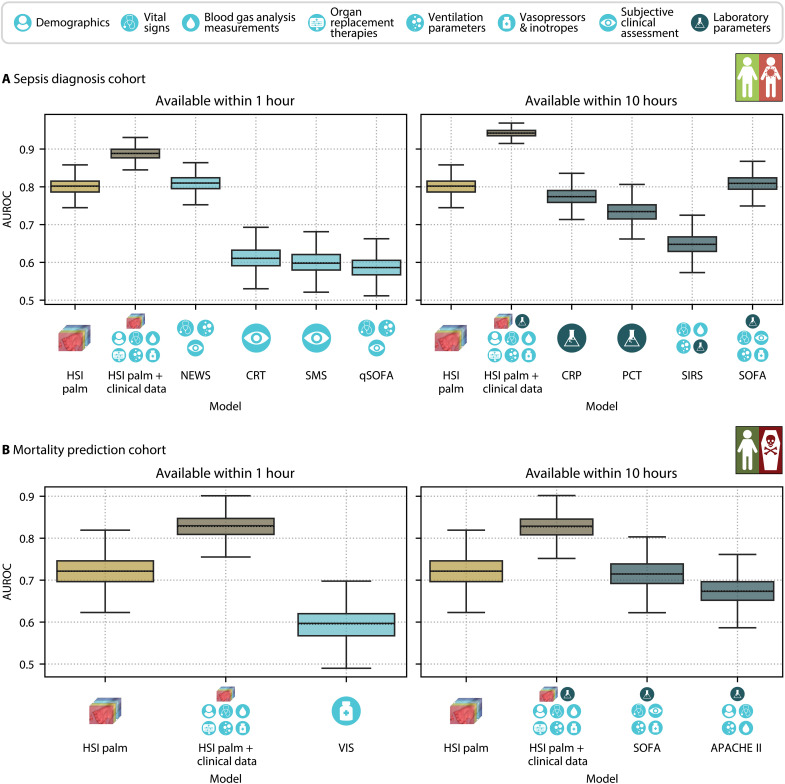
With sepsis remaining a leading cause of mortality, early identification of patients with sepsis and those at high risk of death is a challenge of high socioeconomic importance. Given the potential of hyperspectral imaging (HSI) to monitor microcirculatory alterations, we propose a deep learning approach to automated sepsis diagnosis and mortality prediction using a single HSI cube acquired within seconds. In a prospective observational study, we collected HSI data from the palms and fingers of more than 480 intensive care unit patients. Neural networks applied to HSI measurements predicted sepsis and mortality with areas under the receiver operating characteristic curve (AUROCs) of 0.80 and 0.72, respectively. Performance improved substantially with additional clinical data, reaching AUROCs of 0.94 for sepsis and 0.83 for mortality. We conclude that deep learning-based HSI analysis enables rapid and noninvasive prediction of sepsis and mortality, with a potential clinical value for enhancing diagnosis and treatment.
Figures

Similar articles
-
Assessment of S100A8/A9 and resistin as predictive biomarkers for mortality in critically ill patients with sepsis.Front Cell Infect Microbiol. 2025 Jun 3;15:1555307. doi: 10.3389/fcimb.2025.1555307. eCollection 2025. Front Cell Infect Microbiol. 2025. PMID: 40568710 Free PMC article.
-
Automated monitoring compared to standard care for the early detection of sepsis in critically ill patients.Cochrane Database Syst Rev. 2018 Jun 25;6(6):CD012404. doi: 10.1002/14651858.CD012404.pub2. Cochrane Database Syst Rev. 2018. PMID: 29938790 Free PMC article.
-
Lactate-albumin ratio improves combined predictive value of qSOFA and MEWS for 30-day mortality in ICU patients with sepsis: A retrospective cohort study.Medicine (Baltimore). 2025 Jul 4;104(27):e43097. doi: 10.1097/MD.0000000000043097. Medicine (Baltimore). 2025. PMID: 40629657 Free PMC article.
-
Development and Validation of a Convolutional Neural Network Model to Predict a Pathologic Fracture in the Proximal Femur Using Abdomen and Pelvis CT Images of Patients With Advanced Cancer.Clin Orthop Relat Res. 2023 Nov 1;481(11):2247-2256. doi: 10.1097/CORR.0000000000002771. Epub 2023 Aug 23. Clin Orthop Relat Res. 2023. PMID: 37615504 Free PMC article.
-
Enteral versus parenteral nutrition and enteral versus a combination of enteral and parenteral nutrition for adults in the intensive care unit.Cochrane Database Syst Rev. 2018 Jun 8;6(6):CD012276. doi: 10.1002/14651858.CD012276.pub2. Cochrane Database Syst Rev. 2018. PMID: 29883514 Free PMC article.
References
-
- Singer M., Deutschman C. S., Seymour C. W., Shankar-Hari M., Annane D., Bauer M., Bellomo R., Bernard G. R., Chiche J.-D., Coopersmith C. M., Hotchkiss R. S., Levy M. M., Marshall J. C., Martin G. S., Opal S. M., Rubenfeld G. D., van der Poll T., Vincent J.-L., Angus D. C., The third international consensus definitions for sepsis and septic shock (Sepsis-3). JAMA 315, 801–810 (2016). - PMC - PubMed
-
- Rudd K. E., Johnson S. C., Agesa K. M., Shackelford K. A., Tsoi D., Kievlan D. R., Colombara D. V., Ikuta K. S., Kissoon N., Finfer S., Fleischmann-Struzek C., Machado F. R., Reinhart K. K., Rowan K., Seymour C. W., Watson R. S., West T. E., Marinho F., Hay S. I., Lozano R., Lopez A. D., Angus D. C., Murray C. J. L., Naghavi M., Global, regional, and national sepsis incidence and mortality, 1990–2017: Analysis for the global burden of disease study. Lancet 395, 200–211 (2020). - PMC - PubMed
-
- Ferrer R., Martin-Loeches I., Phillips G., Osborn T. M., Townsend S., Dellinger R. P., Artigas A., Schorr C., Levy M. M., Empiric antibiotic treatment reduces mortality in severe sepsis and septic shock from the first hour: Results from a guideline-based performance improvement program. Crit. Care Med. 42, 1749–1755 (2014). - PubMed
-
- Cunha B. A., Antibiotic side effects. Med. Clin. North Am. 85, 149–185 (2001). - PubMed
-
- J.-L. Vincent, ed., Annual Update in Intensive Care and Emergency Medicine 2023 (Springer Nature Switzerland, 2023).
Publication types
MeSH terms
LinkOut - more resources
Full Text Sources
Medical
