. 2025 Jul 18;11(29):eadx8105.
doi: 10.1126/sciadv.adx8105. Epub 2025 Jul 18.

BLIMP1 negatively regulates IL-2 signaling in T cells

Affiliations

BLIMP1 negatively regulates IL-2 signaling in T cells

Suyasha Roy et al. Sci Adv. .

Abstract

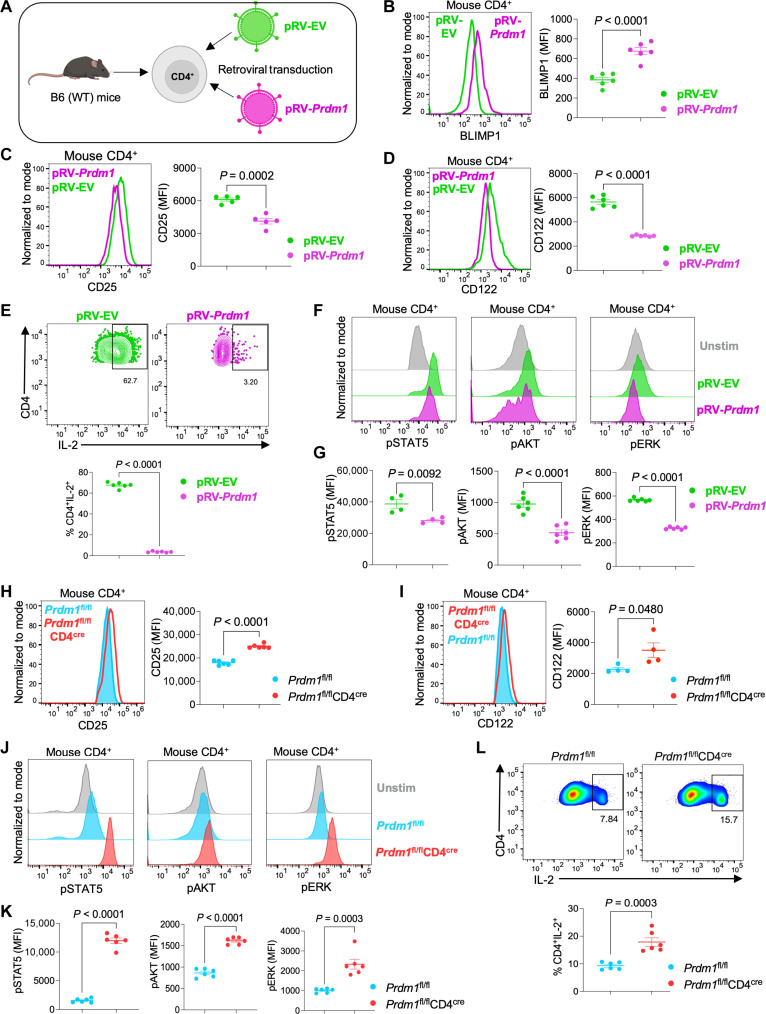
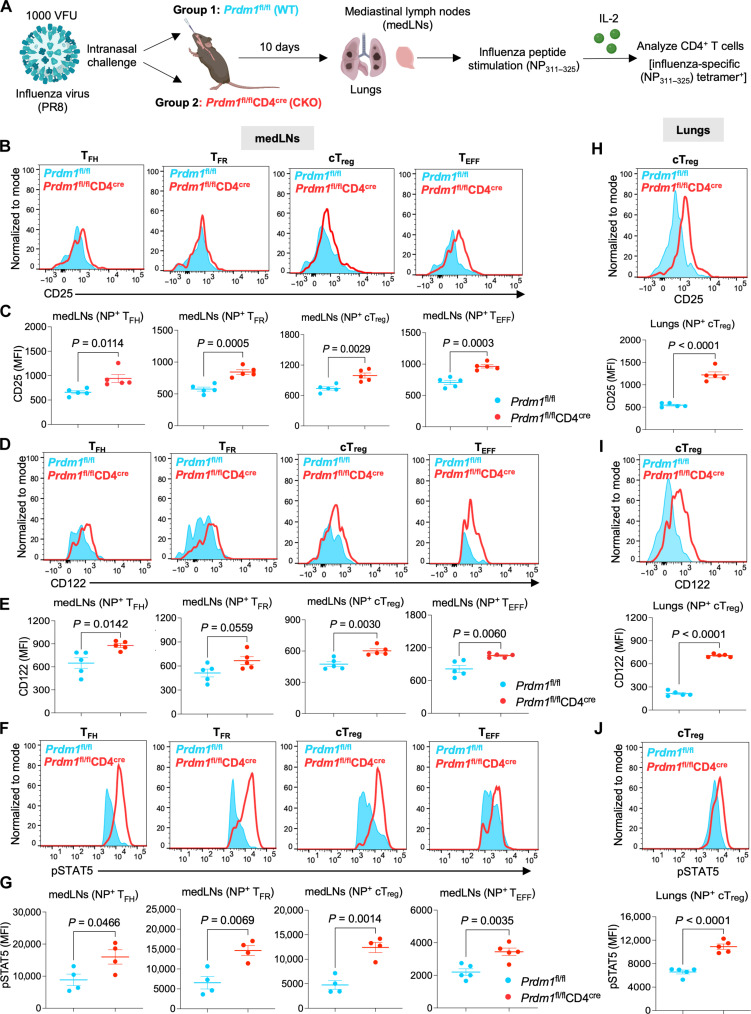
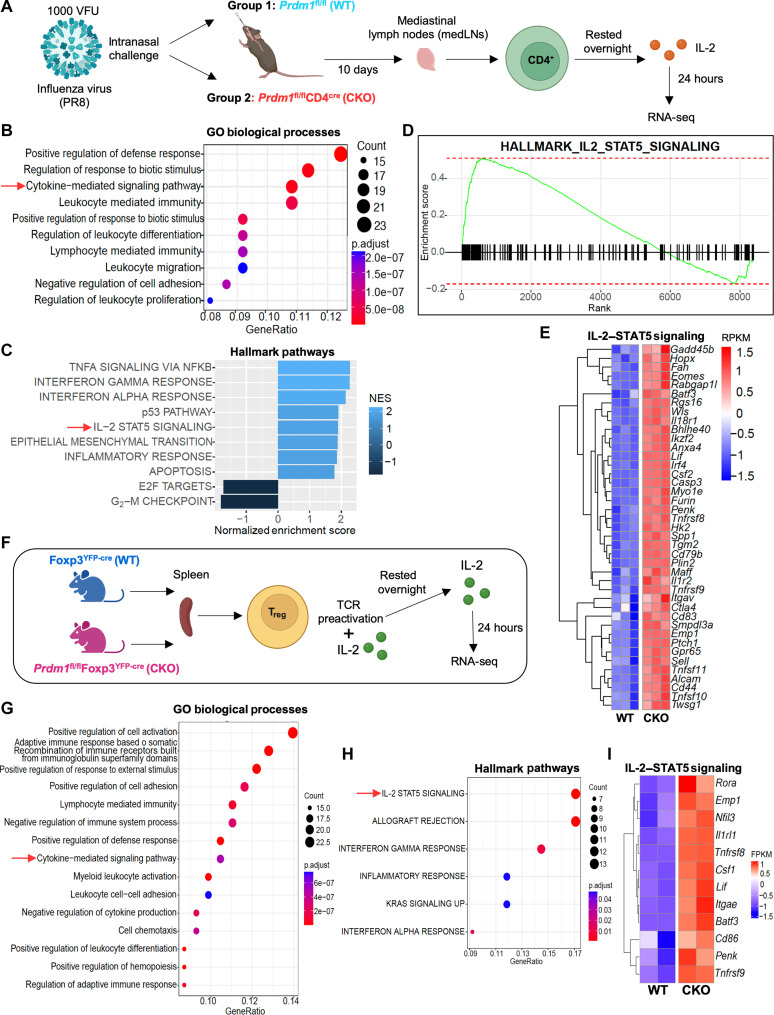
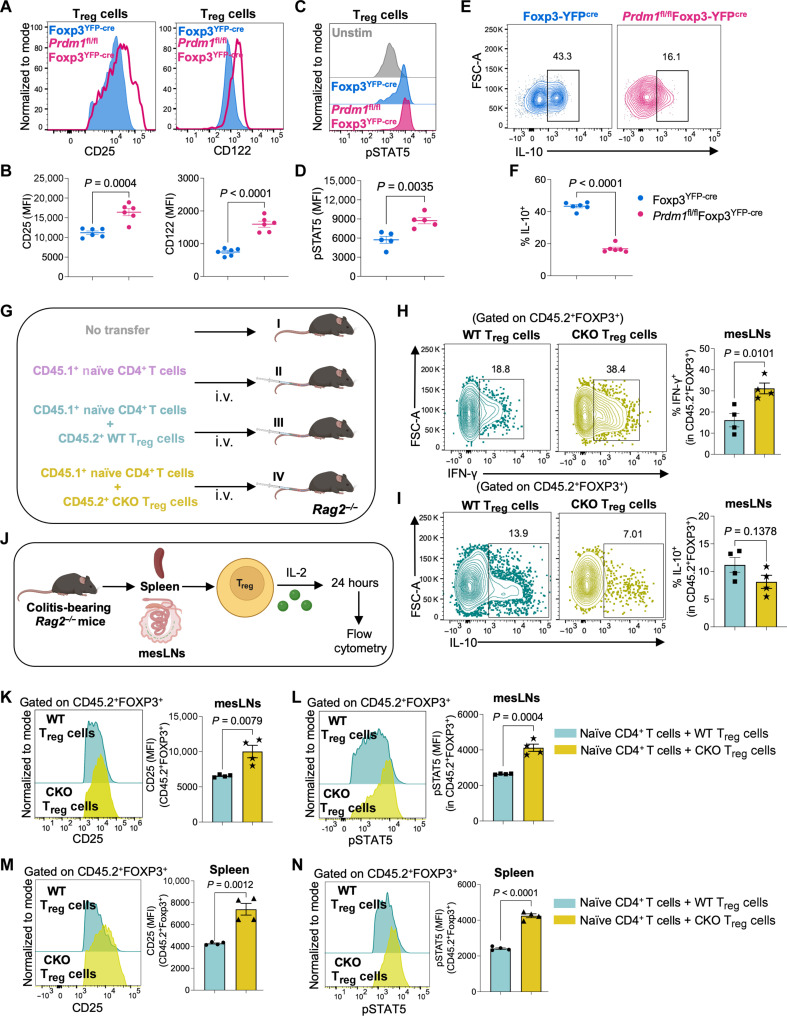
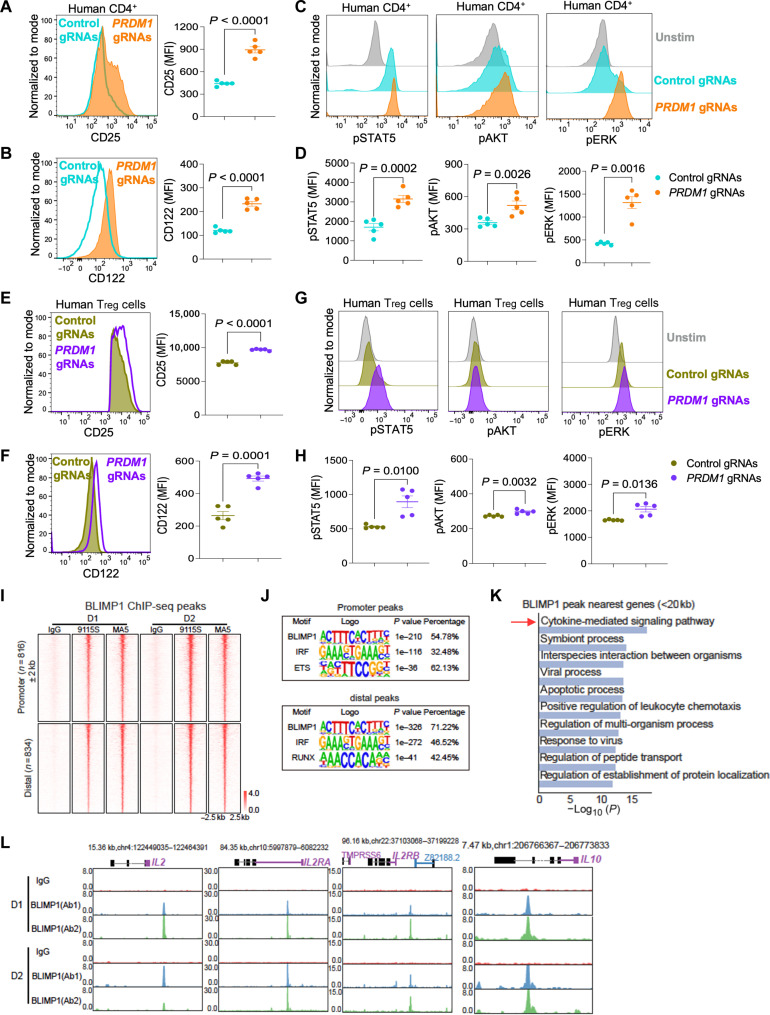
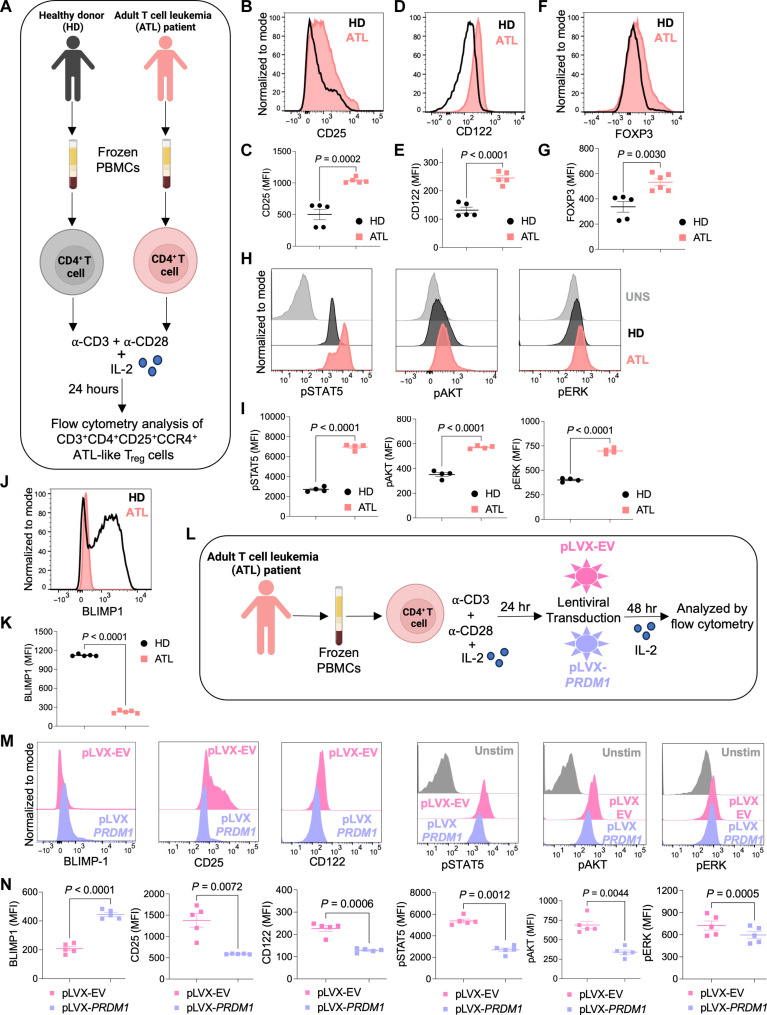
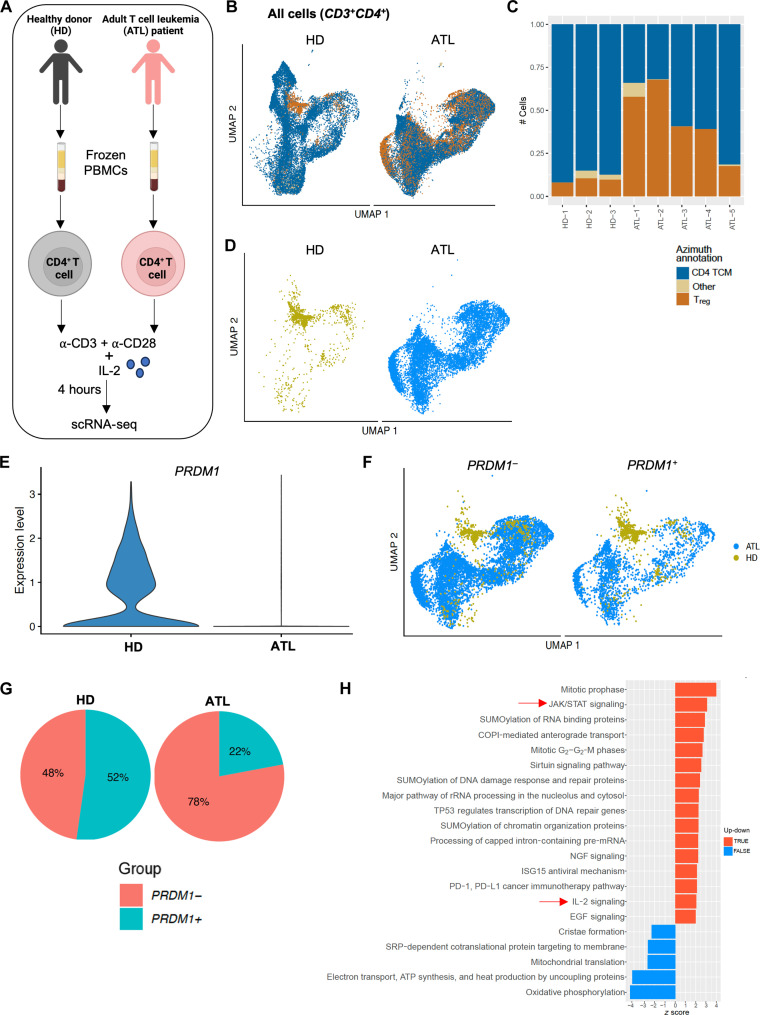
Interleukin-2 (IL-2) regulates immune homeostasis by fine-tuning the balance between effector and regulatory T (Treg) cells. To identify regulators of IL-2 signaling, we performed genome-wide CRISPR-knockout screening in IL-2-dependent cells derived from a patient with adult T cell leukemia (ATL) and found enrichment of single guide RNAs targeting PRDM1, which encodes B lymphocyte-induced maturation protein 1 (BLIMP1). BLIMP1 inhibits IL-2 production by T cells; however, its role in IL-2 signaling remains unknown. Here, we show that overexpressing Prdm1 down-regulated IL-2 signaling, whereas Prdm1-deficiency enhanced IL-2 signaling in mouse CD4+ T cells and Treg cells with augmented IL-2 signaling in T cells from influenza-infected mice and during adoptive T cell transfer-induced colitis. Deleting PRDM1 in human CD4+ T cells and Treg cells also increased IL-2 signaling. Furthermore, CD4+ T cells from patients with ATL expressed less BLIMP1 and had enhanced IL-2 signaling, whereas overexpressing PRDM1 in ATL cells suppressed IL-2 signaling. Thus, BLIMP1 inhibits IL-2 signaling during normal and pathophysiological responses, suggesting that manipulating BLIMP1 could have therapeutic potential.


Figures

Fig. 1.
Fig. 1.. BLIMP1 inhibits IL-2 signaling in mouse CD4+ T cells.
(A to G) CD4+ T cells were isolated from the spleens of WT C57BL/6 mice and TCR-stimulated for 24 hours at 37°C. Cells were retrovirally transduced with either pRV-EV or pRV-Prdm1 and cultured with IL-2 (200 IU/ml) for 72 hours at 37°C. Cells were harvested and stained for flow cytometry analysis. (A) Experimental setup for (B) to (G), n = 5 to 6 individual mice per group. Created in BioRender. Roy, S. (2025) https://BioRender.com/922i5p2. [(B) to (D)] Histograms with statistical representation for (B) BLIMP1, (C) CD25, and (D) CD122 are shown. (E) Representative flow plot and statistics showing the frequency of IL-2–producing CD4+ T cells. (F) Histograms showing pSTAT5, pAKT, and pERK staining by flow cytometry. (G) Statistical representation of flow cytometry analysis of pSTAT5, pAKT, and pERK. Representative data (means ± SEM) from three independent experiments (n = 4 to 6 individual mice per group) are shown. Two-tailed unpaired Student’s t test was used for statistical analysis. (H to L) CD4+ T cells were purified from spleens of Prdm1fl/fl and Prdm1fl/flCD4cre mice. Cells were TCR-stimulated in the presence of IL-2 (200 IU/ml) for 72 hours at 37°C, harvested, stained, and subjected to flow cytometric analysis. Shown are histograms and statistical analysis of protein expression for (H) CD25, (I) CD122, and [(J) and (K)] pSTAT5, pAKT, and pERK. (L) Representative flow plot and statistics showing the frequency of IL-2–producing CD4+ T cells. Data are representative of means ± SEM from three independent experiments (n = 4 to 6 mice per group). A two-tailed unpaired Student’s t test was used for statistical analysis.
Fig. 2.
Fig. 2.. Prdm1 knockout up-regulates IL-2 signaling in CD4+ T cells during influenza infection.
(A to J) Prdm1fl/fl (WT) and Prdm1fl/flCD4cre (Prdm1-CKO) mice were infected intranasally with 1000 viral focal units (VFU) of PR8 influenza virus. At day 10, medLNs and lungs were harvested, and single-cell suspensions were prepared. Cells were stimulated with NP311–325 peptide (1 μM) for 5 hours at 37°C, stained, and subjected to flow cytometry analysis. (A) Experimental setup for (B) to (J). Created in BioRender. S. Roy (2025) https://BioRender.com/ja4wpce. Flow cytometry plots with statistical representation showing [(B) and (C)] CD25, [(D) and (E)] CD122, and [(F) and (G)] pSTAT5 staining in NP311–325 tetramer+ influenza-specific follicular T helper cells (TFH), follicular Treg cells (TFR), conventional Treg cells (cTreg), and TEFF cells from the medLNs of WT and Prdm1-CKO mice. [(H) to (J)] Histograms with statistical representation showing (H) CD25, (I) CD122, and (J) pSTAT5 staining in NP311–325 tetramer+ influenza-specific cTreg cells from the lungs of WT and Prdm1-CKO mice by flow cytometry. Data are representative of means ± SEM from two independent experiments (n = 4 to 5 mice per group) are shown. Two-tailed unpaired Student’s t test was used for statistical analysis.
Fig. 3.
Fig. 3.. Enhanced IL-2–STAT5–dependent gene expression in BLIMP1-deficient T cells.
(A to E) Mouse CD4+ T cells were isolated from the medLNs of influenza-infected Prdm1fl/fl (WT) and Prdm1fl/flCD4cre (Prdm1-CKO) mice. Cells were stimulated ex vivo with influenza-specific peptide NP311–325 (1 μM), rested overnight, and stimulated with 200 IU of IL-2 for 24 hours. Cells were lysed, RNA was extracted, and RNA-seq was performed. (A) Schematic experimental design for (B) to (E). Created in BioRender. S. Roy (2025) https://BioRender.com/ydnx0k6. (B) GO based pathway over-enrichment analysis showing the differentially regulated pathways in influenza-infected CD4+ T cells from Prdm1-CKO mice and WT mice. (C) Preranked gene set enrichment analysis (GSEA) showing hallmark pathways that were up-regulated or down-regulated in influenza-infected CD4+ T cells from Prdm1-CKO mice relative to WT mice. (D) Hallmark enrichment score of IL-2–STAT5 signaling pathway in influenza-infected CD4+ T cells from Prdm1-CKO mice. (E) Heatmap showing top DEGs in the IL-2–STAT5 signaling pathway in influenza-infected CD4+ T cells from WT and Prdm1-CKO mice. (F to I) CD4+FOXP3+ Treg cells were sorted from Foxp3YFP-cre (WT) and Prdm1fl/flFoxp3YFP-cre (Prdm1-CKO) mice based on YFP expression. Cells were TCR-stimulated for 72 hours, rested overnight, stimulated with IL-2 (500 IU/ml) for 24 hours, and then lysed for RNA extraction followed by library preparation for RNA-Sequencing. (F) Schematic experimental design for (G) to (I). Created in BioRender. S. Roy (2025) https://BioRender.com/ydnx0k6. (G) GO-based over-enrichment analysis showing the differentially regulated pathways in Treg cells from Prdm1-CKO mice as compared to WT mice. (H) Over-enrichment analysis showing differentially regulated hallmark pathways in Treg cells from Prdm1-CKO mice relative to WT mice. (I) Heatmap showing top DEGs of the IL-2–STAT5 signaling pathway in Treg cells from WT and Prdm1-CKO mice.
Fig. 4.
Fig. 4.. Absence of BLIMP1 augments IL-2 signaling and attenuates Treg suppressive activity.
(A to F) Treg cells were purified from the spleens of Foxp3YFP-cre (WT) and Prdm1fl/flFoxp3YFP-cre (Prdm1-CKO) mice. Cells were TCR-stimulated in the presence of IL-2 (500 IU/ml) for 72 hours at 37°C, harvested, and stained for flow cytometry analysis. Live cells were gated as CD4+CD25+FOXP3+ Treg cells. Histograms and statistical analysis of protein expression for (A and B) CD25 and CD122, [(C) and (D)] pSTAT5, and [(E) and (F)] IL-10 by flow cytometry. Data are representative of means ± SEM from three independent experiments (n = 5 to 6 individual mice per group). A two-tailed unpaired Student’s t test was used for statistical analysis. (G to N) Adoptive Treg transfer from Foxp3YFP-cre (WT) or Prdm1fl/flFoxp3YFP-cre (Prdm1-CKO) mice to Rag2−/− mice with T cell transfer induced colitis. (G) Schematic representation for group I, Rag2−/− mice with no T cell transfer; group II, Rag2−/− mice with intravenous (i.v.) transfer of CD45.1+ naïve CD4+ T cells; group III, Rag2−/− mice with intravenous transfer of CD45.1+ naïve CD4+ T cells and CD45.2+ WT Treg cells from WT mice; and group IV, Rag2−/− mice with intravenous transfer of CD45.1+ naïve CD4+ T cells and CD45.2+ CKO Treg cells from Prdm1-CKO mice. Created in BioRender. S. Roy (2025) https://BioRender.com/debaxae. [(H) and (I)] Flow cytometry analysis for (H) IFN-γ and (I) IL-10 production by CD45.2+FOXP3+ Treg cells in the mesLNs. (J) Schematic representation for ex vivo IL-2 stimulation of Treg cells purified from spleen and mesLNs of Rag2−/− mice after colitis induction. Created in BioRender. S. Roy (2025) https://BioRender.com/debaxae. [(K) and (L)] Flow cytometry analysis of protein expression for (K) CD25 and (L) pSTAT5 in CD45.2+FOXP3+ Treg cells from the mesLNs. [(M) and (N)] Flow cytometry analysis of protein expression for (M) CD25 and (N) pSTAT5 in CD45.2+FOXP3+ Treg cells from the spleen. Two-tailed unpaired Student’s t test was used for statistical analysis. Data are representative of mean ± SEM from two independent experiments (n = 4 independent mice per group).
Fig. 5.
Fig. 5.. BLIMP1 restrains IL-2 signaling in human CD4+ T cells and natural Treg cells.
(A to D) Preactivated human CD4+ T cells were electroporated with control gRNAs or PRDM1 gRNAs annealed with Cas9 as RNP complex, cultured with IL-2 (200 IU/ml) for 72 hours, and stained for flow cytometry. Histograms with statistical representation showing (A) CD25 and (B) CD122 protein levels by flow cytometry. (C) Histograms representing pSTAT5, pAKT, and pERK, staining by flow cytometry. (D) Statistical representation of flow cytometry analysis of pSTAT5, pAKT, and pERK. Data are representative of means ± SEM from three independent experiments (n = 5 individuals). Two-tailed paired Student’s t test was used for statistical analysis. (E to H) Preactivated human natural Treg cells were electroporated with control gRNAs or PRDM1 gRNAs annealed with Cas9 as RNP complex, cultured with IL-2 (500 IU/ml) for 72 hours, and stained for flow cytometry. Histograms with statistical representation showing (E) CD25 and (F) CD122 protein levels by flow cytometry. (G) Histograms representing pSTAT5, pAKT, and pERK staining by flow cytometry. (H) Statistical representation of flow cytometry analysis of pSTAT5, pAKT, and pERK. Data are representative of means ± SEM from three independent experiments (n = 5 individuals). Two-tailed paired Student’s t test was used for statistical analysis. (I to L) Natural Treg cells from HDs (D1 and D2) were in vitro expanded in the presence of IL-2 followed by ChIP-seq analysis of BLIMP1 binding using antibodies BLIMP1 Ab1 (clone #9115S) and BLIMP1 Ab2 (clone #MA5-14879) as compared to the rabbit IgG control. (I) BLIMP1 ChIP-seq heatmaps (promoter versus distal regions). (J) Motif analysis for BLIMP1 peaks in the promoter and distal regions. (K) GO term enrichment for BLIMP1 peaks near TSS target genes. (L) Genome browser tracks showing BLIMP1-binding profiles at the indicated genes.
Fig. 6.
Fig. 6.. Patients with acute ATL showed augmented IL-2 signaling as compared to HDs.
Purified CD4+ T cells from frozen PBMCs of HDs and patients with acute ATL were ex vivo stimulated with anti-CD3 and anti-CD28 and IL-2 for 24 hours at 37°C and stained for flow cytometry. Cells were gated as CD3+ CD4+ CD25+ CCR4+ T cells (ATL-like Treg cells). (A) Schematic representation of the experiment (B to K). Created in BioRender. S. Roy (2025) https://BioRender.com/ae8e1h0. Representative histograms with cumulative statistics for flow cytometry analysis of [(B) and (C)] CD25 and [(D) and (E)] CD122 expression. [(F) and (G)] Representative histograms and cumulative statistics for FOXP3 expression by flow cytometry. [(H) and (I)] Flow cytometric analysis of pSTAT5, pAKT, and pERK showing representative histograms and cumulative statistics. [(J) and (K)] Representative histograms and statistics for BLIMP1 expression by flow cytometry. Data are representative of means ± SEM from three independent experiments (n = 4 to 5 individuals). Two-tailed unpaired Student’s t test was used for statistical analysis. (L) Schematic representation of PRDM1 overexpression in ATL cells. Created in BioRender. S. Roy (2025) https://BioRender.com/ae8e1h0. (M) Histograms showing protein expression for BLIMP1, CD25, CD122, pSTAT5, pAKT, and pERK in ATL cells transduced with pLVX-EV (empty vector control) or pLVX-PRDM1 (vector expressing PRDM1). (N) Statistical analysis showing mean fluorescent intensity (MFI) for BLIMP1, CD25, CD122, pSTAT5, pAKT, and pERK, protein levels in ATL cells transduced with pLVX-EV (empty vector control) or pLVX-PRDM1 (vector expressing PRDM1). Data are representative of means ± SEM from two independent experiments (n = 5 individuals). Two-tailed paired Student’s t test was used for statistical analysis.
Fig. 7.
Fig. 7.. PRDM1 expression inversely correlates with activated IL-2 signaling in patients with acute ATL.
Purified CD4+ T cells from HDs (n = 3) and patients with acute ATL (n = 5) were stimulated with anti-CD3 and anti-CD28 in presence of IL-2 for 4 hours at 37°C. The cells were harvested and subjected to scRNA-seq. (A) Schematic representation of the experimental setup for (B to H). Created in BioRender. S. Roy (2025) https://BioRender.com/9zdi679. (B) Uniform Manifold Approximation and Projection (UMAP) plot showing all cells split by HD cells (left) and ATL cells (right). (C) Bar plot showing proportion of the cells in each cluster annotated by Azimuth for each HD and ATL sample. (D) UMAP plot showing distribution of Treg cells split by HD cells (left) and ATL cells (right). (E) Violin plot showing PRDM1 expression in Treg cells in HDs and patients with ATL. (F) UMAP plot showing distribution of PRDM1 versus PRDM1+ Treg populations in HDs and patients with ATL. (G) Pie chart showing percentage of cells in HDs and patients with ATL that express any amount of PRDM1. (H) Bar plot showing top pathways (by z score) from Qiagen IPA using differentially expressed genes derived from PRDM1 versus PRDM1+ populations within Treg cells cluster in patients with ATL.

Similar articles

References

    1. Morgan D. A., Ruscetti F. W., Gallo R., Selective in vitro growth of T lymphocytes from normal human bone marrows. Science 193, 1007–1008 (1976). - PubMed
    1. Kim H. P., Imbert J., Leonard W. J., Both integrated and differential regulation of components of the IL-2/IL-2 receptor system. Cytokine Growth Factor Rev. 17, 349–366 (2006). - PubMed
    1. Liao W., Lin J. X., Leonard W. J., Interleukin-2 at the crossroads of effector responses, tolerance, and immunotherapy. Immunity 38, 13–25 (2013). - PMC - PubMed
    1. Ross S. H., Cantrell D. A., Signaling and function of interleukin-2 in T lymphocytes. Annu. Rev. Immunol. 36, 411–433 (2018). - PMC - PubMed
    1. Taniguchi T., Matsui H., Fujita T., Takaoka C., Kashima N., Yoshimoto R., Hamuro J., Structure and expression of a cloned cDNA for human interleukin-2. Nature 302, 305–310 (1983). - PubMed

MeSH terms

Substances