. 2025 Jul 18;11(29):eadv9466.
doi: 10.1126/sciadv.adv9466. Epub 2025 Jul 18.

Image-based inference of tumor cell trajectories enables large-scale cancer progression analysis

Affiliations

Image-based inference of tumor cell trajectories enables large-scale cancer progression analysis

Yang Liu et al. Sci Adv. .

Abstract

Current approaches to estimating cell trajectories, tumor progression dynamics, and cell population diversity of tumor microenvironment often depend on single-cell RNA sequencing, which is costly and resource intensive. To address this limitation, we developed an artificial intelligence (AI) model that leverages cell morphology features and histological spatial organization to classify tumor cell differentiation status, infer cell dynamic trajectories, and quantify tumor progression from hematoxylin and eosin (H&E)-stained whole-slide images. In three independent lung adenocarcinoma cohorts, our AI-based model accurately predicted cell differential status and provided quantifiable measures of tumor progression that were prognostic of patient survival. Spatial transcriptomic integrative analyses revealed cell components and gene signatures enriched in different cell differentiation statuses. Bulk transcriptomic analyses revealed that fast-progressing tumors exhibit up-regulated cell cycle pathways, while slow-progressing tumors retain characteristics of normal lung epithelium. This cost-effective method enables large-scale analysis of tumor progression dynamics using routinely collected pathology slides and provides insights into intratumor heterogeneity.


Figures

Fig. 1.
Fig. 1.. Overview of tumor cell dynamic framework.
Fig. 2.
Fig. 2.. Illustration of using pathology image deep learning model to predict cell differential status.
(A) Flowchart of predicting cell differential status from digital pathology images. Image patches extracted from annotated ROIs of H&E images are used to train a deep learning model for predicting cell differential status. (B) Detailed network structure of the proposed deep learning model. Image patches of size 224 × 224 serve as the inputs of our fine-tuned model. The model is built on a pretrained Phikon model followed by a feed-forward layer with 128 nodes and a layer of 5 nodes representing the five classes. A softmax function is applied to compute the probabilities across the five classes, determining the predicted class. (C) Summary of the number of training and testing ROIs (left) and patches (right) used in the model. (D) Confusion matrix of the patch-level performance using the independent testing patches of low (G1), intermediate (G2), and high (G3 and G4) grades and other pathological conditions. (E) AUROC of slide-level performance of the NLST dataset. (F) Confusion matrix of the slide-level prediction performance of the NLST dataset.
Fig. 3.
Fig. 3.. Cell differential status and pseudotime on whole-slide H&E images.
(A) Flowchart of cell differential status prediction and pseudotime inference at the WSI level. To predict WSI-level cell differential, the trained deep learning model scans each image patch extracted across the tissue region. At the same time, patch features used for prediction are extracted for the downstream pseudotime analysis. Patches were clustered by the Leiden algorithm using the extracted features, and pseudo time was estimated according to the Leiden clusters using the diffusion pseudotime algorithm, more details in Materials and Methods. UMAP, uniform manifold approximation and projection. (B) Results of G1 tumor (top) and G4 tumor (bottom). Both G1 and G4 identified the tumor ROI region, and the pseudotime results of G4 identified the necrosis region.
Fig. 4.
Fig. 4.. Tumor progression fitness model on WSI images and survival analysis.
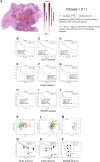
(A) Illustration of tumor progression quantification integrating spatial organization on WSI; more details in Materials and Methods. (B to J) Results of Kaplan-Meier log-rank test and univariate Cox-PH regression analysis of NLST, SPORE, and LUAD datasets. Patients were stratified into slow (blue) and fast (orange) groups. HR, hazard ratio; CI, confidence interval. (K to M) Correlation plot between the tumor progression speed and Shannon index of three datasets. Patients were stratified into slow (blue), “moderate” (green), and fast (orange) groups by the median value of both speed and Shannon index. (N to P) Results of Kaplan-Meier curve of three-group patient stratification on three datasets. ns, not significant.
Fig. 5.
Fig. 5.. Transcriptomic analysis of the patient stratification based on the tumor progression quantification.
(A) GSEA analysis results of the REACTOME pathway database using genes ranked by the correlation between gene expression and Shannon index from the LUAD dataset. NES, normalized enrichment score. (B) Normalized gene expression profile of genes enriched in the AT2 cell gene signatures between the slow progression and fast progression patients of the LUAD dataset. The AT2 gene signatures are acquired from the MSigDB. (C) Wilcox rank sum test results of AT2 scores between the slow and fast groups. (D) Spearman correlation of AT2 score and Shannon index. R2, coefficient of determination. (E) Genes negatively correlated with Shannon diversity index were significantly enriched in the AT2 cell type signatures.
Fig. 6.
Fig. 6.. Integrative analysis with spatial transcriptomic data of ADC.
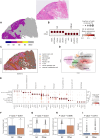
(A) Results of the cell differentiation status prediction from the trained model. (B) Highly variable genes differentiate between the predicted G1 and the other normal region. (C) Cell type annotation of the Xenium 5K ADC dataset. (D) UMAP of the identified cell clusters. (E) Highly variable genes in each annotated cell cluster. (F to I) Comparison of cell components from image patches predicted as G2 tumor or other normal regions.

References

    1. Siegel R. L., Giaquinto A. N., Jemal A., Cancer statistics, 2024. CA Cancer J. Clin. 74, 12–49 (2024). - PubMed
    1. Dagogo-Jack I., Shaw A. T., Tumour heterogeneity and resistance to cancer therapies. Nat. Rev. Clin. Oncol. 15, 81–94 (2018). - PubMed
    1. Meacham C. E., Morrison S. J., Tumour heterogeneity and cancer cell plasticity. Nature 501, 328–337 (2013). - PMC - PubMed
    1. Trapnell C., Defining cell types and states with single-cell genomics. Genome Res. 25, 1491–1498 (2015). - PMC - PubMed
    1. Saelens W., Cannoodt R., Todorov H., Saeys Y., A comparison of single-cell trajectory inference methods. Nat. Biotechnol. 37, 547–554 (2019). - PubMed