. 2025 Jul 18;11(29):eadu6354.
doi: 10.1126/sciadv.adu6354. Epub 2025 Jul 18.

Endogenous retrovirus-like proteins recruit UBQLN2 to stress granules and shape their functional biology

Affiliations

Endogenous retrovirus-like proteins recruit UBQLN2 to stress granules and shape their functional biology

Harihar M Mohan et al. Sci Adv. .

Abstract

The human genome is replete with sequences derived from foreign elements including endogenous retrovirus-like proteins of unknown function. Here, we show that UBQLN2, a ubiquitin-proteasome shuttle factor implicated in neurodegenerative diseases, is regulated by the linked actions of two retrovirus-like proteins, retrotransposon gag-like 8 (RTL8) and paternally expressed gene 10 (PEG10). RTL8 confers on UBQLN2 the ability to complex with and regulate PEG10. PEG10, a core component of stress granules, drives the recruitment of UBQLN2 to stress granules under various stress conditions but can only do so when RTL8 is present. Changes in UBQLN2, RTL8, or PEG10 levels further remodel the kinetics of stress granule disassembly and translation recovery. PEG10 also alters overall stress granule composition by incorporating select extracellular vesicle proteins. Within stress granules, PEG10 forms virus-like particles, underscoring the structural heterogeneity of this class of biomolecular condensates. Together, these results reveal an unexpected link between pathways of cellular proteostasis and endogenous retrovirus-like proteins.


Figures

Fig. 1.
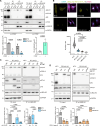
Fig. 1.. PEG10 gag-pol is regulated by the collective actions of UBQLN2 and RTL8.
(A) Schematic depicting functional relationships between UBQLN2, RTL8, and PEG10. Both UBQLN2 and PEG10 interact with RTL8, forming a hypothetical trimolecular complex (I) that may affect UBQLN2-dependent proteasomal degradation of PEG10 (II) and SG localization of both proteins (III). (B) Volcano plot of proteins significantly decreased (blue) or increased (red) in RTL8 KO HEK293 cells compared to control cells (combination of HEK293 WT and NTC guide RNA–treated cells). n = 3 biological replicates from one WT, two NTC, and two RTL8 KO clonal lines. Cutoff was set at P < 0.05 and an absolute fold change of 2. Also, see table S1. (C) Phylogenetic tree of human RTL proteins, with branch lengths proportional to evolutionary distances. Colored ovals highlight RTL proteins studied here. (D) Domain organization of PEG10, RTL8, and LDOC1 showing shared retrovirus-like features. PEG10 gag-pol is generated by ribosomal frameshifting at the frameshift site. (E) Immunoblot of lysates from WT, NTC, and RTL8 KO HEK293 cells. Relative PEG10 gag-pol levels, normalized to levels in WT cells, are shown below. Also, see fig. S1 (A to D). (F) Immunoblot of lysates from various human cell lines treated with siRNA against RTL8 or UBQLN2 or control (Ctrl) siRNA. Relative PEG10 gag-pol levels, normalized to levels in control siRNA-treated cells, are shown below. Also, see fig. S1 (E to G). (G) Immunoblot of lysates from NTC or RTL8 KO HeLa cells expressing HA-tagged RTL8C, HA-RTL8C ΔN, Myc-tagged LDOC1, FLAG-tagged UBQLN2, or empty vector (Vec). Relative PEG10 gag-pol levels, normalized to levels in RTL8 KO cells transfected with an empty vector, are shown below. Also, see figs. S1H and S2. In [(E) to (G)], data represent the means ± SD (n = 3), analyzed with one-way analysis of variance (ANOVA) with Tukey’s multiple comparison test. GAPDH, loading control. Third-party graphical elements in (A) are incorporated from Bioicons under a CC-0 license.
Fig. 2.
Fig. 2.. PEG10-UBQLN2 interactions require the N terminus of RTL8.
(A) Lysates from NTC or RTL8 KO HEK293 cells were immunoprecipitated with control or α-UBQLN2 antibody in the absence or presence of the cross-linker DTBP. The amount of PEG10 or RTL8 coimmunoprecipitated, relative to immunoprecipitated UBQLN2 and normalized to NTC HEK293 without DTBP addition, is shown below. (B) PLA assessing interaction between endogenous UBQLN2 and PEG10 in the indicated HeLa cell lines. Nuclei and cell membranes are labeled with DAPI and WGA, respectively. Quantification of PLA foci/cell is shown below. The number of individual cells quantified per line from two independent replicates is indicated. Scale bars, 10 μm. Lysates from (C) NTC or RTL8 KO HeLa cells expressing full-length (FL) HA-RTL8C, HA-RTL8C ΔN, or empty vector or (D) NTC or PEG10 KO HeLa cells expressing FL V5-PEG10 gag-pol, V5-PEG10 gag-pol ΔPPR, or empty vector were immunoprecipitated with α-UBQLN2 Ig. The amount of coimmunoprecipitated PEG10 or RTL8, relative to immunoprecipitated UBQLN2 and normalized to NTC HeLa, is shown below. Also, see fig. S3. In [(A) to (D)], data were analyzed using one-way ANOVA with Tukey’s multiple comparison test. In [(A), (C), and (D)], data represent the means ± SD (n = 3). GAPDH, loading control.
Fig. 3.
Fig. 3.. PEG10-UBQLN2 interactions are preserved in SGs.
(A) Schematic depicting possible SG localization of the UBQLN2-RTL8-PEG10 complex given the known SG localization of UBQLN2 and PEG10. (B) PLA assessing the interaction between endogenous UBQLN2 and PEG10 in HeLa cells induced to form SGs by sodium arsenite or heat shock. Nuclei and cell membranes are labeled with DAPI and WGA, respectively, and arrowheads in insets mark SGs stained with G3BP1. Quantification of PLA foci per square micrometers within SGs and in the whole cell is shown below. The number of individual cells quantified per condition from two independent replicates is indicated. One-way ANOVA with Tukey’s multiple comparison test was performed. Scale bars, 10 μm and 5 μm for insets. (C) B-isox–mediated precipitation of RNA granule proteins from three human cell lines. WCL, whole-cell lysate before B-isox addition; S, supernatant; P, pellet. G3BP1 and TIAR are positive controls, and GAPDH is a negative control. Ponceau S was used to normalize loading. (D) Three-color dSTORM of HeLa cells treated with sodium arsenite. Numbers identify the zoomed regions shown below. Arrowheads mark regions of overlap between PEG10 and G3BP1. The Jaccard index between G3BP1 clusters and UBQLN2 or PEG10 is shown at the top right. Dotted lines connect data points from an individual cell. An unpaired t test was performed. n = 15 cells across three independent replicates. Scale bars, 10 μm and 0.5 μm for zoomed regions.
Fig. 4.
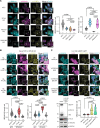
Fig. 4.. PEG10 gag-pol recruits UBQLN2 to SGs in an RTL8-dependent manner.
(A) After treatment with sodium arsenite, the indicated HeLa cell lines were immunostained for endogenous UBQLN2, PEG10, and the SG marker G3BP1. Arrowheads in insets mark SGs. UBQLN2 or PEG10 intensity within SGs was quantified and is shown to the right. Also, see figs. S4 and S5A. (B) NTC and RTL8 KO HeLa cells expressing HA-RTL8C, HA-RTL8C ΔN, or control protein (HA-mFAP10) treated with sodium arsenite. UBQLN2 intensity within SGs is shown at the bottom left. The Mander’s overlap coefficient (MOC) between HA and G3BP1 is shown at the bottom right. Also, see fig. S5B. (C) U-2 OS G3BP1-GFP cells expressing V5-PEG10 gag, gag-pol, gag-pol ΔPPR, or control protein (V5-Nanoluciferase) treated with sodium arsenite. The immunoblot of lysates from HeLa and U-2 OS G3BP1-GFP cells is shown at the bottom left. UBQLN2 intensity within SGs is shown at the bottom right. Also, see fig. S5C. In all panels, nuclei are labeled with DAPI. Scale bars, 10 μm and 5 μm for insets. In [(B) and (C)], filled arrowheads in insets indicate SGs with UBQLN2, and unfilled arrows indicate SG without UBQLN2. In all panels, one-way ANOVA with Tukey’s multiple comparison test was performed. The number of individual cells quantified per line/plasmid from three independent replicates is indicated.
Fig. 5.
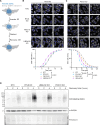
Fig. 5.. Depletion of PEG10, RTL8, or UBQLN2 alters SG dynamics.
(A) Schematic of live-cell imaging experiments in HeLa cell lines expressing endogenous G3BP1-mScarlet-I. Nuclei are labeled with Hoechst 33342. Live-cell imaging showing time points during arsenite stress (B) and recovery after washout (C). Shown below are SG counts per cell over time. Data represent the means ± SEM. SGs per cell are normalized to the maximum number of SGs observed under each condition, fitted to a nonlinear regression model, and analyzed with one-way ANOVA with Tukey’s multiple comparison test. n = 24 fields across three independent replicates. Scale bar, 10 μm. Also, see fig. S6 and movies S1 and S2. (D) Immunoblot of lysates from the indicated HeLa cell lines undergoing recovery following arsenite stress. Nascent polypeptide synthesis was monitored by AHA incorporation (detected through alkyne-biotin click chemistry), which was added to cells at the start of the recovery phase. GAPDH and Ponceau S, loading controls. n = 3 biological replicates. Third party graphical elements in (A) are from DBCLS under a CC BY 4.0 Unported license.
Fig. 6.
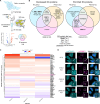
Fig. 6.. PEG10 shuttles select EV proteins to SGs.
(A) Schematic of SG pulldown experiments from HeLa cell lines. Also, see fig. S7A. (B) Venn diagrams showing significantly decreased or enriched SG proteins in the indicated HeLa cell lines compared to NTC cells. SG protein tiers are annotated on the basis of the RNA granule database. Also, see fig. S7B and table S2. (C) Heatmap of known PEG10 interactors detected in SG IP/MS experiments. Bolded proteins are also SG proteins. Colors correspond to fold enrichment in the respective KO line versus NTC. The black box identifies TCAF1 and ATXN10, and the pink box identifies TSG101, an EV marker. Also, see fig. S7 (C and D). (D) After treatment with sodium arsenite, the indicated cell lines were stained for endogenous ATXN10 and G3BP1. Nuclei are labeled with DAPI, and arrowheads in insets mark SGs. Scale bars, 10 μm and 5 μm for insets. Also, see fig. S7E. Third party graphical elements in (A) are from Servier under a CC BY 3.0 Unported license.
Fig. 7.
Fig. 7.. PEG10-derived VLPs are present within SGs.
(A) Schematic of the cryo-CLEM workflow for imaging PEG10 gag-pol-Dendra2–labeled VLPs in cells (i.e., in situ) or isolated from cell culture media (VLP suspension). (B) Representative MIP of vitrified VLPs from PEG10 KO HeLa cells transfected with PEG10 gag-pol-Dendra2 overlaid on the reflection channel image. The inset depicts a low-magnification TEM image targeting the Dendra2 fluorescence signal. Scale bars, 20 μm and 0.5 μm for overlay and inset images, respectively. Also, see figs. S8 (A to C) and S9. (C) Slice through a tomogram of the region highlighted in (B) showing two representative PEG10 gag-pol-Dendra2 VLPs. Scale bar, 50 nm. (D) Representative overlay of MIP of cryo-confocal Z-stack with the image from the reflection channel (gray) of arsenite-treated vitrified PEG10 KO HeLa cells expressing endogenous G3BP1-mScarlet-I, transfected with PEG10 gag-pol-Dendra2. Fiducial fluorospheres (blue) were added for correlation. Scale bar, 20 μm. Also, see fig. S8D. (E) Cryo-FIB view postmilling with transformed cryo-confocal MIP matching the 15° milling angle. Scale bar, 10 μm. (F) Overlay of the medium magnification montage from cryo-TEM (6500×) of a lamella with cryo-confocal MIP. The solid black rectangle indicates where the tilt series was subsequently acquired. Scale bar, 2 μm. (G) A slice through the tomogram of the region highlighted in (F) was collected at 42,000×, revealing well-preserved cellular interiors. Four (1 to 4) PEG10 gag-pol-Dendra2 VLPs in the field of view are highlighted in white dashed rectangles with enlarged views highlighting the variability in structure and morphology, such as additional protein coat (orange arrowheads, rectangle 3). Scale bar, 200 nm. Also, see fig. S8E. (H) Segmentation of the tomogram volume shown in (G). SGs (pink), PEG10 gag-pol-Dendra2 VLP (red), ribosomes (blue), intermediate filaments (yellow), and microtubules (green) are highlighted. Also, see movie S3. Third party graphical elements in (A) are from Bioicons, Servier, and DBCLS under a CC-0 license, a CC BY 3.0 Unported license, and a CC BY 4.0 Unported license, respectively.

Update of

References

    1. Bannert N., Kurth R., Retroelements and the human genome: New perspectives on an old relation. Proc. Natl. Acad. Sci. U.S.A. 101, 14572–14579 (2004). - PMC - PubMed
    1. Henriques W. S., Young J. M., Nemudryi A., Nemudraia A., Wiedenheft B., Malik H. S., The diverse evolutionary histories of domesticated metaviral capsid genes in mammals. Mol. Biol. Evol. 41, msae154 (2024). - PMC - PubMed
    1. Ashley J., Cordy B., Lucia D., Fradkin L. G., Budnik V., Thomson T., Retrovirus-like Gag Protein Arc1 binds RNA and traffics across synaptic boutons. Cell 172, 262–274.e11 (2018). - PMC - PubMed
    1. Pastuzyn E. D., Day C. E., Kearns R. B., Kyrke-Smith M., Taibi A. V., McCormick J., Yoder N., Belnap D. M., Erlendsson S., Morado D. R., Briggs J. A. G., Feschotte C., Shepherd J. D., The neuronal gene Arc encodes a repurposed retrotransposon Gag protein that mediates intercellular RNA transfer. Cell 173, 275 (2018). - PMC - PubMed
    1. Pang S. W., Lahiri C., Poh C. L., Tan K. O., PNMA family: Protein interaction network and cell signalling pathways implicated in cancer and apoptosis. Cell. Signal. 45, 54–62 (2018). - PubMed

MeSH terms

Substances

LinkOut - more resources