. 2025 Jul 18;11(29):eadu0955.
doi: 10.1126/sciadv.adu0955. Epub 2025 Jul 18.

Nicotinamide boosts oocyte quantity and quality by promoting N4-acetylation modification in lupus mice

Affiliations

Nicotinamide boosts oocyte quantity and quality by promoting N4-acetylation modification in lupus mice

Yun Xie et al. Sci Adv. .

Abstract

Patients with systemic lupus erythematosus (SLE) often have decreased fertility. Gene translation is crucial to oocyte meiosis and development. However, it remains unclear how SLE affects this process. Here, we used single-cell transcriptome and translatome sequencing to uncover a notable disruption in protein translation in oocytes from SLE mice, associated with the N4-acetylcytidine (ac4C) modification. Inhibition of ac4C levels in vitro substantially reduced oocyte translation efficiency. Notably, through trace-cell ac4C-RNA immunoprecipitation (acRIP) sequencing, we mapped the ac4C landscape in SLE mouse oocytes and found that deficient ac4C modification substantially impaired the translation of Zygote arrest 1. Furthermore, we demonstrated that nicotinamide treatment notably and safely improved the quantity and quality of oocytes in SLE mice by enhancing ac4C modification levels. Our findings highlight the essential role of N- acetyltransferase 10 (NAT10)-mediated ac4C modification in abnormal oocyte development in SLE and suggest that nicotinamide holds promise for improving fertility in patients with SLE.


Figures
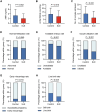
Fig. 1.
Fig. 1.. Decreased ovarian function and oocyte quality in women with SLE.
(A) Serum AMH levels for the SLE and control groups (n = 50/200). (B) AFC on the third day of the menstrual cycle for the SLE and control groups (n = 50/200). (C) Number of retrieved oocytes for the SLE and control groups (n = 99/287). (D) Normal fertilization rate for the SLE and control groups (n = 416/1735). (E) Available embryo rate for the SLE and control groups (n = 243/1104). (F) Oocyte utilization rate for the SLE and control groups (n = 416/1735). (G) Early miscarriage rate for the SLE and control groups (n = 33/175). (H) Live birth rate for the SLE and control groups (n = 74/333). Data are shown as the mean ± SD.
Fig. 2.
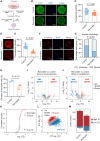
Fig. 2.. SLE damages mouse oocytes.
(A) Comparison of the number of GV oocytes collected from WT and SLE mice after superovulation (n = 7/7). (B and C) Immunofluorescence images showing mitochondrial membrane potential (TMRM; red) of the WT and SLE GV oocytes and the statistical histogram (n = 25/25). Scale bars, 10 μm. (D) Comparison of the number of MII oocytes collected from WT and SLE mice after superovulation and trigger (n = 5/5). (E and F) Immunofluorescence images showing mitochondrial membrane potential (TMRM; red) of the WT and SLE MII oocytes and the statistical histogram (n = 12/13). Scale bars, 10 μm. (G and H) Immunofluorescence images showing chromosome morphology [4′,6-diamidino-2-phenylindole (DAPI); blue] and microtubules (α-tubulin; red) of the WT and SLE MII oocytes and the statistical histogram (n = 45/52). Scale bars, 10 μm. (I) Representative images of embryo development after IVF of MII oocytes harvested from SLE and WT mice. Scale bars, 50 μm. (J) Statistical analysis of the rate of embryo formation at each stage in SLE and WT mice: embryo number/oocyte number per mouse (n = 5/5). Data are shown as the mean ± SD.
Fig. 3.
Fig. 3.. Distinct transcriptomics and translatomics patterns of GV and MII oocytes from SLE and WT mice.
(A) Schematic diagram depicting major procedures and principles of T&T-seq. (B to E) 3D PCA plot of the translatomics and transcriptomics of GV and MII oocytes from SLE and WT mice. (F to I) Volcano plots showing DEGs of SLE and WT oocytes identified by T&T-seq. Nodiff, no significant differences. P < 0.05, Wald test, log2 fold change (FC) > 1.5.
Fig. 4.
Fig. 4.. Translational defects in oocytes from SLE mice.
(A) TE cumulative curve of GV oocytes. The red line denotes the SLE group, and the blue line represents the WT group. (B) Scatter plot showing the RNA TE alterations of SLE GV oocytes compared with the WT group. Red and blue dots denote up- and down-regulated genes, respectively. Up-regulated, FC > 1; down-regulated, FC < 0.67. (C) Bar plots showing the numbers of high-TE genes (TE > 2) and low-TE genes (TE < 0.5) in the SLE group and the WT group GV oocytes. (D) TE cumulative curve of MII oocytes. The red line denotes the SLE group, and the blue line represents the WT group. (E) Scatter plot showing the RNA TE alterations of SLE MII oocytes compared with the WT group. Red and blue dots denote up- and down-regulated genes, respectively. Up-regulated, FC > 1; down-regulated, FC < 0.67. (F) Bar plots showing the numbers of high-TE genes (TE > 2) and low-TE genes (TE < 0.5) in the SLE group and the WT group MII oocytes (n = 3/3).
Fig. 5.
Fig. 5.. Effect of NAT10-mediated ac4C modification on gene translation in SLE mouse GV oocytes.
(A) Comparison of GV oocyte gene TE log2FC (SLE versus WT) in four groups with or without m6A and ac4C modifications. The top and bottom borders of the bars indicate the maximum and minimum values, and the middle horizontal line identifies the median. (B and C) Immunofluorescence images showing ac4C (red) and nuclei (DAPI; blue) of the WT and SLE GV oocytes and the statistical histogram (n = 11/18). Scale bars, 10 μm. (D) Comparison of GV oocyte gene TE in groups with or without m6A and ac4C modifications from SLE and WT mice. The dashed red line indicates the quartile, and the solid red line identifies the median. (E and F) Immunofluorescence images showing m6A (red) and nuclei (DAPI; blue) of the WT and SLE GV oocytes and the statistical histogram (n = 16/16). Scale bars, 10 μm. n.s., not significant. (G to I) Transcriptional expression, translational expression, and TE levels of Nat10 in mouse GV oocytes (n = 3/3). Data are shown as the mean ± SEM. (J) Quantitative reverse transcription polymerase chain reaction (RT-PCR) results showing the relative expression levels of mouse Nat10 mRNA in SLE and WT GV oocytes. Using enhanced green fluorescent protein (EGFP) expression levels as a reference for each sample (n = 3/3). Data were presented as mean ± SEM. (K and L) Immunofluorescence images showing NAT10 (red) and nuclei (DAPI; blue) of the WT and SLE GV oocytes and the statistical histogram (n = 15/10). Scale bars, 10 μm. Data are shown as the mean ± SD.
Fig. 6.
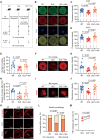
Fig. 6.. Phenotypic and omics landscape of remodelin-treated mouse oocytes in vitro.
(A) Flow chart depicting remodelin treatment. (B and C) Immunofluorescence images showing ac4C (green) and nuclei (DAPI; blue) of the remodelin-treated and the control GV oocytes and the statistical histogram (n = 17/20). Scale bars, 10 μm. (D and E) Immunofluorescence images showing mitochondrial membrane potential (TMRM; red) of the remodelin-treated and the control GV oocytes and the statistical histogram (n = 23/23). Scale bars, 10 μm. (F and G) Immunofluorescence images showing chromosome morphology (DAPI; blue) and microtubules (α-tubulin; red) of the remodelin-treated and the control MII oocytes and the statistical histogram (n = 90/59). Scale bars, 10 μm. (H) The in vitro first polar body (PB1) emission rates of mouse oocytes from the remodelin-treated and the control groups (n = 47 to 64). Each dot represents a single experiment replicate. (I and J) Volcano plots showing DEGs of the remodelin-treated and the control oocytes identified by T&T-seq. P < 0.05, Wald test, log2FC > 1.5. (K) TE cumulative curve of GV oocytes. The red line denotes the remodelin group, and the blue line represents the control group. (L) Scatter plot showing the RNA TE alterations of remodelin-treated oocytes compared with the control group. Red and blue dots denote up- and down-regulated genes, respectively. Up-regulated, FC > 1; down-regulated, FC < 0.67. (M) Bar plots showing the numbers of high-TE genes (TE > 2) and low-TE genes (TE < 0.5) in the remodelin-treated and the control group GV oocytes. Data are shown as the mean ± SD.
Fig. 7.
Fig. 7.. acRIP-seq landscape of SLE GV oocyte.
(A) Distribution and heatmap of ac4C modifications along substrate mRNA from three biological replicates of SLE GV oocytes. (B) Venn diagram portraying the overlap of target genes among three independent acRIP-seq biological replicates. (C) Motif identified by HOMER within acRIP-seq peaks in oocytes. (D and E) Scatter plot showing the acRIP-seq target genes in transcriptome and translatome of GV and MII oocytes (SLE versus WT; log2FC > 1). (F) KEGG analysis of ac4C genes identified in acRIP-seq. (G) Representative KEGG pathways of ac4C genes identified in acRIP-seq.
Fig. 8.
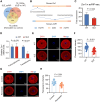
Fig. 8.. Zar1 is one of the target genes of ac4C modification in SLE oocytes.
(A) Venn diagram portraying the overlap of acRIP-seq target genes, down-regulated TE genes in SLE GV oocytes, and down-regulated TE genes in remodelin-treated oocytes. (B) The diagram displayed ac4C-modified potential sites of ZAR1 in Homo sapiens and Mus musculus. Sites were predicted by online tools [www.rnanut.net/paces/ (61)]. CDS, coding sequences; UTR, untranslated regions. (C) Fold enrichment levels of Zar1 in acRIP-seq from WT and SLE mouse GV oocytes (n = 3/3). (D) Quantitative RT-PCR results showing the relative expression levels of mouse Zar1 mRNA in SLE and WT GV oocytes. Using EGFP expression levels as a reference for each sample (n = 3/3). Data were presented as mean ± SEM. (E and F) Immunofluorescence images showing ZAR1 (red) and nuclei (DAPI; blue) of the WT and SLE GV oocytes and the statistical histogram (n = 27/21). Scale bars, 10 μm. Data are shown as the mean ± SD. (G and H) Immunofluorescence images showing ZAR1 (red) and nuclei (DAPI; blue) of the remodelin-treated and the control GV oocytes and the statistical histogram (n = 21/23). Scale bars, 10 μm. Data are shown as the mean ± SD.
Fig. 9.
Fig. 9.. Nicotinamide can improve the quantity and quality of oocytes in SLE mice by increasing ac4C modification.
(A) A timeline scheme for nicotinamide (NIA) treatment. ig, intragastric administration; ip, intraperitoneal; h, hours. (B) Immunofluorescence images showing ac4C (green), ZAR1 (red), and nuclei (DAPI; blue) of the SLE oocytes with and without NIA treatment and the WT GV oocytes. Scale bars, 10 μm. (C and D) Statistical histogram of fluorescence intensity for ac4C and ZAR1 (n = 17/13/16). (E) Comparison of the number of GV oocytes collected from the SLE mice with and without NIA treatment and the WT mice after superovulation (n = 10/10/10). COH, controlled ovarian hyperstimulation. (F and G) Immunofluorescence images showing mitochondrial membrane potential (TMRM; red) of the SLE GV oocytes with and without NIA treatment and the WT GV oocytes and the statistical histogram (n = 11/13/14). Scale bars, 10 μm. (H) Comparison of the number of MII oocytes collected from the SLE mice with and without NIA treatment and the WT mice after superovulation and trigger (n = 10/10/10). (I and J) Immunofluorescence images showing mitochondrial membrane potential (TMRM; red) of the SLE MII oocytes with and without NIA treatment and the WT MII oocytes and the statistical histogram (n = 17/11/14). Scale bars, 10 μm. (K and L) Immunofluorescence images showing chromosome morphology (DAPI; blue) and microtubules (α-tubulin; red) of the SLE MII oocytes with and without NIA treatment and the WT MII oocytes and the statistical histogram (n = 48/50/43). Scale bars, 10 μm. (M) The in vitro PB1 emission rates of mouse oocytes from the SLE mice with and without NIA treatment and the WT mice (n = 23 to 40). Each dot represents a single experiment replicate. Data are shown as the mean ± SD.

References

    1. Andreoli L., Bertsias G. K., Agmon-Levin N., Brown S., Cervera R., Costedoat-Chalumeau N., Doria A., Fischer-Betz R., Forger F., Moraes-Fontes M. F., Khamashta M., King J., Lojacono A., Marchiori F., Meroni P. L., Mosca M., Motta M., Ostensen M., Pamfil C., Raio L., Schneider M., Svenungsson E., Tektonidou M., Yavuz S., Boumpas D., Tincani A., EULAR recommendations for women's health and the management of family planning, assisted reproduction, pregnancy and menopause in patients with systemic lupus erythematosus and/or antiphospholipid syndrome. Ann. Rheum. Dis. 76, 476–485 (2017). - PMC - PubMed
    1. Tarter L., Bermas B. L., Expert perspective on a clinical challenge: Lupus and pregnancy. Arthritis Rheumatol. 76, 321–331 (2024). - PubMed
    1. Han Y. F., Yan Y., Wang H. Y., Chu M. Y., Sun K., Feng Z. W., Feng H., Effect of systemic lupus erythematosus on the ovarian reserve: A systematic review and meta-analysis. Joint Bone Spine 91, 105728 (2024). - PubMed
    1. Giambalvo S., Garaffoni C., Silvagni E., Furini F., Rizzo R., Govoni M., Bortoluzzi A., Factors associated with fertility abnormalities in women with systemic lupus erythematosus: A systematic review and meta-analysis. Autoimmun. Rev. 21, 103038 (2022). - PubMed
    1. Ma W., Zhan Z., Liang X., Chen J., Huang X., Liao C., Subclinical impairment of ovarian reserve in systemic lupus erythematosus patients with normal menstruation not using alkylating therapy. J. Womens Health 22, 1023–1027 (2013). - PMC - PubMed

MeSH terms

LinkOut - more resources