. 2025 Sep;12(5):e200436.
doi: 10.1212/NXI.0000000000200436. Epub 2025 Jul 18.

AChR Autoantibody Pathogenic Properties Are Heterogeneously Distributed and Undergo Temporal Changes Among Patients With Myasthenia Gravis

Affiliations

AChR Autoantibody Pathogenic Properties Are Heterogeneously Distributed and Undergo Temporal Changes Among Patients With Myasthenia Gravis

Fatemeh Khani-Habibabadi et al. Neurol Neuroimmunol Neuroinflamm. 2025 Sep.

Abstract

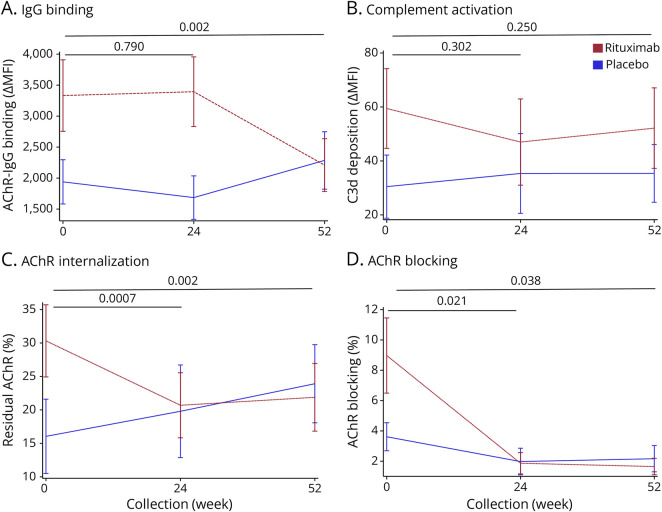
Background and objectives: Acetylcholine receptor (AChR) autoantibodies contribute to myasthenia gravis (MG) pathogenesis through 3 mechanisms: complement activation, receptor internalization, and acetylcholine (ACh) binding site blocking. Recently approved therapies target these autoantibodies by inhibiting the complement pathway or blocking the neonatal Fc receptor, reducing IgG autoantibody levels. However, these approaches have limitations: complement inhibitors do not address complement-independent mechanisms, and FcRn blockers only target IgG. Understanding how different pathogenic mechanisms, isotypes, and IgG subclasses are represented in the AChR autoantibody repertoire could lead to more precise application of therapeutics. To address this, we used advanced live cell-based assays to study autoantibody heterogeneity in longitudinally collected patient samples.

Methods: Serum samples (N = 210) from 50 AChR IgG+ generalized MG patients collected longitudinally over 2 years were evaluated using a set of cell-based assays to measure complement activation, receptor internalization, ACh binding site blocking, and the frequency of the IgM and IgA isotypes and IgG subclasses.

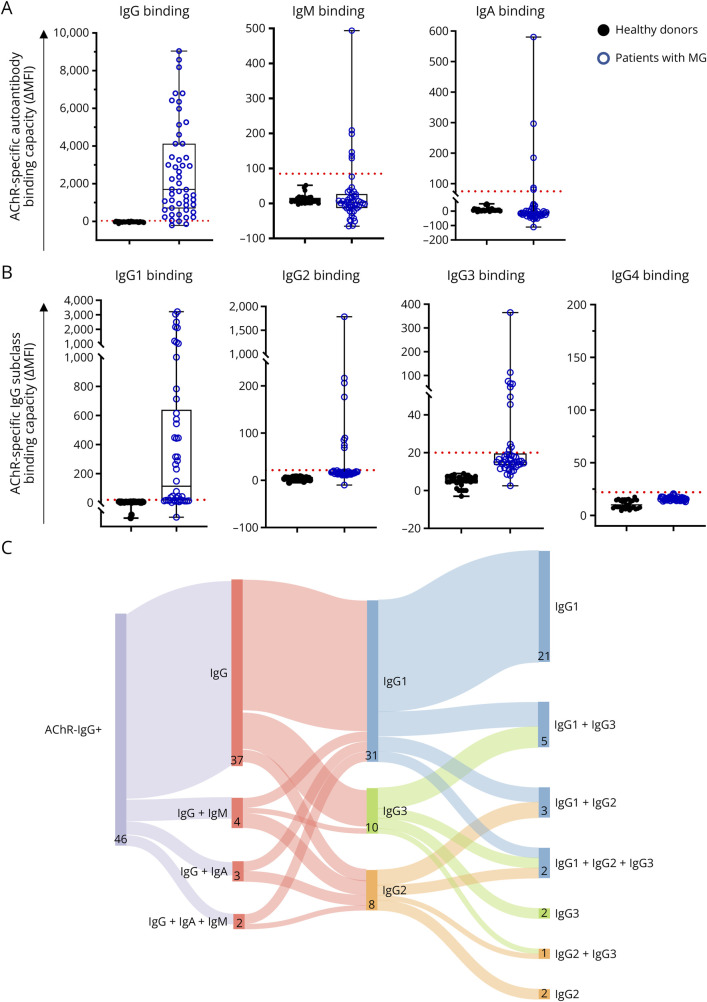
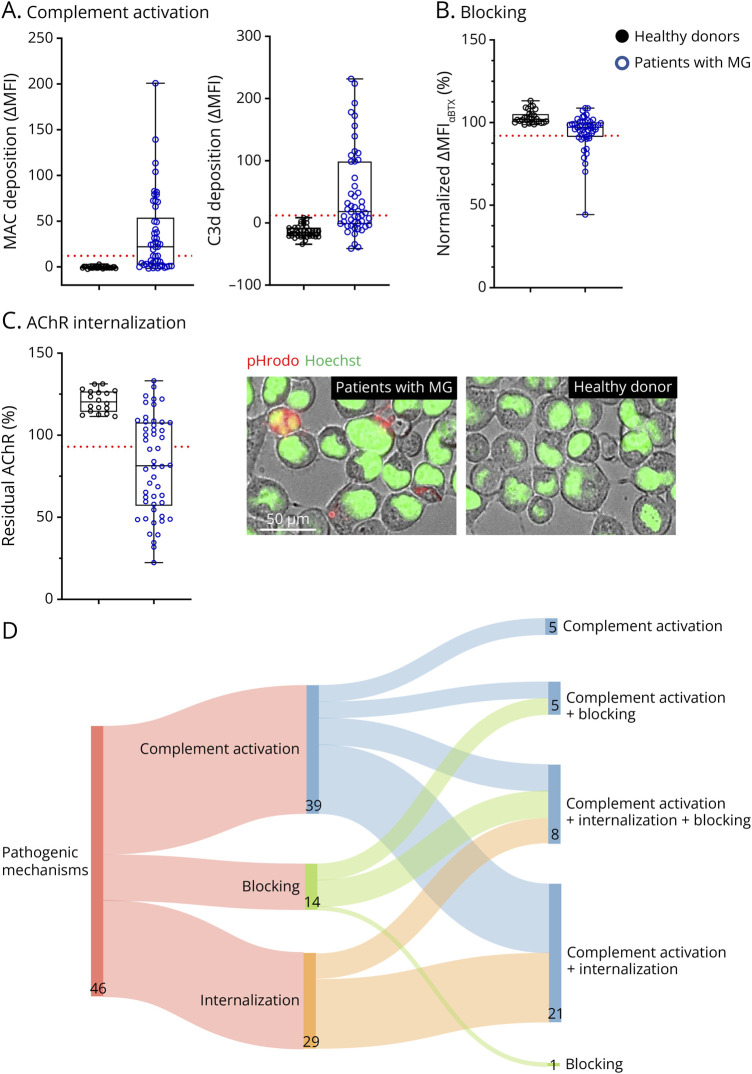
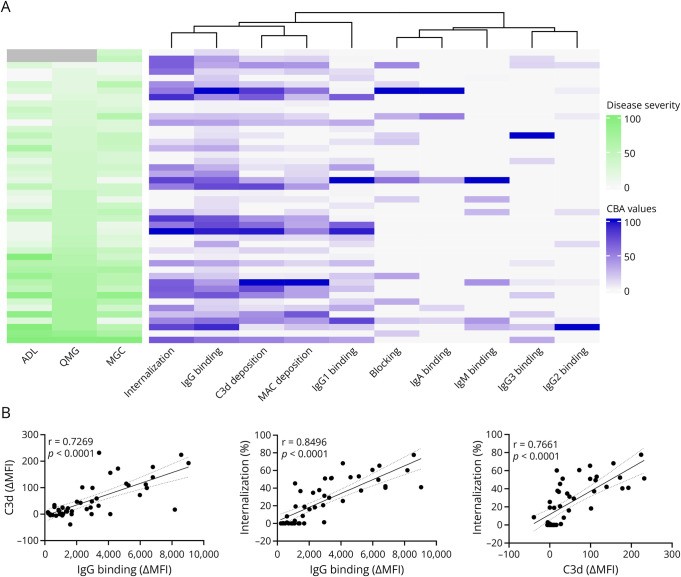
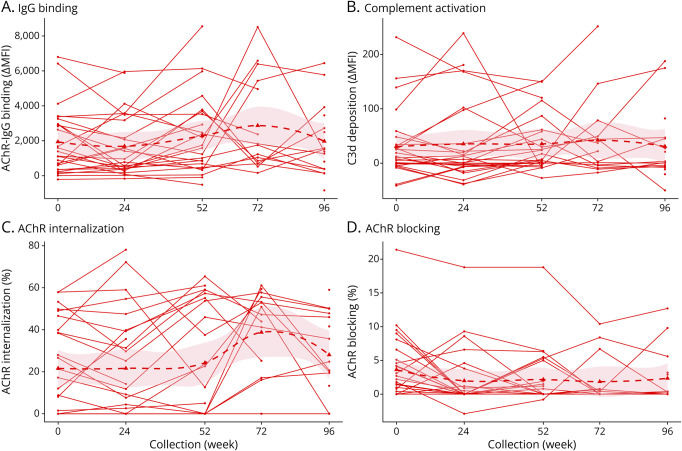
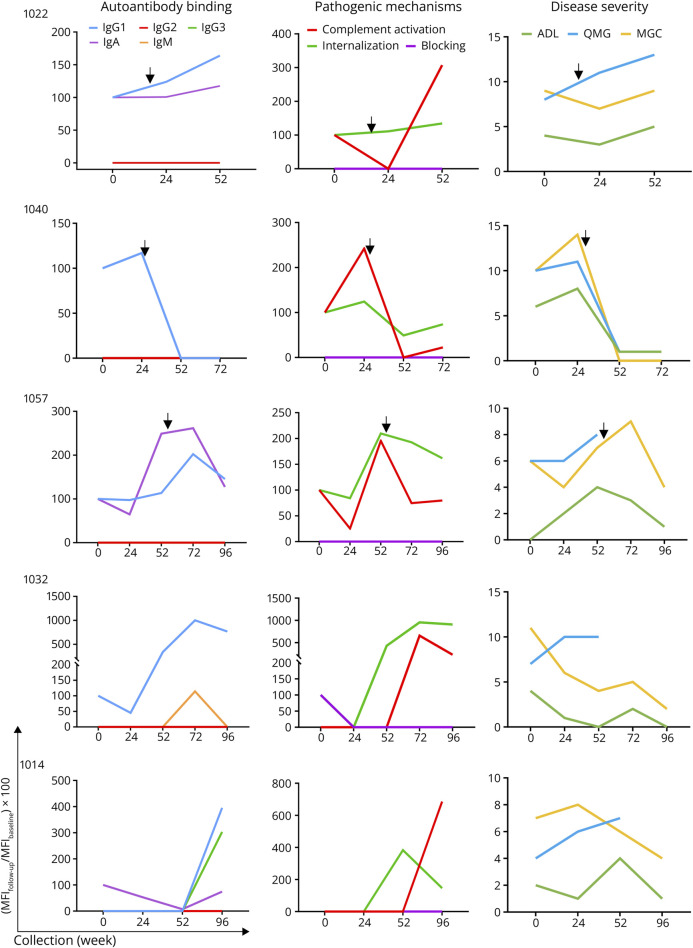
Results: In cross-sectional samples, IgA and IgM autoantibodies co-occurred with IgG in 10% and 12% of patients, respectively. In addition, 4% of patients had all 3 isotypes (IgA, IgM, and IgG) present simultaneously. AChR-IgG1 was found in 67.4%, followed by IgG3 (21.7%) and IgG2 (17.4%). Complement was active in 84.8%, followed by AChR internalization (63%) and blocking (30.4%). Complement and AChR internalization were simultaneously active in 45.6%, complement and blocking were active in 10.8%, and all 3 pathomechanisms were active in 17.4%. Blocking alone was active in only 2.1%; AChR internalization alone was not found. Autoantibody binding capacity was associated with the magnitude of complement activation and AChR internalization. Temporal fluctuations of autoantibody binding capacity and the associated pathogenic mechanisms were observed. Pathogenic mechanisms were not associated with disease severity in cross-sectional analyses. However, longitudinally, disease severity measures followed a similar trend to the AChR autoantibody repertoire and mediated pathogenic mechanisms in some individuals, but not others.

Discussion: These findings highlight subsets of patients with MG with autoantibodies that can mediate pathogenic mechanisms or include isotypes that some therapeutics may not effectively target. Consequently, we suggest incorporating comprehensive autoantibody profiling into future MG clinical trials to further investigate potential associations with treatment outcomes.


Conflict of interest statement

K.C.O. has received research support from Ra Pharma, now (UCB Pharma), Alexion Rare Disease (Astra Zeneca), Viela Bio (Horizon Therapeutics/Amgen), argenx, and Seismic Therapeutic. K.C.O. is an equity shareholder of Cabaletta Bio. K.C.O. has served on advisory boards for Roche, Merck (EMD Serono), and IgM Biosciences, and received speaking fees from Amgen and argenx. B.R. has been a consultant/advisor for Alexion (now part of AstraZeneca), Takeda, and argenx. In addition, B.R. has received research support from the Martin Shubik Fund for IBM at Yale University, NIH, Abcuro Pharmaceuticals, Immunovant, Takeda. B.R. is a shareholder of Cabaletta Bio. R.J.N. has received research support from the NIH, Genentech, Alexion (Astra Zeneca), argenx, Annexon Biosciences, Ra Pharmaceuticals (now UCB), MGFA , Momenta (now Janssen), Immunovant, Grifols, and Viela Bio (Horizon Therapeutics, now Amgen). R.J.N. has also served as a consultant/advisor for Alexion (Astra Zeneca), argenx, Cabaletta Bio, CSL Behring, Grifols, Ra Pharmaceuticals (now UCB Pharma), Immunovant, Momenta (now Janssen), Viela Bio (Horizon Therapeutics, now Amgen). The authors have no additional financial interests. All other authors declare no competing financial interests. Go to Neurology.org/NN for full disclosures.

Figures

Figure 1
Figure 1. Distribution of AChR Autoantibody Isotypes and IgG Subclasses
Serum samples collected from AChR+ MG patients at baseline (N = 50) were tested for the presence of AChR autoantibody isotypes and IgG subclasses using AChR-specific cell-based autoantibody binding assays. The binding capacity of (A) AChR-IgG, IgM, and IgA is shown. Patients with AChR-IgG (N = 46) were further examined for AChR-IgG subclasses: (B) AChR-IgG1, IgG2, IgG3, and IgG4. (C) Sankey diagram showing the overall distribution of AChR autoantibody isotypes and IgG subclasses in patients with AChR-IgG (N = 46). Each data point shown (A and B) represents the mean of experimental triplicates. The dotted line represents the antibody detection threshold (healthy donor mean +3 × SD). ΔMFI, change in median fluorescence intensity (MFI), calculated as the MFI of AChR-positive cells minus the MFI of AChR-negative cells. AChR = acetylcholine receptor.
Figure 2
Figure 2. Measurement of AChR Autoantibody–Mediated Pathogenic Mechanisms
AChR IgG–positive serum samples collected at baseline (N = 46) were examined to measure AChR autoantibody–mediated pathogenic mechanisms, including complement activation, receptor internalization (antigenic modulation), and ACh binding site blocking (receptor antagonism), using cell-based assays. The capacity of serum antibodies to activate complement was measured (A) by MAC and C3d deposition on the surface of AChR-expressing HEK293T cells. The capacity of serum AChR autoantibodies to block the ACh binding site (B) was measured using median fluorescence intensity (MFI) values of florescent α-BTX that were normalized to the untreated control (no mAb) as the upper limit (set to 100%). The capacity of AChR autoantibodies to internalize AChR (C) was determined by measuring AChR on the surface of CN21 cells. Here, the left panel shows normalized MFI values to the untreated control (no mAb) as the upper limit (set to 100%), and the right panel shows representative images of internalized IgG bound to AChR using fluorescence microscopy. Each data point (A-C) represents a mean of experimental triplicates. The dotted lines represent the detection threshold (healthy donor mean +3 × SD for the complement assay and healthy donor mean–3 × SD for the blocking and internalization assays). (D) The distribution and overlap of AChR autoantibody–mediated pathogenic mechanisms at the baseline time point of the patient cohort (N = 46), represented with a Sankey diagram. ΔMFI, change in MFI, calculated as the MFI of AChR-positive cells minus the MFI of AChR-negative cells. AChR = acetylcholine receptor; mAb = monoclonal antibody.
Figure 3
Figure 3. Association Between Autoantibody Binding Capacity, Pathogenic Mechanisms, and Disease Severity
Serum samples collected at baseline were examined to investigate how autoantibody binding capacity, the autoantibody-mediated pathogenic mechanisms, and disease severity associate. Heatmap (A) showing the binding capacity of AChR-IgG, IgA, IgM, and IgG subclasses; the magnitude of each autoantibody-mediated pathogenic mechanism; and disease severity scores for each individual (N = 46). Each row represents the mean of triplicate tests for an individual patient. To allow for comparison across different assays, the data were normalized as follows: For each assay, the value for each patient was divided by the highest value observed in that specific assay across the entire patient cohort multiplied by 100. This results in a normalized value between 0 and 100, representing the patient value as a proportion of the maximum observed value for that assay. Disease severity scores, including Quantitative Myasthenia Gravis (QMG), Myasthenia Gravis–Activities of Daily Living (MG-ADL), and Myasthenia Gravis Composite (MGC), were similarly normalized by dividing each patient score by the highest score observed in the cohort and then expressing the value for each patient as a percentage of the maximum observed score. Rows are sorted by QMG scores (normalized values), and columns are displayed using unsupervised hierarchical clustering. (B) Scatterplots showing Spearman correlation analyses between AChR autoantibody binding, complement activation, and internalization, as well as between complement activation and internalization, at baseline within the AChR-IgG–positive patient cohort (N = 46). Correlations were calculated using Δ median fluorescence intensity (MFI) values and assessed using the Spearman rank correlation test. ΔMFI, change in MFI, calculated as the MFI of AChR-positive cells minus the MFI of AChR-negative cells. AChR = acetylcholine receptor.
Figure 4
Figure 4. Efficiency of AChR Autoantibody Isotypes and IgG Subclasses in Activating Complement and Mediating AChR Internalization
The variable region heavy chain of AChR-specific mAbs was subcloned into antibody isotype and IgG subclass expression vectors to assess differences in their ability to activate complement, internalize, and bind AChR. Titration plot curves for (A) C3d deposition and (B) AChR internalization are shown for mAb-637 IgG subclasses, IgA, and IgM tested over a range of concentrations. The mAb-58 IgG1 (AQP4-specific) was included as a negative control. Two-way analysis of variance (ANOVA) was used, followed by the Tukey post-test. A significance threshold of p < 0.05 was used and is shown on plots when significance was reached: *p < 0.05, **p < 0.01, ***p < 0.001, and ****p < 0.0001. Asterisks (*) compare mAb-637 IgM with IgG3; octothorpes (#) compare IgG3 with IgG1. Titration plot curves showing (C) binding capacity and (D) complement activation of mAbs-03, mAbs-04, and mAbs-09 for mature and immature IgG and IgM mAbs. Two-way ANOVA with the Tukey multiple comparisons test was used to assess statistical significance, with detailed results for all comparisons for C and D presented in eTable 6. Data points represent mean ± SD of experimental duplicates. ΔMFI, change in median fluorescence intensity (MFI), calculated as the MFI of AChR-positive cells minus the MFI of AChR-negative cells. AChR = acetylcholine receptor; mAb = monoclonal antibody.
Figure 5
Figure 5. Temporal Changes in Both Autoantibody Binding Capacity and the Magnitude of Antibody-Mediated Pathogenic Mechanisms
Serum samples collected longitudinally from the placebo group (N = 26) were examined to determine how the capacity of AChR autoantibody binding and the associated pathogenic mechanisms changed within each patient over 2 years. Spaghetti plots show temporal changes in (A) AChR-IgG binding capacity and the magnitude of (B) C3d deposition, (C) AChR internalization, and (D) blocking. Each line represents a single patient (mean of experimental triplicates). Solid lines connect collection time points. The trend line (smooth bold curve) was created using the Locally Estimated Scatterplot Smoothing (LOESS) method. The shaded area depicts a 95% CI. The AChR internalization and blocking percentages were measured as described in Figure 2. ΔMFI, change in median fluorescence intensity (MFI), calculated as the MFI of AChR-positive cells minus the MFI of AChR-negative cells. AChR = acetylcholine receptor.
Figure 6
Figure 6. Temporal Changes in Autoantibody Binding Capacity, Autoantibody-Mediated Pathogenic Mechanisms, and Disease Severity Measures in Five Representative Patients
Longitudinal data collected over 2 years from 5 representative patients in the placebo group, whose aggregate data are presented in Figure 5, are demonstrated to compare AChR autoantibody binding capacity, associated pathogenic mechanisms, and disease severity scores. Spaghetti plots display the temporal changes in the frequency of AChR autoantibody isotypes and IgG subclasses, associated pathogenic mechanisms, and disease severity measures in 5 representative patients who were part of the placebo group. Each row represents data from an individual patient. The left column displays changes in AChR autoantibody isotype and IgG subclass binding. The middle column displays changes in associated pathogenic mechanisms. The right column displays changes in disease severity measures. The change in binding capacity and pathogenic mechanisms is shown as a percentage change from baseline, calculated as (median fluorescence intensity [MFI] follow-up/MFI baseline) × 100. If the baseline value was 0, the positive detection threshold (mean ΔMFI +3 × SD of healthy donors) was used instead of the baseline value. Arrows indicate relapses. Only data above the healthy donor threshold (detectable threshold) are shown; values below this threshold are displayed as zero. ΔMFI, change in MFI, calculated as the MFI of AChR-positive cells minus the MFI of AChR-negative cells. AChR = acetylcholine receptor.
Figure 7
Figure 7. Effect of Rituximab on the AChR Autoantibody Repertoire and Associated Pathogenic Mechanisms
Longitudinal serum samples from the placebo (n = 26) and rituximab (n = 24) groups collected over one year at baseline and 2 additional time points were tested using AChR-specific cell-based assays to evaluate the effects of rituximab on AChR-IgG and the associated pathogenic mechanisms. The graphs compare rituximab and placebo groups for (A) the mean response of the AChR-IgG binding capacity, (B) the magnitude of the C3d deposition, (C) AChR internalization, and (D) blocking of the ACh binding site. Data were analyzed using a longitudinal mixed model. Error bars represent mean ± SEM, with assays performed in experimental triplicates. The AChR internalization and blocking percentages were calculated as (100– [% residual AChR or % reduction of α-BTX median fluorescence intensity (MFI)]). Longitudinal statistical analysis compared accumulated changes between the rituximab and the placebo groups. A significance threshold of p < 0.05 was used. ΔMFI, change in median fluorescence intensity (MFI), calculated as the MFI of AChR-positive cells minus the MFI of AChR-negative cells. AChR = acetylcholine receptor.

Similar articles

References

    1. Rose N, Holdermann S, Callegari I, et al. Receptor clustering and pathogenic complement activation in myasthenia gravis depend on synergy between antibodies with multiple subunit specificities. Acta Neuropathol. 2022;144(5):1005-1025. doi: 10.1007/s00401-022-02493-6 - DOI - PMC - PubMed
    1. Pham MC, Masi G, Patzina R, et al. Individual myasthenia gravis autoantibody clones can efficiently mediate multiple mechanisms of pathology. Acta Neuropathol. 2023;146(2):319-336. doi: 10.1007/s00401-023-02603-y - DOI - PMC - PubMed
    1. Li H, Pham MC, Teng J, O'Connor KC, Noviello CM, Hibbs RE. Autoimmune mechanisms elucidated through muscle acetylcholine receptor structures. Cell. 2025;188(9):2390-2406.e20. doi: 10.1016/j.cell.2025.03.004 - DOI - PMC - PubMed
    1. Lefvert AK, Cuénoud S, Fulpius BW. Binding properties and subclass distribution of anti-acetylcholine receptor antibodies in myasthenia gravis. J Neuroimmunol. 1981;1:125-135. doi: 10.1016/0165-5728(81)90015-1 - DOI - PubMed
    1. Vincent A, Newsom-Davis J. Acetylcholine receptor antibody characteristics in myasthenia gravis. I. Patients with generalized myasthenia or disease restricted to ocular muscles. Clin Exp Immunol. 1982;49(2):257-265. - PMC - PubMed