. 2025 Sep:85:103765.
doi: 10.1016/j.redox.2025.103765. Epub 2025 Jul 9.

c-Myc promotes metabolic reprogramming in pulmonary hypertension via the stimulation of glutaminolysis and the reductive tricarboxylic acid cycle

Affiliations

c-Myc promotes metabolic reprogramming in pulmonary hypertension via the stimulation of glutaminolysis and the reductive tricarboxylic acid cycle

Manivannan Yegambaram et al. Redox Biol. 2025 Sep.

Abstract

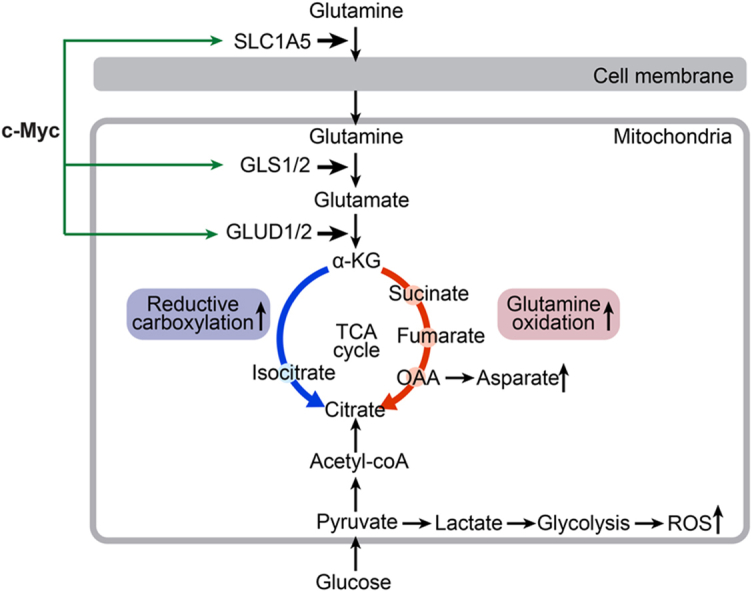
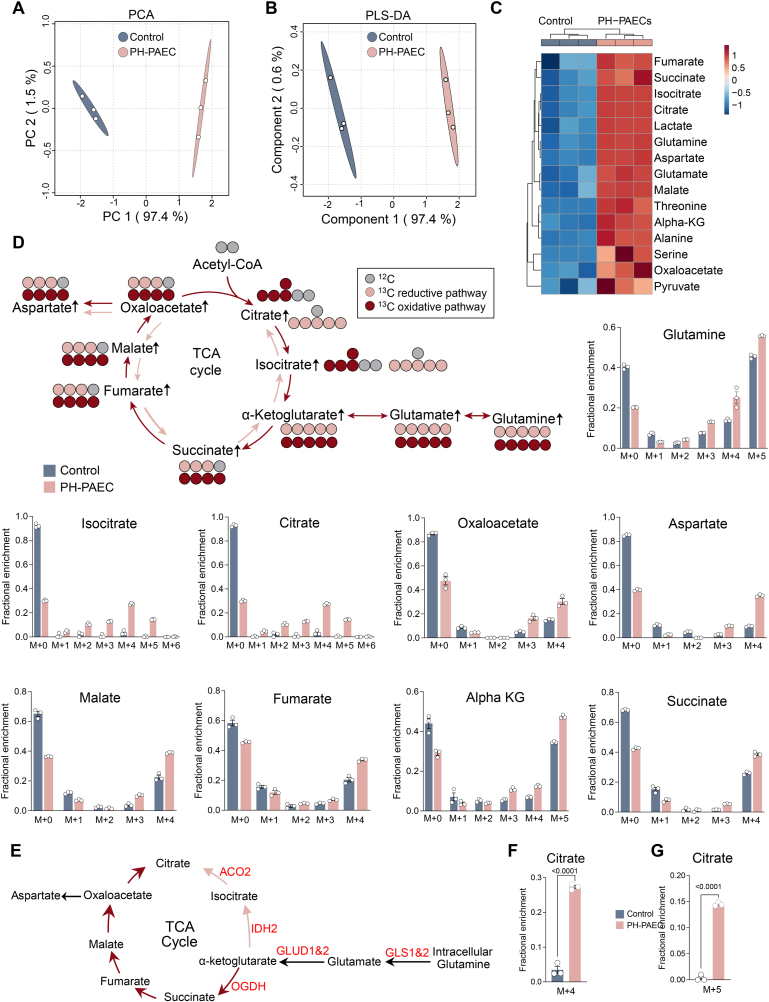
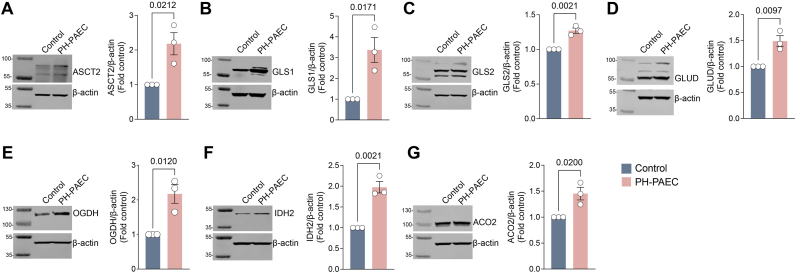
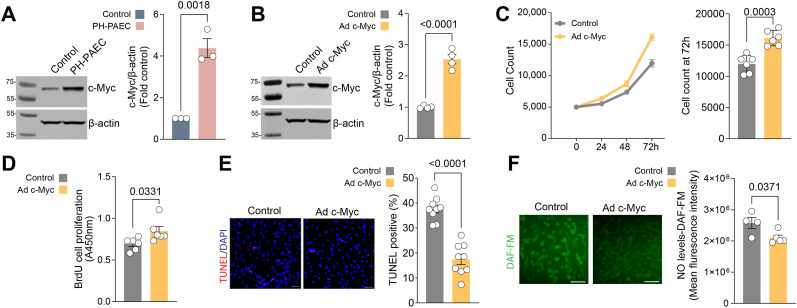
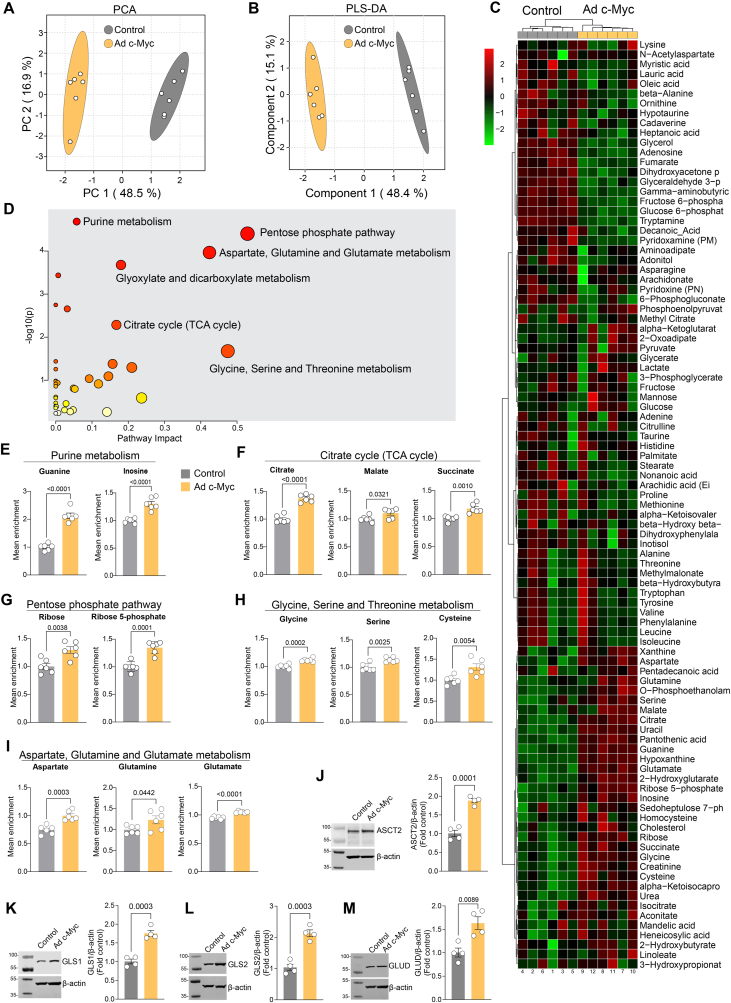
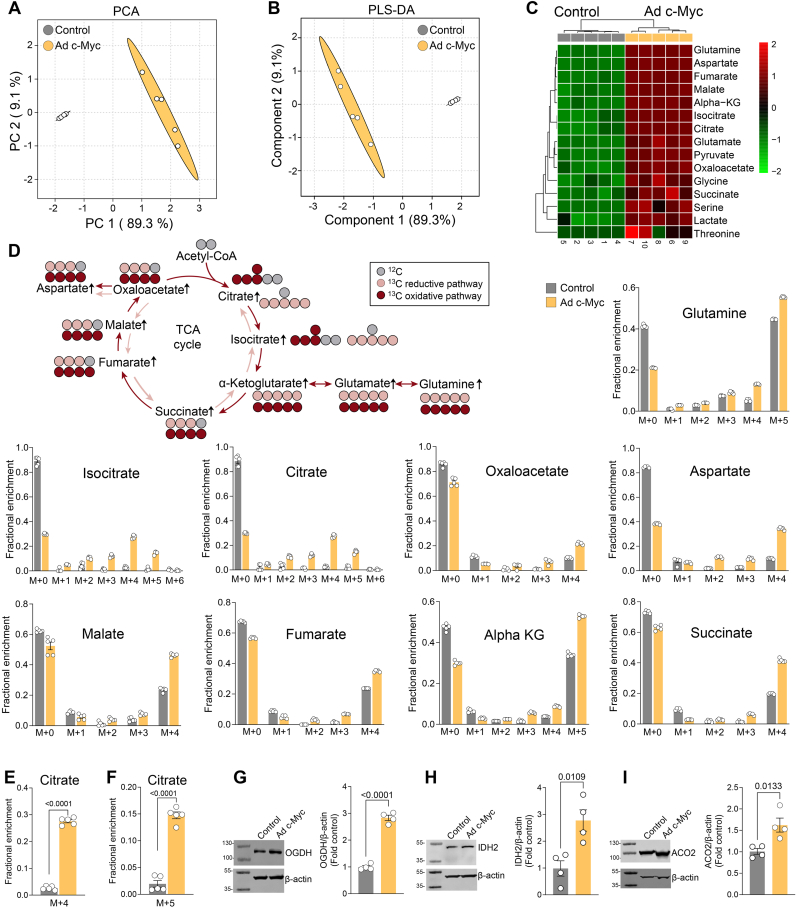
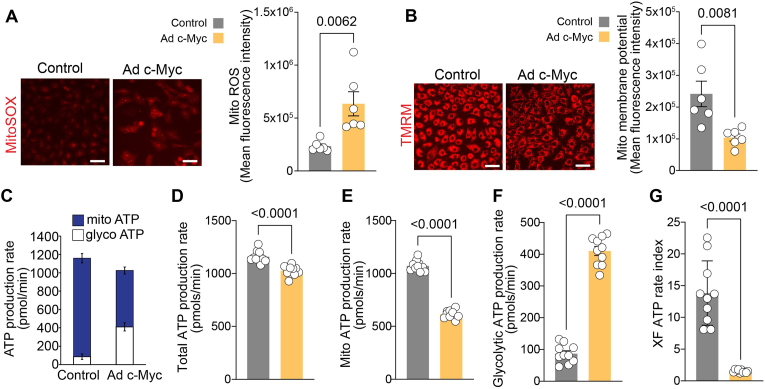
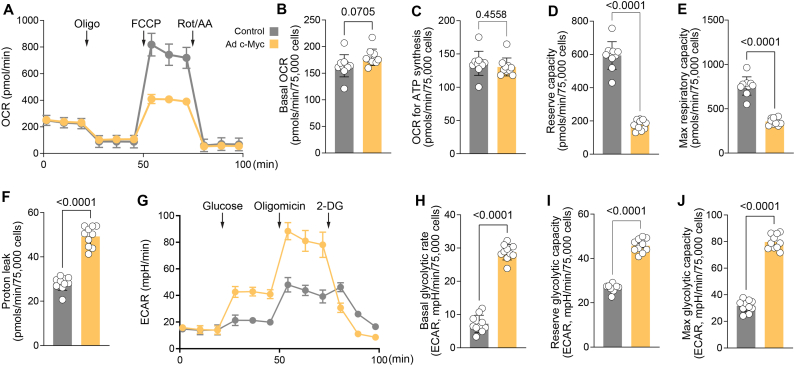
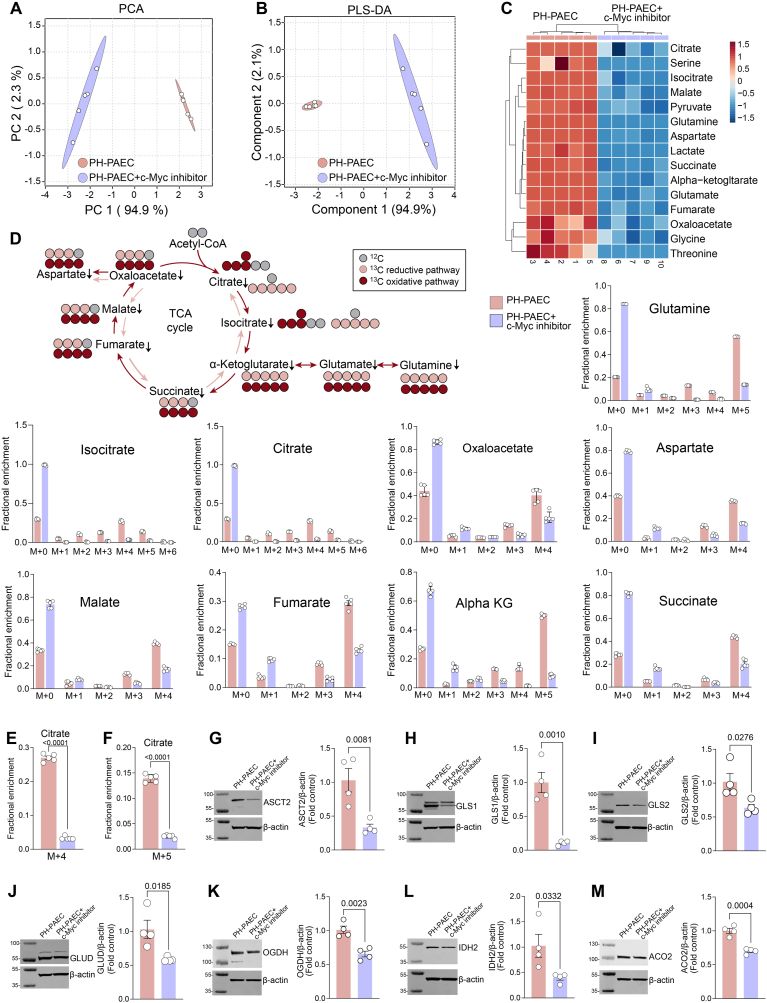
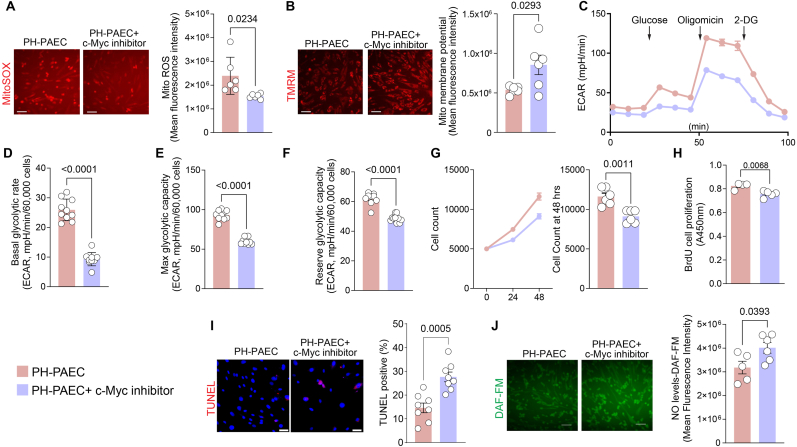
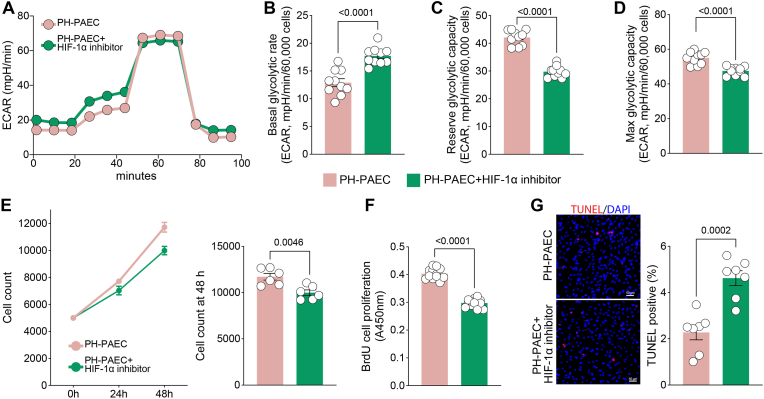
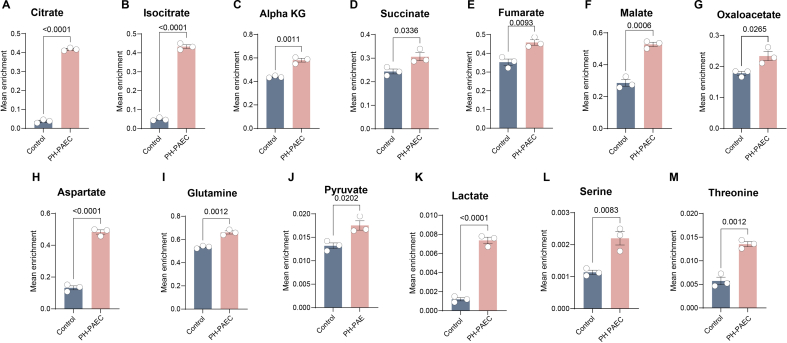
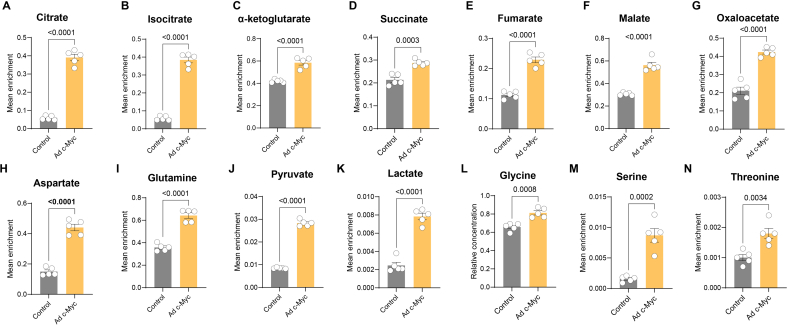
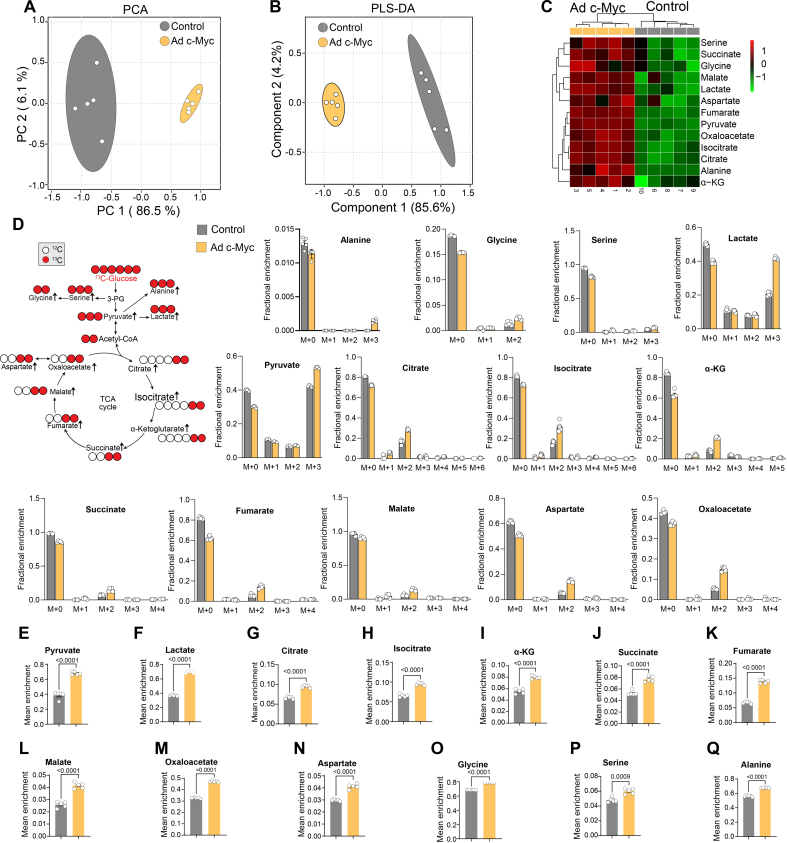
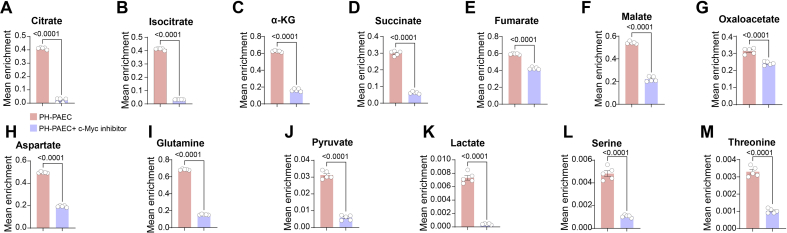
Endothelial cell (EC) dysfunction is key in initiating and progressing pulmonary hypertension (PH). EC dysfunction in PH leads to hyperproliferation and vascular remodeling of the pulmonary blood vessels. Increased glutaminolysis and altered cellular metabolism are pivotal in hyperproliferative cancer cells. However, whether a similar enhancement in glutamine metabolism is involved in the EC hyperproliferation and if this contributes to vascular remodeling during PH development is unresolved and was the focus of our study. Metabolic flux analysis showed elevated glutaminolysis and enhanced metabolic flux through the reductive tricarboxylic acid (TCA) cycle in pulmonary arterial ECs isolated from an ovine experimental model of PH (PH-PAECs). PH-PAECs also exhibited increased c-Myc protein levels, a master regulator of glutaminolysis. Therefore, we assessed the effect of increased c-Myc expression on metabolic reprogramming, glutaminolysis, and proliferation in control PAECs. Results from a comprehensive snapshot metabolomics investigation and metabolic flux analysis confirmed the reprogramming of mitochondrial metabolism, enhanced glutamine metabolism, and increased glycolysis in c-Myc overexpressing PAECs. Additionally, c-Myc overexpression impacted the ATP production rate, disrupted mitochondrial respiration, increased reactive oxygen species production, induced cell proliferation, and suppressed apoptosis. Functionally, these metabolic changes suppressed nitric oxide (NO) production. We also demonstrate that a small-molecule c-Myc inhibitor, 10058-F4, attenuates glutaminolysis, suppresses the reverse TCA cycle and glycolysis, and reverses the hyperproliferative phenotype, thereby restoring NO levels in PH-PAECs. We also demonstrate that directly targeting HIF-1α reverses the hyper-proliferative, anti-apoptotic phenotype in PH-PAECs. Thus, targeting c-Myc signaling and suppressing glutaminolysis or glycolysis could be a novel therapy for PH.

Keywords: Endothelial cells; Glutaminolysis; Glycolysis; Metabolomics; Proliferation; Pulmonary hypertension.


Conflict of interest statement

Declaration of competing interest None.

Figures

Image 1
Graphical abstract
Fig. 1
Fig. 1
Glutamine metabolism is increased in pulmonary hypertensive pulmonary arterial endothelial cells. Score plots of Principal Component Analysis (PCA, A) and Partial Least Squares Discriminant Analysis (PLS-DA, B) models for the 13C5-glutamine flux data obtained by GC-MS, showing the metabolic profile differences between control (blue) and PH-PAECs (brown) groups. Hierarchical clustering heat map of the 15 differential metabolites, with the degree of change marked with brown (up-regulation) and blue (down-regulation) (C). Schematic model of glutamine metabolism in PH-PAECs with 13C Isotopologue concentrations of TCA cycle metabolites determined by GC-MS (D). The dark brown arrows indicate oxidative carboxylation flux from glutamine. The light brown arrows indicate reductive carboxylation. Dark brown circles represent 13C in the oxidative glutamine metabolism pathway. Light brown circles represent 13C in the reductive carboxylation pathway. Grey circles represent 12C carbon. The bar graphs show fractional enrichment from the 13C5-glutamine tracer generated by IsoCor software. A schematic model of the enzymes and the fate of glutamine in the TCA cycle (E). The dark brown arrows indicate oxidative carboxylation, and the light brown arrows indicate reductive carboxylation. The fractions of citrate containing four 13C carbons (F) or five 13C carbons (G) after culturing with 13C5-glutamine are shown. Data are mean ± SEM; Experiments were performed with PAECs isolated from three independent PH lambs and three independent age-matched control lambs.
Fig. 2
Fig. 2
Increased expression of enzymes responsible for glutaminolysis in pulmonary hypertensive pulmonary arterial endothelial cells. Western blot analysis revealed increased expression of glutamine transporter ASCT2 (A), as well as the glutaminolysis enzymes GLS1 (B), GLS2 (C) and GLUD 1/2 (D) in PH-PAECs. There was also increased expression of the enzymes responsible for both oxidative decarboxylation, OGDH (E) and reductive carboxylation, IDH2 (F) and ACO2 (G) in PH-PAECs. Representative images are shown. β-actin was used to normalize loading. Data are mean ± SEM; Experiments were performed with PAECs isolated from three independent PH lambs and three independent age-matched control lambs.
Fig. 3
Fig. 3
c-Myc enhances cellular proliferation and decreases apoptosis in pulmonary arterial endothelial cells. Western blot analysis reveals increased c-Myc protein levels in PH-PAECs (A). Control PAECs were transduced with Ad-c-Myc (MOI = 5) or Ad-GFP (MOI = 5; control) for 48h, and Western blot analysis was used to confirm increased c-Myc protein levels (B). Representative images are shown. β-actin was used to normalize loading. c-Myc overexpression enhances the proliferation of PAECs as determined by direct cell counting (C) and 5-bromo-2′-deoxyuridine (BrdU) incorporation (D). The levels of apoptosis induced by TNFα (2 ng/ml, 12h) detected by TUNEL staining was decreased in c-Myc overexpressing cells (E). Scale bar = 20 μm. c-Myc overexpression decreases NO generation in PAECs, as shown by reductions in fluorescent intensity of the NO probe DAF-FM (F). Scale bar = 20 μm. Data are mean ± SEM; PH-PAECs were isolated from three independent PH lambs and three independent age-matched control lambs; all other experiments were performed with at least four biological replicates.
Fig. 4
Fig. 4
c-Myc overexpression causes metabolic reprogramming in pulmonary arterial endothelial cells. PCA (A) and PLS-DA (B) score plots were generated using MetaboAnalyst based on intracellular metabolites in c-Myc overexpressing PAECs compared with GFP-expressing (control) PAECs. Grey: Control group; yellow: c-Myc overexpressing group. Heatmap illustrating alterations in metabolite levels in c-Myc overexpressing, compared to GFP-expressing (control) PAECs (C). Red indicates the relative upregulation, and Green indicates the relative downregulation of individual metabolites. A metabolic pathway analysis plot generated using MetaboAnalyst shows that c-Myc overexpression alters multiple metabolic pathways in PAECs (D). The x-axis represents the pathway impact value computed from pathway topological analysis, and the y-axis is the-log of the P-value obtained from pathway enrichment analysis (D). The most significantly changed pathways are characterized by a high-log(p) value and a high impact value (top right region). Among the purine bases, the levels of inosine and guanine were increased in c-Myc overexpressing PAECs (E). The over-expression of c-Myc significantly increased the TCA intermediates citrate, malate, and succinate (F). Within the pentose phosphate pathway, the levels of ribose-5-phosphate and ribose were increased in c-Myc overexpressing PAECs (G). c-Myc increased the levels of glycine, serine, and cysteine among the glyoxylate and dicarboxylate metabolism pathway and the glycine, serine, and threonine pathway (H). The over-expression of c-Myc increased the levels of aspartate, glutamine, and glutamate (I). Western blot analysis confirmed increases in ASCT2 (J), GLS1 (K), GLS2 (L), GLUD (M) enzyme levels in c-Myc overexpressing PAECs. Representative images are shown. β-actin was used to normalize loading. Data are mean ± SEM; All experiments were performed with at least four biological replicates.
Fig. 5
Fig. 5
Overexpression of c-Myc promotes metabolization of glutamine carbons in the TCA cycle. PCA (A) and PLS-DA (B) score plots were generated for the 13C5-glutamine flux data showing the metabolic profile differences between GFP- (control) and c-Myc-overexpressing PAECs. Grey: Control group; yellow: c-Myc overexpressing group. Heatmap illustrating alterations in metabolite levels in c-Myc overexpressing, compared to GFP-expressing (control) PAECs (C). Red indicates the relative upregulation, and Green indicates the relative downregulation of the 15 differential metabolites (C). Schematic model of glutamine metabolism in PH-PAECs with 13C Isotopologue concentrations of TCA cycle metabolites determined by GC-MS (D). The dark brown arrows indicate oxidative carboxylation flux from glutamine. The light brown arrows indicate reductive carboxylation. Dark brown circles represent 13C in the oxidative glutamine metabolism pathway. Light brown circles represent 13C in the reductive carboxylation pathway. Grey circles represent 12C carbon. The bar graphs show fractional enrichment from the 13C5-glutamine tracer generated by IsoCor software. The fractions of citrate containing four 13C carbons (E) or five 13C carbons (F) after culturing with 13C5-glutamine are shown. Western blot analysis confirmed increases in OGDH (G), IDH2 (H), and ACO2 (I) enzyme levels in c-Myc overexpressing PAECs. Representative images are shown. β-actin was used to normalize loading. Data are mean ± SEM; All experiments were performed with at least four biological replicates.
Fig. 6
Fig. 6
Overexpression of c-Myc disrupts mitochondrial function and alters cellular ATP production rate in pulmonary arterial endothelial cells. The over-expression of c-Myc significantly increases mitochondrial ROS generation (A) and decreases mitochondrial membrane potential (B) in PAECs. The overexpression of c-Myc also decreases the total cellular ATP production rate (C&D). The mitochondrial ATP production rate is reduced (E), but the glycolytic ATP production rate increases (F). Overall, these changes decreased the ATP rate index (G). Data are mean ± SEM; All experiments were performed with at least six biological replicates.
Fig. 7
Fig. 7
Overexpression of c-Myc disrupts mitochondrial bioenergetics and stimulates cellular glycolysis in pulmonary arterial endothelial cells. c-Myc overexpression disrupts the bioenergetic profile for oxygen consumption rate (OCR) (A). Although basal respiration (B) and the OCR for ATP synthesis (C) remain unchanged, the reserve (D) and maximum (E) respiratory capacity are decreased. At the same time, the proton leak is increased (F). c-Myc overexpression stimulates the extracellular acidification rate (ECAR) profile in PAECs (G) such that basal glycolysis (H), the reserve (I), and maximal (J) glycolytic capacities are all enhanced. Data are mean ± SEM; All experiments were performed with at least ten biological replicates.
Fig. 8
Fig. 8
Inhibition of c-Myc attenuates glutamine metabolism in pulmonary hypertensive pulmonary arterial endothelial cells. PH-PAECs were treated or not with the c-Myc inhibitor 10058-F4 (20 μm, 16h). PCA (A) and PLS-DA (B) score plots were generated for the 13C5-glutamine flux data showing the metabolic profile differences associated with c-Myc inhibition. Brown: PH-PAECs; Blue: c-Myc inhibition. Hierarchical clustering heat map of the 15 differential metabolites, with the degree of change marked with brown (up-regulation) and blue (down-regulation) with c-Myc inhibition (C). Schematic model of glutamine metabolism in 10058-F4 treated PH-PAECs with 13C Isotopologue concentrations of TCA cycle metabolites determined by GC-MS (D). The dark brown arrows indicate oxidative carboxylation flux from glutamine. The light brown arrows indicate reductive carboxylation. Dark brown circles represent 13C in the oxidative glutamine metabolism pathway. Light brown circles represent 13C in the reductive carboxylation pathway. Grey circles represent 12C carbon. The bar graphs show fractional enrichment from the 13C5-glutamine tracer generated by IsoCor software. The fractions of citrate containing four 13C carbons (E) or five 13C carbons (F) after culturing with 13C5-glutamine are shown. Western blot analysis confirmed that c-Myc inhibition decreased ASCT2 (G), GLS1 (H), GLS2 (I), GLUD (J), OGDH (K) IDH2 (L), and ACO2 (M) protein levels in PH-PAECs. Representative images are shown. β-actin was used to normalize loading. Data are mean ± SEM; All experiments were performed with at least four biological replicates.
Fig. 9
Fig. 9
Inhibition of c-Myc reverses the Warburg and hyperproliferative antiapoptotic phenotype in pulmonary hypertensive pulmonary arterial endothelial cells. PH-PAECs were treated or not with the c-Myc inhibitor (10058-F4, 20 μm, 16h). c-Myc inhibition significantly decreases mitochondrial ROS generation (C) and increases the mitochondrial membrane potential (B) in PH-PAECs. Inhibition of c-Myc reduced the extracellular acidification rate (ECAR) profile in PH-PAECs (C) such that basal glycolysis (D) and the reserve (E) and maximal (F) glycolytic capacity were all decreased. c-Myc inhibition also reduced the proliferation of PH-PAECs as determined by direct cell counting (G) and 5-bromo-2′-deoxyuridine (BrdU) incorporation (H). The levels of apoptosis induced by TNFα (2 ng/ml, 12h) detected by TUNEL staining was increased by c-Myc inhibition (I). Scale bars: 20 μm. Inhibition of c-Myc restores NO levels in PH-PAECs, as shown by increases in fluorescent intensity of the NO probe DAF-FM (J). Scale bars: 20 μm. Data are mean ± SEM; All experiments were performed with at least four biological replicates.
Fig. 10
Fig. 10
Inhibition of hypoxia-inducible factor 1α affects glycolysis and reverses the hyperproliferative antiapoptotic phenotype in pulmonary hypertensive pulmonary arterial endothelial cells. PH-PAECs were treated or not with a HIF-1α inhibitor (CAY10585, 10 μM, 24h). Inhibition of HIF-1α impacted the extracellular acidification rate (ECAR) profile in PH-PAECs (A) such that basal glycolysis was increased (B) while the reserve (C) and maximal (D) glycolytic capacity were decreased. HIF-1α inhibition reduced the proliferation of PH-PAECs as determined by direct cell counting (E) and 5-bromo-2′-deoxyuridine (BrdU) incorporation (F). The levels of apoptosis induced by TNFα (2 ng/ml, 12h) detected by TUNEL staining was increased by HIF-1α inhibition in PH-PAECs (G). Scale bars: 50 μm. Data are mean ± SEM; All experiments were performed with at least six biological replicates.
figs1
figs1
figs2
figs2
figs3
figs3
figs4
figs4

Similar articles

References

    1. Montani D., Günther S., Dorfmüller P., Perros F., Girerd B., Garcia G., et al. Pulmonary arterial hypertension. Orphanet J. Rare Dis. 2013;8:97. doi: 10.1186/1750-1172-8-97. - DOI - PMC - PubMed
    1. Heitzer T., Schlinzig T., Krohn K., Meinertz T., andMünzel T. Endothelial dysfunction, oxidative stress, and risk of cardiovascular events in patients with coronary artery disease. Circulation. 2001;104:2673–2678. doi: 10.1161/hc4601.099485. - DOI - PubMed
    1. Cella G., Bellotto F., Tona F., Sbarai A., Mazzaro G., Motta G., et al. Plasma markers of endothelial dysfunction in pulmonary hypertension. Chest. 2001;120:1226–1230. doi: 10.1378/chest.120.4.1226. - DOI - PubMed
    1. Hughes R., Tong J., Oates C., Lordan J., andCorris P.A. Evidence for systemic endothelial dysfunction in patients and first-order relatives with pulmonary arterial hypertension. Chest. 2005;128 doi: 10.1378/chest.128.6_suppl.617S. - DOI - PubMed
    1. Peled N., Bendayan D., Shitrit D., Fox B., Yehoshua L., andKramer M.R. Peripheral endothelial dysfunction in patients with pulmonary arterial hypertension. Respir. Med. 2008;102:1791–1796. doi: 10.1016/j.rmed.2008.06.014. - DOI - PubMed

LinkOut - more resources