

Network Pharmacology and In Vivo Evaluation of Lycium barbarum Polysaccharide in Preventing Perfluorooctanoic Acid-Induced Damage in Broilers
- PMID: 40680498
- PMCID: PMC12296465
- DOI: 10.1016/j.psj.2025.105522
Network Pharmacology and In Vivo Evaluation of Lycium barbarum Polysaccharide in Preventing Perfluorooctanoic Acid-Induced Damage in Broilers
Abstract
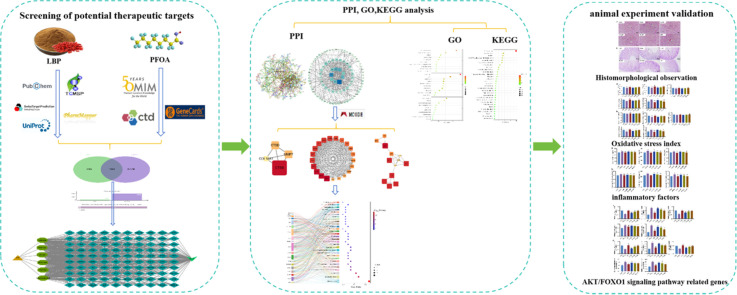
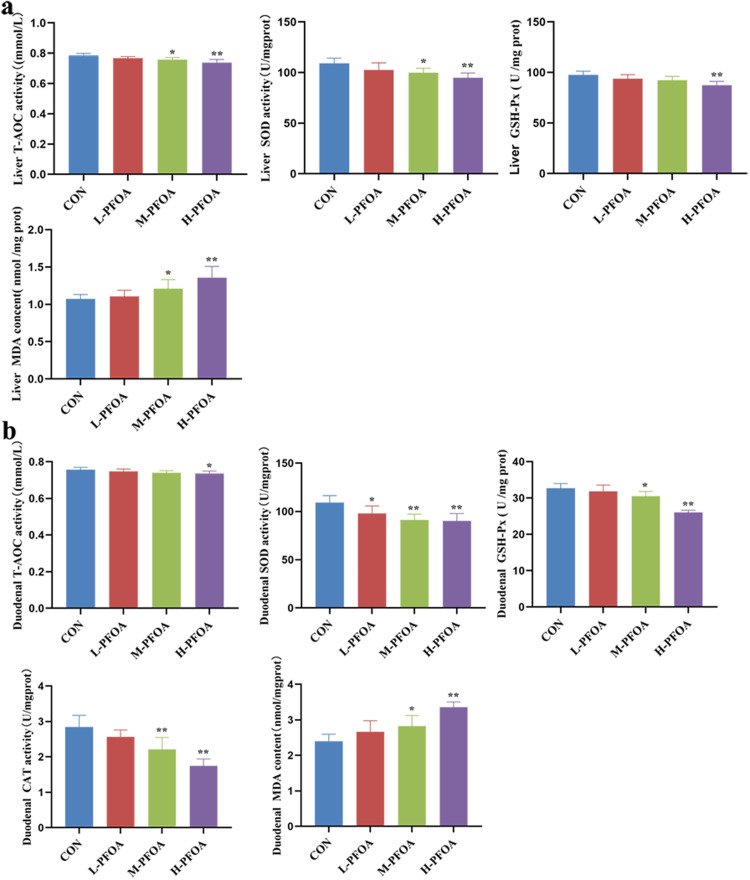
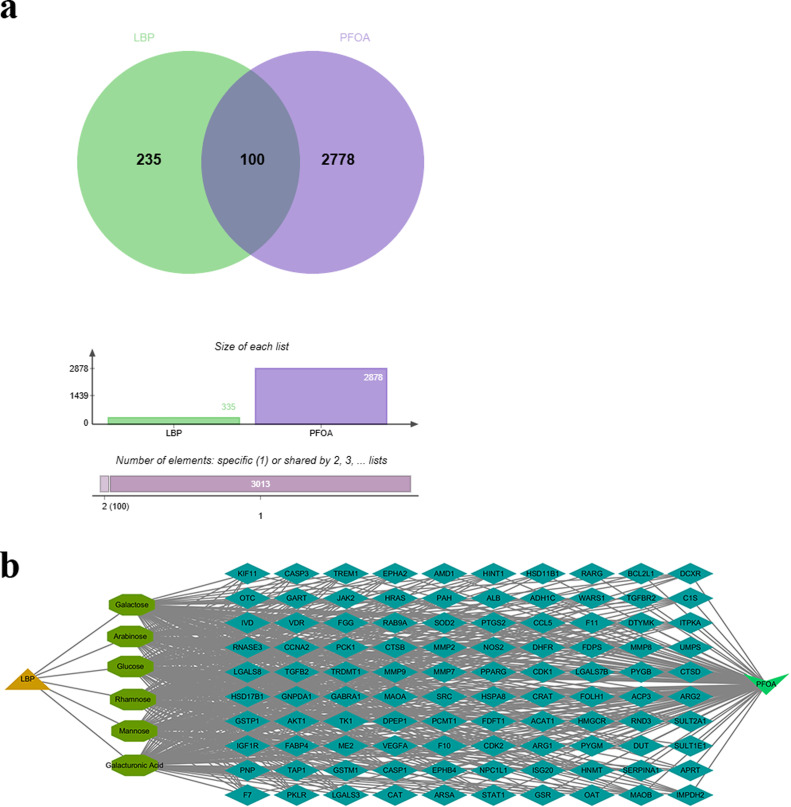
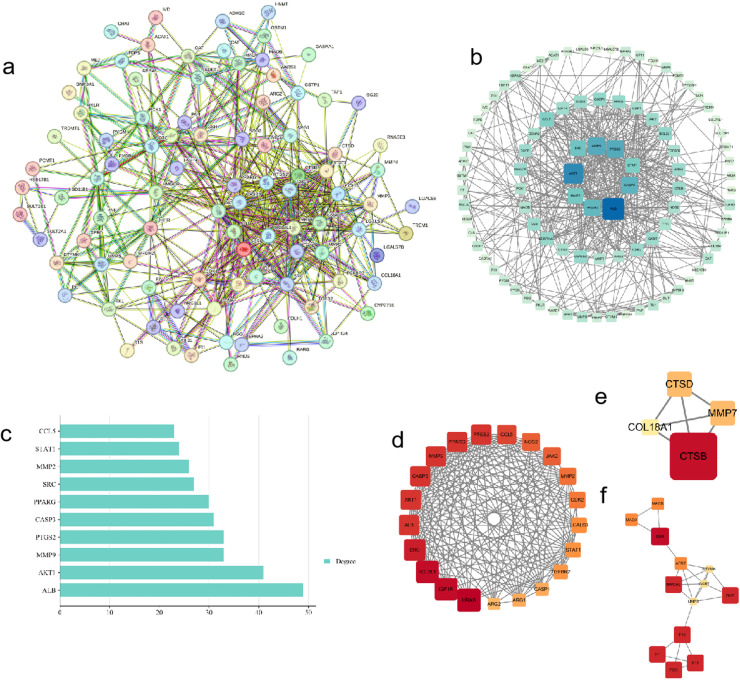
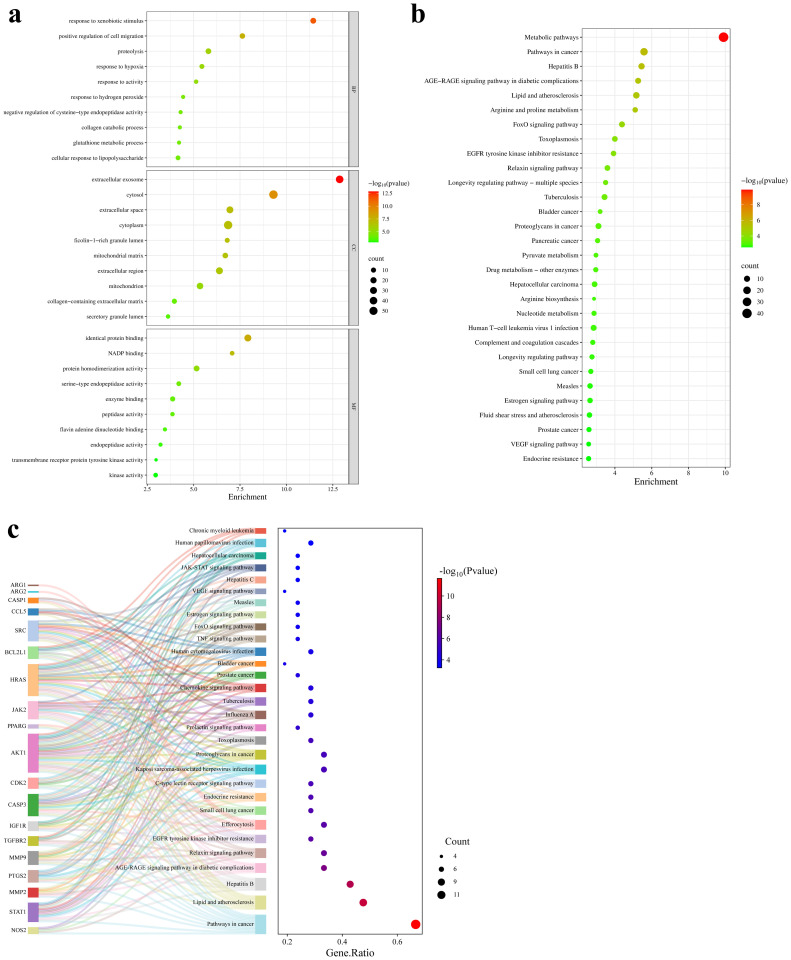
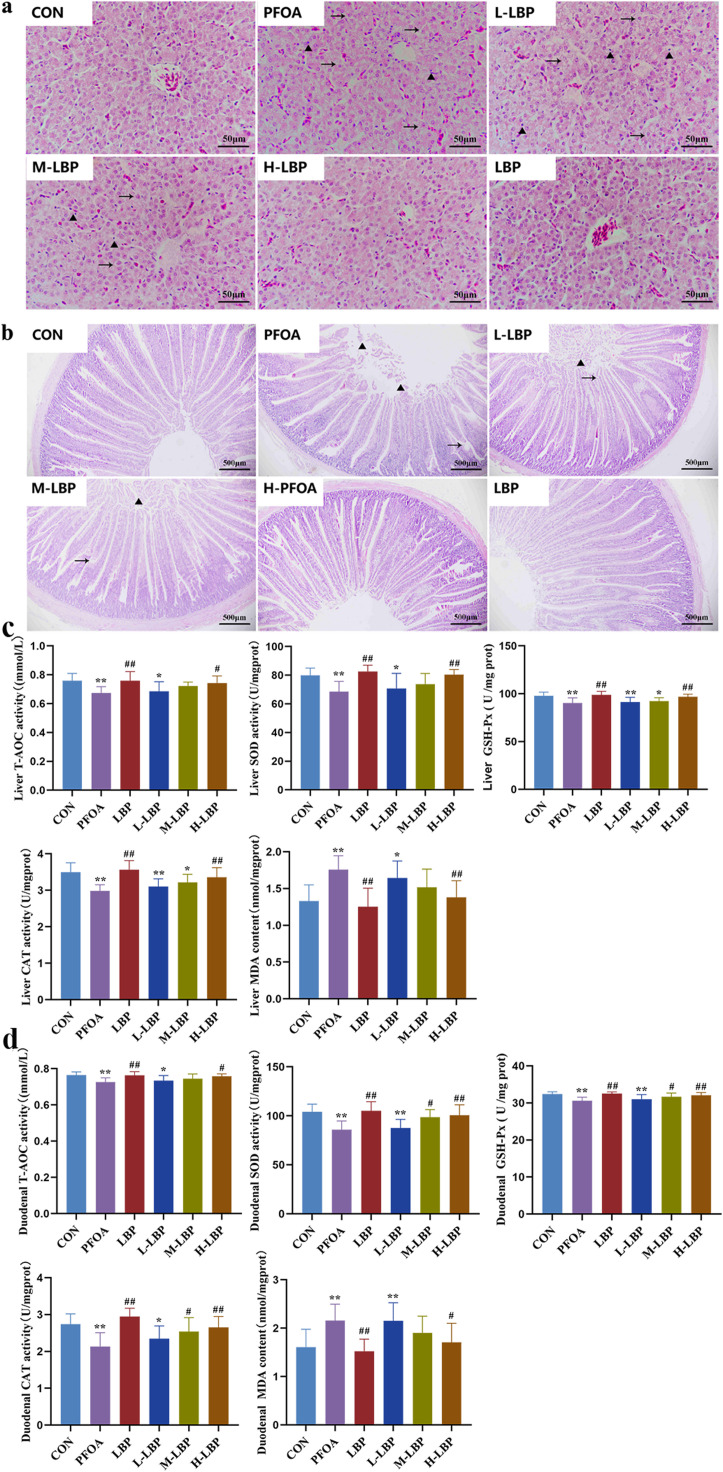
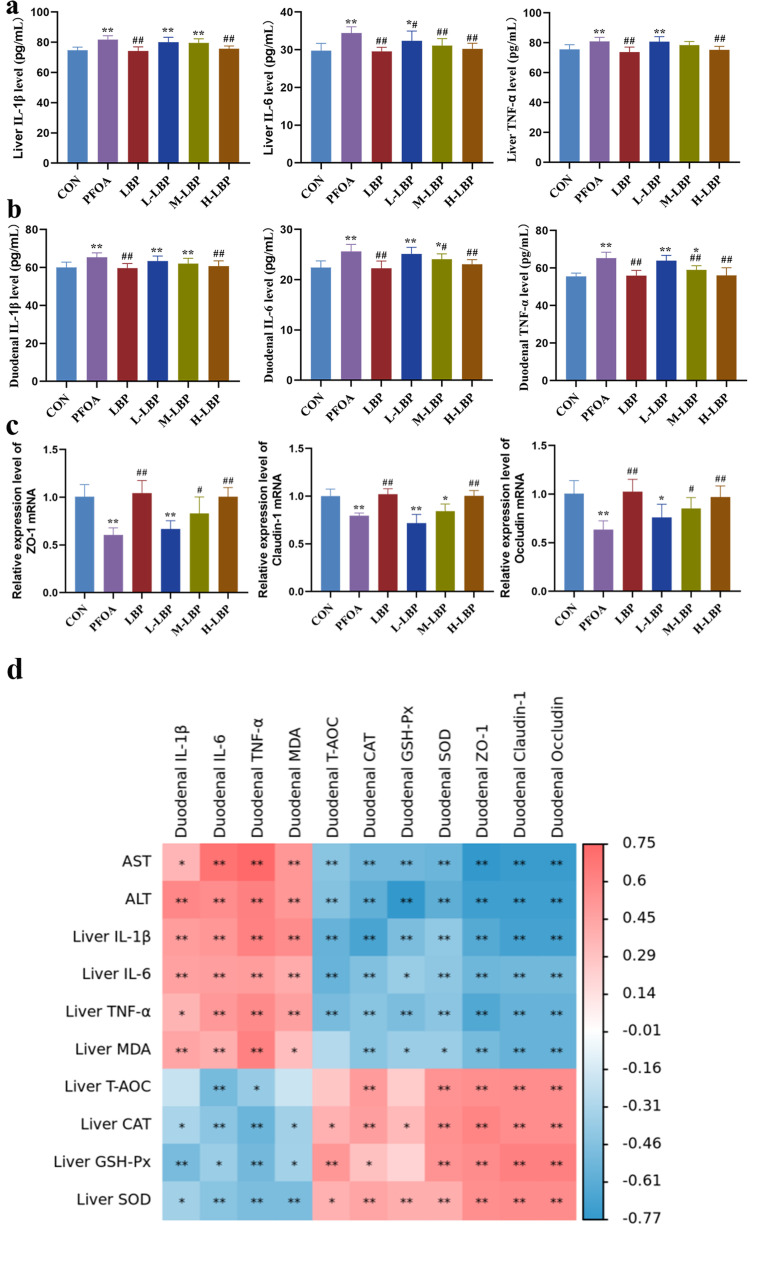
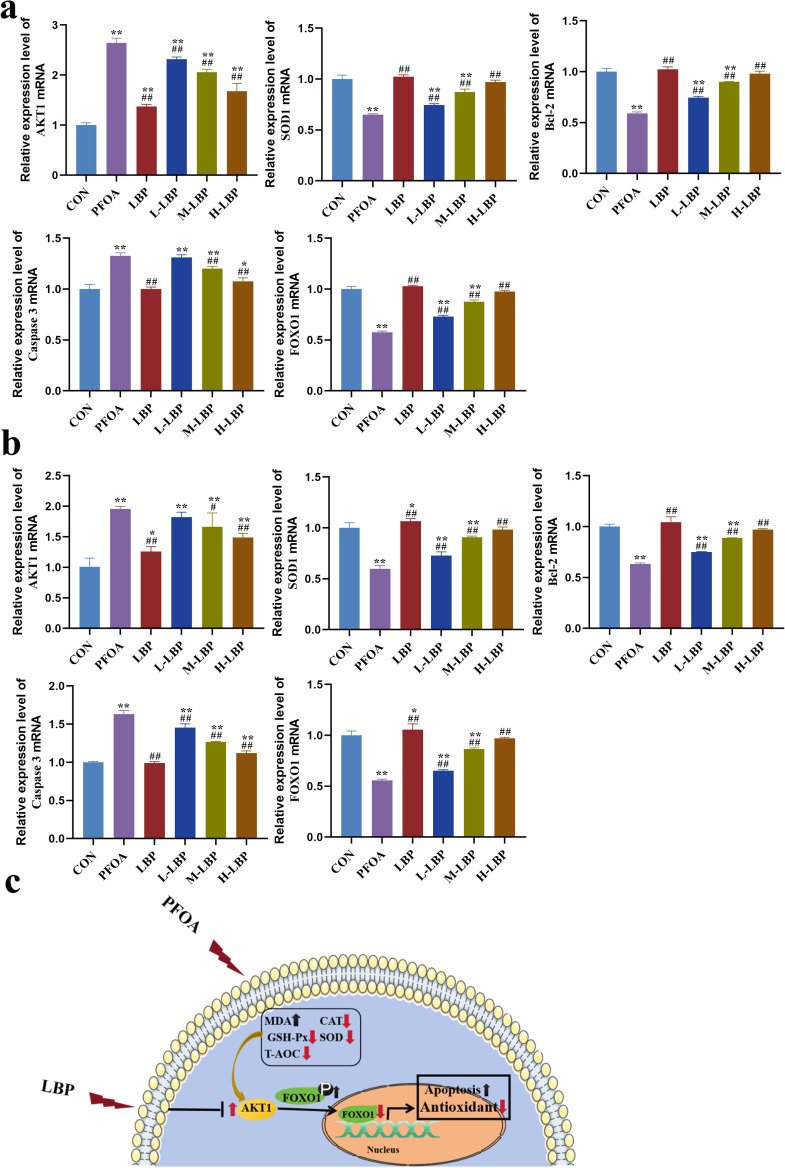
To examine the guarding effects of Lycium barbarum polysaccharides (LBP) on liver and gut injury induced by perfluorooctanoic acid (PFOA) in broilers. Initially, a dose selection experiment for PFOA modeling was conducted. A total of 160 one-day-old broilers were randomly assigned to four groups. The drinking water was supplemented with 0 mg/L PFOA (CON group), 0.5 mg/L PFOA (L-PFOA group), 1 mg/L PFOA (M-PFOA group), and 1.5 mg/L PFOA (H-PFOA group). The results indicated that compared to the CON group, the H-PFOA group showed significant increases liver function indicators, while antioxidant enzyme levels were significantly downregulated. Additionally, the H-PFOA group exhibited significant damage to the liver and intestinal tissue morphology. Subsequently, network pharmacology methods were employed to identify target protein information for LBP in preventing PFOA-induced damage. Protein-protein interaction analysis, GO functional annotation, and KEGG pathway enrichment analysis were performed. The network pharmacology results revealed a total of 100 key protein targets, with core targets mainly enriched in the AGE-RAGE and FOXO signaling pathways. Finally, animal experiments were conducted to verify. A total of 240 one-day-old broilers were randomly divided into six groups: CON group as blank control, PFOA group supplemented with 1.5 mg/L PFOA, l-LBP, M-LBP, and H-LBP groups further supplemented with 0.4 %, 0.6 %, and 0.8 % LBP respectively on a base of 1.5 mg/L PFOA, with LBP group as a control supplemented only with 0.8 % LBP in water. The results demonstrated that versus the CON group, the H-LBP group dropped considerably in daily weight gain, liver index, and pro-inflammatory cytokine levels, while antioxidant enzyme levels and intestinal tight junction protein mRNA expression were significantly upregulated. Moreover, the H-LBP group showed significant improvement in liver and intestinal tissue morphology. qPCR results revealed that PFOA exposure activated the AKT/FOXO1 signaling pathway, which was inhibited by LBP. In conclusion, LBP prevent PFOA-induced damage via a multi-component, multi-target, and multi-pathway mechanism.
Keywords: AKT/FOXO1 Pathway; Broiler; Lycium barbarum polysaccharide; Network pharmacology; Perfluorooctanoic acid.
Copyright © 2025. Published by Elsevier Inc.
Conflict of interest statement
Disclosures The authors declare that they have no known competing financial interests or personal relationships that could have appeared to influence the work reported in this paper.
Figures
Similar articles
-
Integrative multi-omics and bioinformatics analysis of the effects of BaiRui YuPingFeng Powder on intestinal health in broilers.Front Vet Sci. 2025 Jun 18;12:1606531. doi: 10.3389/fvets.2025.1606531. eCollection 2025. Front Vet Sci. 2025. PMID: 40607343 Free PMC article.
-
Dietary curcumin supplementation enhances growth performance and anti-inflammatory functions by modulating gut microbiota, microbiota-derived metabolites, and expression of inflammation-related genes in broilers.J Anim Sci. 2024 Jan 3;102:skae296. doi: 10.1093/jas/skae296. J Anim Sci. 2024. PMID: 39324614
-
Effect of Substituting Polyether Ionophore Anticoccidial Drugs With 1, 8-Cineole for the Control of Eimeria Infections in Broilers.Vet Med Sci. 2025 May;11(3):e70341. doi: 10.1002/vms3.70341. Vet Med Sci. 2025. PMID: 40285544 Free PMC article.
-
NTP Developmental and Reproductive Toxicity Technical Report on the Prenatal Development Studies of 2-((1-(4-Phenoxyphenoxy)propan-2-yl)oxy)pyridine (CASRN 95737-68-1) in Sprague Dawley (Hsd:Sprague Dawley® SD®) Rats and New Zealand White (Hra:NZW SPF) Rabbits: DART Report 07 [Internet].Research Triangle Park (NC): National Toxicology Program; 2022 Jan. Research Triangle Park (NC): National Toxicology Program; 2022 Jan. PMID: 35593777 Free Books & Documents. Review.
-
Sertindole for schizophrenia.Cochrane Database Syst Rev. 2005 Jul 20;2005(3):CD001715. doi: 10.1002/14651858.CD001715.pub2. Cochrane Database Syst Rev. 2005. PMID: 16034864 Free PMC article.
References
-
- Couto N., Wood J., Barber J. The role of glutathione reductase and related enzymes on cellular redox homoeostasis network. Free Radic Biol Med. 2016;95:27–42. - PubMed
LinkOut - more resources
Full Text Sources
Research Materials
Miscellaneous
