. 2025 Jul 18;16(1):6630.
doi: 10.1038/s41467-025-61052-1.

Synaptic enrichment of pSer129 alpha-synuclein correlates with dopaminergic denervation in early-stage Parkinson's disease

Affiliations

Synaptic enrichment of pSer129 alpha-synuclein correlates with dopaminergic denervation in early-stage Parkinson's disease

Irene Frigerio et al. Nat Commun. .

Abstract

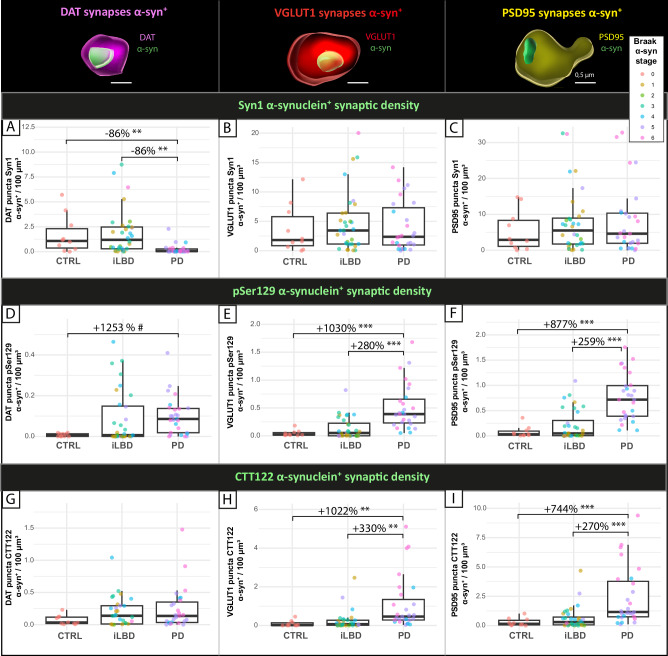
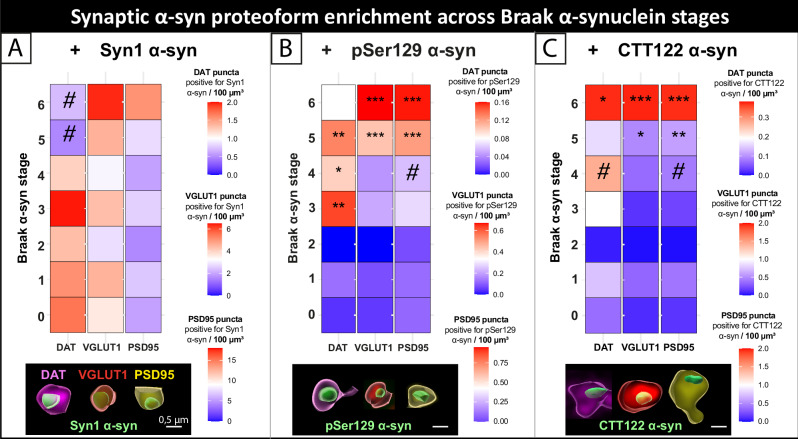
In Parkinson's disease (PD), α-synuclein aggregation in striatal synapses is hypothesised to trigger a cascade of events leading to synaptic loss and cortical Lewy body (LB) pathology. Using multiplex immunofluorescence and confocal microscopy on 69 brains spanning Braak stages 0-6-including controls, incidental LB disease (iLBD), and PD-we show that phosphorylated (pSer129) α-synuclein is enriched in putaminal dopaminergic synapses already in early disease stages, and associates with dopaminergic terminal loss. C-terminally truncated (CTT122) α-synuclein shows a similar trend in later stages. Enrichment of pSer129 and CTT122 α-synuclein in cortical glutamatergic synapses in the putamen occurs prior to LB appearance in cortical regions, supporting the theory of α-synuclein retrograde transport from synapse to cell body. Using AlphaLISA, we confirm that isolated PD putaminal synaptosomes contain higher pSer129 α-synuclein protein levels compared to controls. These findings suggest that synaptic enrichment of pSer129 α-synuclein occurs in early PD, possibly contributing to dopaminergic denervation and cortical LB pathology.


Conflict of interest statement

Competing interests: The authors I.F., M.L.M., A.B.W., D.T.V., J.J.P.B, W.A.B., B.L.G., I.L.C., A.J.J., H.W.B., L.E.J., and W.D.J.B. declare that they have no competing interests. D.M. and M.B. are full-time employees of Roche/F. Hoffmann-La Roche Ltd, and they may additionally hold Roche stock/stock options.

Figures

Fig. 1
Fig. 1. Putaminal DAT, VGLUT1 and PSD95 synaptic density in controls, iLBD, and PD.
A Representative image of DAT synaptic density in the putamen of control, iLBD (Braak stage 3), and PD (Braak stage 6) (case numbers 9, 30, and 65 in Supplementary Table 1, respectively). B Quantification of DAT synaptic density per group. C Quantification of DAT synaptic density per Braak α-synuclein stage. D, E Show representative images of VGLUT1 and PSD95 synaptic density, respectively, in the putamen of a control. F, G Show the quantification of VGLUT1 and PSD95 synaptic density per group. Data points are average per case (average of all 6 ROIs), are shape-coded for sex, and are colour-coded per Braak α-synuclein stage in (B, F, and G) and per group in (C). Boxplots display the median (central line), the first and third quartiles (box hinges at the 25th and 75th percentiles), and whiskers that extend to the most extreme data points within 1.5 times the interquartile range from the hinges. The sample consists of n = 69 (control = 10, iLBD = 32, PD = 27), and six technical replicates are averaged for each brain donor. The statistical test used is a two-sided LMM with age and sex as covariates, and nested for dataset and case ID. Multiple pairwise (post-hoc) and multiple testing comparison corrections were performed with the Tukey test. Exact p values: B control vs PD p < 0.001, iLBD vs PD p < 0.001, control vs iLBD p = 0.334; C control vs Braak 4 p < 0.001, control vs Braak 5 p < 0.001, control vs Braak 6 p < 0.001; F, G all p > 0.05. Source data are provided as a Source Data file. CTRL control, DAT dopaminergic transporter, iLBD incidental Lewy body disease, PD Parkinson’s disease, PSD95 post-synaptic density 95, VGLUT1 vesicular glutamatergic transporter 1, ns non-significant; p < 0.05*, p < 0.01**, p < 0.001***.
Fig. 2
Fig. 2. α-Synuclein proteoforms in putaminal DAT, VGLUT1 and PSD95 synapses in control, iLBD and PD.
A Syn1 α-synuclein+ DAT synaptic density was decreased specifically in the PD group, while Syn1 α-synuclein+. B VGLUT1 and C PSD95 synaptic density did not change between groups. pSer129 α-synuclein+ synaptic density tended to be higher in (D) DAT synapses, and it was higher in (E) VGLUT1, and F PSD95 synapses in PD. G CTT122 α-synuclein+ DAT synaptic density did not differ between groups, while CTT122 α-synuclein+, H VGLUT1, and I PSD95 synaptic density were higher in PD. Data points are average per case (average of all 6 ROIs), and are colour-coded per Braak α-synuclein stage. Boxplots display the median (central line), the first and third quartiles (box hinges at the 25th and 75th percentiles), and whiskers that extend to the most extreme data points within 1.5 times the interquartile range from the hinges. On top, a representative 3D surface-rendering image of DAT (magenta), VGLUT1 (red), and PSD95 (yellow) synapses positive for α-synuclein proteoforms (green) is shown (scale bar 0.5 µm). The sample consists of n = 69 (control = 10, iLBD = 32, PD = 27), and 6 technical replicates are averaged for each brain donor. The statistical test used is a two-sided LMM with age and sex as covariates, and nested for case ID. Multiple pairwise (post-hoc) and multiple testing comparison corrections were performed with the Tukey test. Exact p values: A control vs PD p = 0.008, iLBD vs PD p = 0.001, control vs iLBD p = 0.999; B, C: all p > 0.05; D: control vs PD p = 0.064, iLBD vs PD p = 0.909, control vs iLBD p = 0.159; E: control vs PD p < 0.001, iLBD vs PD p < 0.001, control vs iLBD p = 0.787; F control vs PD p < 0.001, iLBD vs PD p < 0.001, control vs iLBD p = 0.545; G: all p > 0.05; H: control vs PD p = 0.001, iLBD vs PD p = 0.003, control vs iLBD p = 0.584; I: control vs PD p < 0.001, iLBD vs PD p < 0.001, control vs iLBD p = 0.521. Source data are provided as a Source Data file. α-syn α-synuclein, CTRL control, DAT dopaminergic transporter, iLBD incidental Lewy body disease, PD Parkinson’s disease, PSD95 post-synaptic density 95, VGLUT1 vesicular glutamatergic transporter 1. 0.10 < p ≤ 0.05#, p < 0.05*, p < 0.01**, p < 0.001***.
Fig. 3
Fig. 3. Stage-dependent α-synuclein proteoform enrichment in putaminal DAT, VGLUT1 and PSD95 synapses across Braak α-synuclein stages.
A Syn1 α-synuclein, B pSer129 α-synuclein, and C) CTT122 α-synuclein enrichment in DAT, VGLUT1, and PSD95 synapses in the putamen across Braak α-synuclein stages (on y axis, 0 is controls) is shown. Heat maps are colour-coded for the average density of synapses positive for α-synuclein proteoforms per Braak stage (first averaged per case across all 6 ROIs, and then per Braak α-synuclein stage group), with values similar to zero in blue, high values in red, and mid values in white. Each heatmap column has its own legend, located on the right of the corresponding panel (e.g. the DAT column legend in the Syn1 panel is on the top right of the panel). Units in heatmap legends are expressed as the density of puncta positive for α-synuclein proteoforms per 100 µm³. Below each heat map column, a representative 3D surface-rendering image of DAT (magenta), VGLUT1 (red), and PSD95 (yellow) synapses positive for α-synuclein proteoforms (green) is shown (scale bar 0.5 µm). For all data points, see Supplementary Fig. 13. The Statistical test used is a two-sided LMM with age and sex as covariates, and nested for case ID. Multiple pairwise (post-hoc) and multiple testing comparison corrections were performed with the Tukey test. Exact p values: A DAT: control vs Braak 1–4 all p > 0.05, control vs Braak 5 p = 0.051, control vs Braak 6 p = 0.077; A VGLUT1 and PSD95: control vs Braak 1–6 all p > 0.05, B DAT: control vs Braak 1–2 all p > 0.05, control vs Braak 3 p = 0.007, control vs Braak 4 p = 0.036, control vs Braak 5 p = 0.006, control vs Braak 6 p = 0.121; B VGLUT1: control vs Braak 1–4 all p > 0.05, control vs Braak 5 p < 0.001, control vs Braak 6 p < 0.001; B PSD95: control vs Braak 1–3 all p > 0.05, control vs Braak 4 p = 0.098, control vs Braak 5 p < 0.001, control vs Braak 6 p < 0.001; C DAT: control vs Braak 1–3 and 5 all p > 0.05, control vs Braak 4 p = 0.061, control vs Braak 6 p = 0.012; C VGLUT1: control vs Braak 1–4 all p > 0.05, control vs Braak 5 p = 0.031, control vs Braak 6 p < 0.001; C PSD95: control vs Braak 1–3 all p > 0.05, control vs Braak 4 p = 0.061, control vs Braak 5 p = 0.004, control vs Braak 6 p < 0.001. Source data are provided as a Source Data file. α-syn α-synuclein, DAT dopaminergic transporter, PSD95 post-synaptic density 95, VGLUT1 vesicular glutamatergic transporter 1. 0.10 < p ≤ 0.05#, p < 0.05*, p < 0.01**, p < 0.001***.
Fig. 4
Fig. 4. Relationship between α-synuclein enrichment in dopaminergic terminals and dopaminergic synaptic loss.
A Syn1 α-synuclein, B pSer129 α-synuclein, and C CTT122 α-synuclein enrichment in DAT synapses is associated with DAT loss in the putamen across all cases. The top row shows a representative 3D surface-rendering image of DAT synapses (magenta) positive for α-synuclein proteoforms (green) (scale bar 0.5 µm). The middle row shows the correlation of A the density of Syn1 α-synuclein+ DAT synapses and DAT synaptic loss (data points are average per case across all 6 ROIs and colour-coded for Braak α-synuclein stage), B the percentage of DAT synapses positive for pSer129, and C CTT122 α-synuclein and DAT loss (data points are average per case across all 6 ROIs and colour-coded for group; black: regression line for all cases; red: regression line for iLBD cases; blue: regression line for PD cases; the grey area around the regression line represents the standard error). The bottom row shows the same correlation across Braak α-synuclein stages, where the grey line shows the mean DAT synaptic density (right y axis) and the magenta line the mean α-synuclein proteoform+ DAT synaptic density/percentage (left y axis) per Braak α-synuclein stage (x axis). The statistical test used is a two-sided Spearman’s correlation with age and sex as covariates. Multiple testing comparison corrections were performed with the Tukey test. Exact p values: A: all cases rho = 0.61, p < 0.001; B: all cases rho = −0.54, p < 0.001; iLBD rho = −0.51, p = 0.002; PD p = 0.905; C: all cases rho = −0.47, p < 0.001; iLBD rho = −0.31, p < 0.001; PD p = 0.493. Source data are provided as a Source Data file. α-syn α-synuclein, DAT dopaminergic transporter, iLBD incidental Lewy body disease, PD Parkinson’s disease, PSD95 post-synaptic density 95, VGLUT1 vesicular glutamatergic transporter 1. 0.10 < p ≤ 0.05#, p < 0.05*, p < 0.01**, p < 0.001***.
Fig. 5
Fig. 5. Relationship between pSer129 and CTT122 α-synuclein synaptic enrichment and LB density in anatomically connected regions.
The top row illustrates the relationship between synaptic terminals in the putamen and their projection neurons in the SN and cortex. AL illustrates the correlation of AF pSer129 and GL CTT122 α-synuclein positive synaptic terminals, and LB density in projection neurons in SN and cortex (data points in A, G are average per case across all six ROIs; data points in B, H are average per case across the four ROIs spanning the ACC innervation area of the putamen; data points in C and I are average per case across the two ROIs spanning the PFC innervation area of the putamen; all points are colour-coded for Braak α-synuclein stage; the grey area around the regression line represents the standard error). The grey line in DF and JL shows the mean LB density in the input region (right y axis), and the magenta (DAT) or red line (VGLUT1) shows the mean α-synuclein proteoform+ synaptic density in the putamen (left y axis) per Braak α-synuclein stage (x axis). Statistical test used in AC and GI is a two-sided Spearman’s correlation with age and sex as covariates. Exact p values: A: rho = 0.42, p < 0.001; B: rho = 0.71, p < 0.001; C: rho = 0.54, p < 0.001; G: rho = 0.35, p = 0.035; H: rho = 0.71, p < 0.001; I: rho = 0.74, p < 0.001. Statistical test used in E, F, K, and L is a two-sided LMM with age and sex as covariates, and nested for case ID, on the original log-transformed values that are scaled as a percentage (0–100%). Exact p values: E: Braak 3 p = 0.003, Braak 3 p = 0.035; F: Braak 3 p = 0.008, Braak 3 p = 0.002; K: Braak 3 p = 0.003, Braak 3 p > 0.05; L: Braak 3 p = 0.004, Braak 3 p > 0.05. Source data are provided as a Source Data file. Figure partially created in BioRender. Van de berg (2025) https://BioRender.com/duygz72. α-syn α-synuclein, ACC anterior cingulate cortex, DAT dopaminergic transporter, Lb Lewy body, PFC prefrontal cortex, PSD95 post-synaptic density 95, SN substantia nigra, VGLUT1 vesicular glutamatergic transporter 1. 0.10 < p ≤ 0.05#, p < 0.05*, p < 0.01**, p < 0.001***.
Fig. 6
Fig. 6. Methods workflow.
A ROIs were placed in whole-slide scans of FFPE striatal sections. We selected ROIs in ACC- and PFC-innervated areas of the putamen (asterisks). DAT+, VGLUT1+, and PSD95+ synaptic density were quantified within the putaminal ROIs. The middle panel shows 3D reconstructions of DAT+, VGLUT1+, and PSD95+ synapses positive for different α-synuclein proteoforms. The bottom panel illustrates the quantification of synaptic size and synaptic pairs (pre- and post-synapse next to each other). B Dopaminergic neuronal density (TH+) and LB density were quantified in SN. C LB density was assessed in ACC and PFC. D Synaptosomes were isolated from frozen putamen in a subset of donors. E Total, pSer129, and CTT122 α-synuclein levels were quantified in synaptosome fractions using AlphaLISA immunoassays. Figure partially created in BioRender. Van de berg (2025) https://BioRender.com/6sljtqz. α-syn α-synuclein, A coupled with acceptor bead, aa amino acids, ACC anterior cingulate cortex, CTT122 C-terminal truncated α-synuclein at amino acid 122, D coupled with donor bead, DAT dopamine transporter, GM grey matter, HB homogenization buffer, IHC immunohistochemistry, LB Lewy body, LH left hemisphere, PFC prefrontal cortex, PSD95 post-synaptic density 95, SN substantia nigra, pSer129 α-synuclein phosphorylated at Serine 129, Syn1 α-synuclein detected at amino acid 91–99, RH right hemisphere, Tyrosine hydroxylase TH, VGLUT1 vesicular glutamate transporter 1.
Fig. 7
Fig. 7. α-Synuclein proteoform levels in human putaminal synaptosomes.
A Group and Braak stage difference in total, pSer129, and CTT122 α-synuclein protein levels (over total protein) in putaminal synaptosomes. B Group and Braak stage difference in pSer129 and CTT122 fold change over total α-synuclein levels in iLBD and PD compared to control putaminal synaptosomes. Boxplots display the median (central line), the first and third quartiles (box hinges at the 25th and 75th percentiles), and whiskers that extend to minima and maxima. The statistical test used is a two-sided nonparametric rank-based estimation test with age and sex as covariates. Multiple testing comparison corrections were performed with the Tukey test. Exact p values: A tot α-syn (up): control vs PD p = 0.073, control vs iLBD p = 0.339; A tot α-syn (down): control vs Braak 1–6 all p > 0.05; pSer129 (up): control vs PD p = 0.043, control vs iLBD p = 0.392; pSer129 (down): control vs Braak 1–5 all p > 0.05, control vs Braak 6 p = 0.033; CTT122 (up): all p > 0.05; CTT122 (down): all p > 0.05; B pSer129 (up): control vs PD p = 0.137, control vs iLBD p = 0.179; pSer129 (down): control vs Braak 1–3 p = 0.817, control vs Braak 4 p = 0.095, control vs Braak 5 p = 0.090, control vs Braak 6 p = 0.035; CTT122 (up): control vs PD p = 0.178, control vs iLBD p = 0.530; CTT122 (down): control vs Braak 1–6 all p > 0.05. C, D Heatmap and scatterplot showing the correlation between pSer129 and CTT122 α-synuclein levels (over total protein) (C) and fold change over total α-synuclein levels in synaptosomes per case (labelled as in Supplementary Table 1) (D). The statistical test used is a two-sided Spearman’s correlation. Exact p values: C: rho = 0.88, p < 0.001; D: rho = 0.48, p = 0.004. The grey area around the regression line in C, D represents the standard error. The sample consists of n = 38 (control = 10, iLBD = 8, PD = 20), and three technical replicates are averaged for each brain donor. Source data are provided as a Source Data file. α-syn α-synuclein, n.a. not available (technical outliers), PTM post-translational modification, tot total. 0.10 < p ≤ 0.05#, p < 0.05*, p < 0.01**, p < 0.001***.

References

    1. Bloem, B. R., Okun, M. S. & Klein, C. Parkinson’s disease. Lancet397, 2284–2303 (2021). - PubMed
    1. Postuma, R. B. et al. MDS clinical diagnostic criteria for Parkinson’s disease. Mov. Disord.30, 1591–1601 (2015). - PubMed
    1. Poewe, W. et al. Parkinson disease. Nat. Rev. Dis. Prim.3, 1–21 (2017). - PubMed
    1. Dickson, D. W. et al. Evidence that incidental Lewy body disease is pre-symptomatic Parkinson’s disease. Acta Neuropathol.115, 437–444 (2008). - PubMed
    1. Parkkinen, L. et al. Disentangling the relationship between Lewy bodies and nigral neuronal loss in Parkinson’s disease. J. Parkinson’s Dis.1, 277–286 (2011). - PMC - PubMed

MeSH terms