. 2025 Jul 18;9(1):243.
doi: 10.1038/s41698-025-01027-z.

Integrative multi-omics and machine learning reveal critical functions of proliferating cells in prognosis and personalized treatment of lung adenocarcinoma

Affiliations

Integrative multi-omics and machine learning reveal critical functions of proliferating cells in prognosis and personalized treatment of lung adenocarcinoma

Shun Wang et al. NPJ Precis Oncol. .

Abstract

Lung adenocarcinoma (LUAD) is a major cause of cancer-related mortality globally. Proliferating cells, crucial components of the tumor immune microenvironment (TIME), play a significant role in cancer progression and immunotherapy response. Herein, we utilized multi-omics data and employed a multifaceted approach to delineate the proliferating cell landscape in LUAD. The Scissor algorithm was applied to identify Scissor+ proliferating cell genes associated with prognosis. An integrative machine learning program, comprising 111 algorithms, was developed to construct a Scissor+ proliferating cell risk score (SPRS). The SPRS model demonstrated superior performance in predicting prognosis and clinical outcomes compared to 30 previously published models. The role of SPRS and five pivotal genes in immunotherapy response was evaluated, and their expression was experimentally verified. Multifactorial analysis confirmed SPRS as an independent prognostic factor affecting LUAD patient survival. High- and low-SPRS groups exhibited different biological functions and immune cell infiltration in the TIME. High SPRS patients showed resistance to immunotherapy but increased sensitivity to chemotherapeutic and targeted therapeutic agents. Our study elucidates the dynamics of proliferating cells in LUAD, enhancing prognostic accuracy and highlighting the potential of SPRS and its constituent genes for personalized therapeutic interventions.


Conflict of interest statement

Competing interests: The authors declare no competing interests. Ethical statement: This study was reviewed and approved by the Ethics Committee of Shanghai Xuhui Central Hospital (Approval No.: 2022-021). Written informed consent was obtained from all participants prior to enrollment. All procedures strictly adhered to the principles of the Declaration of Helsinki and relevant national/international ethical guidelines.

Figures

Fig. 1
Fig. 1. Cell populations of 93 samples across the progression of lung disease.
a Schematic of the data generation, study design and the statistics of single-cell data from different datasets. b Uniform manifold approximation and projection (UMAP) analysis of all cells, colored by cell types. c UMAP plots showing expression of canonical marker genes of major cell populations. d The expression levels of representative signature genes. e Stacked barplot showing proportions of major cell populations across groups. Colors represent major cell populations. f Heatmap showing tissue preferences of major cell population in each groups revealed by Ro/e.
Fig. 2
Fig. 2. Characterization of proliferating cell subsets and their interactions in lung disease progression.
a UMAP plot of single-cell RNA sequencing data revealing distinct clusters of proliferating cells from various lung disease stages. Each point represents a cell, colored according to its cluster identity. b Heatmap displaying the expression of select marker genes characteristic of the annotated cell types within the identified clusters from the UMAP analysis. c Expression of significant markers and the enrichment of specific biological processes within each proliferating cell cluster. d, e SCTOUR algorithm depicts the development trajectory of various proliferating subtypes. f Intercellular communication analysis using CellChat, depicting signaling interactions among proliferating cell subsets. g Dot plot showing pair-ligands between C3_KRT8 and other subsets. h MIF signaling pathway network in proliferating cell subsets. i Spatial transcript analysis showing the joint density of various proliferating cell subsets.
Fig. 3
Fig. 3. Identification and prognostic significance of Scissor+ proliferating cell genes in LUAD.
a Distribution of Scissor-, Scissor + , and backgroud (BG) proliferating cell numbers in each cell types. b UMAP plots showing the distribution of proliferating cells in various Scissor groups. c The differentially expressed genes in Scissor- and Scissor+ proliferating cells. d, e Hallmark enrichment analysis of the upregulated genes in Scissor+ group. f Heatmap showing tissue preferences of proliferating cell subtypes in each Scissor groups revealed by Ro/e. g Kaplan–Meier survival curves for LUAD patients stratified by the enriched scores of various proliferating cell subtypes calculate by the single-sample gene set enrichment analysis (ssGSEA) based on their significant markers. h Heatmap showing potential ligands driving the phenotype of Scissor+ proliferating cells inferred by NichNet analysis. i Venn plot showing the intersection of the LUAD-upregulated genes and the Scissor+ proliferating cell-associated markers. LUAD lung adenocarcinoma.
Fig. 4
Fig. 4. Regulation mechanism of scissor+ proliferating cells and their cellular communication networks in LUAD.
a Heatmap displays the expression of IL1B and its receptors (IL1RL1, ADRB2, IL1R2, IL1R1) along with the IL1B ligand-receptor score (IL1BRCscore) and proliferation-related genes (CCND1, MKI67) across different proliferating cell subsets. b Meta-analysis of IL1B expression in LUAD cohorts. A forest plot summarizing the hazard ratios (HR) and 95% confidence intervals (CI) for IL1B expression across 16 LUAD cohorts. c Spatial colocalization analysis of IL1B and Scissor score in LUAD samples, supporting the hypothesis that IL1B regulates the phenotype of Scissor+ proliferating cells. d Schematic representation of cellular communication networks in LUAD. Scissor+ subsets predominantly function as signal senders, while immune cells (Mono/Mph), epithelial cells, and stromal cells (LAF and EC) act as signal receivers. e Interaction network highlighting frequent intercellular communication between Scissor+ subsets and other cell types within LUAD. f, g Analysis of the FN1-CD44 axis in cellular interactions. The FN1-CD44 axis was identified as a key mediator of interactions between Scissor+ subsets and other cells, with bidirectional signaling observed. h, i FN1 signaling pathway network illustrating the primary signal senders and receivers. LAF was identified as the main signal sender, while Scissor+ subsets predominantly functioned as receivers. j Heatmap showing the expression of FN1and CD44 in various cell types of lung diseases.
Fig. 5
Fig. 5. Development and validation of SPRS for LUAD.
a Through a comprehensive computational framework, a combination of 111 machine learning algorithms was generated. The C-index of each model was calculated through the TCGA-LUAD, GSE31210, GSE50081, GSE72094, and META-LUAD (batch effects-removed combination of GSE31210, GSE50081and GSE72094) cohorts and sorted by the average C-index of the validation set. b The hub gene selected through the LASSO regression. c The C-index of SPRS calculated by Lasso+SuperPC algorithm across each datasets. d The relation between SPRS calculated by Lasso+SuperPC combined model and outcome of patients in different cohorts. e 1-year AUC of Lasso+SuperPC combined model among different cohorts. f, g Meta-analysis of univariate Cox result of Lasso+SuperPC combined model among different cohorts. LUAD lung adenocarcinoma, SPRS Scissor+ proliferating cell risk score.
Fig. 6
Fig. 6. Comparison of SPRS with previously established models in LUAD.
a C-index of SPRS and 30 published models across the training and 4 testing datasets. b HR of SPRS and 30 published models across the training and 4 testing datasets. SPRS, Scissor+ proliferating cell risk score. c ROC curve of the established nomogram model based on the SPRS and relevant clinical parameters in the training and 4 testing datasets. LUAD, Lung Adenocarcinoma; ROC, Receiver operating characteristic; SPRS, Scissor+ proliferating cell risk score.
Fig. 7
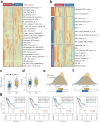
Fig. 7. Immune landscape and survival analysis based on SPRS in LUAD.
a The distribution of TME immune cell type signatures between high- and low-SPRS patients in LUAD. b The distribution of immune suppression, immune exclusion, and immunotherapy-related signatures between high- and low-SPRS patients in LUAD. c, d The distribution of TMB and TNB between high- and low-SPRS patients in LUAD. e, f The distribution of MDSC and CAF between high- and low-SPRS patients in LUAD. g Survival analysis combined SPRS with TMB, TNB, MDSC, and CAFs in LUAD patients. LUAD lung adenocarcinoma, SPRS Scissor+ proliferating cell risk score, CAFs cancer-associated fibroblasts, MDSCs myeloid-derived suppressor cells, TMB tumor mutational burden, TNB tumor neoantigen burden; *p < 0.05, **p < 0.01, ***p < 0.001, ns not significant.
Fig. 8
Fig. 8. Alteration landscape of SPRS model genes and their impact on LUAD progression.
a This diagram shows the copy number variation in the genomes of 516 samples from the TCGA-LUADproject. The x-axis in the figure marks the different chromosome numbers, and the y-axis represents the gistic score values. Red bars indicate a higher gistic score (increase in copy number), and cyan bars indicate a lower gistic score (decrease in copy number). b Mutation profile and frequencies of SPRS model genes in LUAD from the cBioPortal database. c Percentage of FGL, FGG, and FGA in FAM83A expression subsets for LUAD. d Correlation analysis of Gistic2 gene copy number variation score and FAM83A gene expression in LUAD scatter plot. Each point in the graph represents a sample, the x-axis represents the gene copy number score calculated by Gistic2, and the y-axis represents the corresponding gene expression. e Differential expression of FAM83A between various copy number type. f Correlation of FAM83A expression levels and specific genetic mutations in LUAD.The blue area at the top represents individual patient samples, and the y-axis represents the FAM83A expression level of the samples, arranged in reverse order. The red vertical line below represents the mutated gene, otherwise the wild type (gray). g The distribution of median, quartile and data is presented to explore the difference in the distribution of FAM83A gene expression in wild-type (blue) and mutant (red) KRAS cells. ***, p < 0.001. h Validation of the correlation between SPRS and TIME in LUAD patients without KRAS mutation in GSE72094 cohort. i The distribution of immunotherapy-related signatures between high- and low-SPRS patients in LUAD patients without KRAS mutation in GSE72094 cohort. j Scatter plot shows the correlation between SPRS levers and immune checkpoint molecules as well as the MDSC infiltration levers in LUAD patients without KRAS mutation in GSE72094 cohort. k Kaplan–Meier survival curves for patients with low and high SPRS in LUAD patients without KRAS mutation in GSE72094 cohort.
Fig. 9
Fig. 9. Spatial transcriptomics analysis of SPRS in LUAD.
a UMA plots showing spots from all sections, color-coded according to their sample source. b Signature-based strategy to assessthe enrichment of various cell types within each spot. c Comparisons of SPRS positive cell ratios between cancer and noncanceroustissues. d Expression of the five SPRS model genes and SPRS score in each spot across samples. LUAD lung adenocarcinoma, SPRS scissor+ proliferating cell risk score, UMAP uniform manifold approximation and projection.
Fig. 10
Fig. 10. Analysis of SPRS in LUAD and its implications for immunotherapy and chemotherapy response.
a Kaplan–Meier survival curves for patients with low and high SPRS from the IMvigor210 cohort, demonstrating differential survival probabilities. b Graphical representation of patient responses to immunotherapy, categorized by SPRS levels, with statistical significance indicated. c, d Comparative survival analysis from two independent cohorts (GSE91061 and GSE78220) showing the association between SPRS levels and survival outcomes. e GSEA plot showing the enrichment of cell cycle-related pathways in high SPRS LUAD samples. f Correlations between SPRS/model genes and IC50 of specific drugs from GDSC database. Red and blue dots indicate positive and negative correlations, respectively. g Ridge plot depicting the distribution of AUC values for various drugs, suggesting a link between SPRS and drug sensitivity. h Cellular localization of PRC1 protein in A-431 and U2OS from the HPA database. i Relative protein levels of PRC1 in LUAD tissue compared to a normal tissue, as determined by the HPA database. j Relative mRNA expression levels of five SPRS model genes in LUAD tissues compared to normal tissues, as determined by RT-qPCR. LUAD, Lung Adenocarcinoma; SPRS, Scissor+ proliferating cell risk score.
Fig. 11
Fig. 11. Multi-omics characterization of proliferating cell dynamics and their clinical implications in LUAD.
a Cohort composition and staging distribution of the integrated LUAD dataset (n = 73 patients: 32 Stage I, 5 Stage II, 8 Stage III, 28 Stage IV). b Uniform Manifold Approximation and Projection (UMAP) of 259,254 high-quality single-cell profiles from LUAD patients, annotated into 15 distinct cell subpopulations based on canonical marker genes. c Stratification of cells into SPRS_high and SPRS_low groups based on median AddModuleScore values. d Tissue preference analysis (Ro/e algorithm) revealing stage-dependent enrichment of proliferating cells in advanced LUAD (Stages II–IV) as well as relative abundance of macrophages, cancer-associated fibroblasts (CAFs), and proliferating cells in SPRS_high tumors. e Forest plot of meta-analysis (14 datasets, n = 2491 patients) demonstrating consistent association between proliferating cell marker expression and poor prognosis. f Spatial transcriptomics (ST) tissue preference of various samples in SPRS_high and SPRS_low tumors highlighted. g CellTrek-based deconvolution of ST spots. h Quantification of cell-type proportions in SPRS_high versus SPRS_low tumors, confirming immunosuppressive microenvironment features (elevated CAFs, reduced CD8 + T cells) observed in single-cell data.

References

    1. Siegel, R. L., Miller, K. D., Wagle, N. S. & Jemal, A. Cancer statistics, 2023. Ca Cancer J. Clin.73, 17–48 (2023). - PubMed
    1. Herbst, R. S., Morgensztern, D. & Boshoff, C. The biology and management of non-small cell lung cancer. Nature553, 446–454 (2018). - PubMed
    1. Lee, J. W. et al. The combination of MEK inhibitor with immunomodulatory antibodies targeting programmed death 1 and programmed death ligand 1 results in prolonged survival in KRAS/p53-driven lung cancer. J. Thorac. Oncol.14, 1046–1060 (2019). - PMC - PubMed
    1. Shiraishi, Y., Sekino, Y., Horinouchi, H., Ohe, Y. & Okamoto, I. High incidence of cytokine release syndrome in patients with advanced NSCLC treated with nivolumab plus ipilimumab. Ann. Oncol.34, 1064–1065 (2023). - PubMed
    1. Topalian, S. L. et al. Five-year survival and correlates among patients with advanced melanoma, renal cell carcinoma, or non-small cell lung cancer treated with nivolumab. Jama Oncol.5, 1411–1420 (2019). - PMC - PubMed

LinkOut - more resources