. 2025 Aug;26(16):4153-4179.
doi: 10.1038/s44319-025-00516-3. Epub 2025 Jul 18.

Immune aging impairs muscle regeneration via macrophage-derived anti-oxidant selenoprotein P

Affiliations

Immune aging impairs muscle regeneration via macrophage-derived anti-oxidant selenoprotein P

Dieu-Huong Hoang et al. EMBO Rep. 2025 Aug.

Abstract

Muscle regeneration is impaired with aging, due to both intrinsic defects of muscle stem cells (MuSCs) and alterations of their niche. Here, we monitor the cells constituting the MuSC niche over time in young and old regenerating mouse muscle. Aging alters the expansion of all niche cells, with prominent phenotypes in macrophages that show impaired resolution of inflammation. RNA sequencing of FACS-isolated mononucleated cells uncovers specific profiles and kinetics of genes and molecular pathways in old versus young muscle cells, indicating that each cell type responds to aging in a specific manner. Moreover, we show that macrophages have an altered expression of Selenoprotein P (Sepp1). Macrophage-specific deletion of Sepp1 is sufficient to impair the acquisition of their restorative profile and causes inefficient skeletal muscle regeneration. When transplanted in aged mice, bone marrow from young WT mice, but not Sepp1-KOs, restores muscle regeneration. This work provides a unique resource to study MuSC niche aging, reveals that niche cell aging is asynchronous and establishes the antioxidant Selenoprotein P as a driver of age-related decline of muscle regeneration.

Keywords: Aging; Macrophages; Selenoprotein P; Skeletal Muscle Regeneration.


Conflict of interest statement

Disclosure and competing interests statement. DHH, JB, JG, PM, AG, OM, GJ, SL, RM, FLG, and BC declare no competing interests. EM, PS, and JNF are employees of Société des Produits Nestlé SA.

Figures
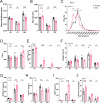
Figure 1
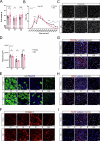
Figure 1. Histological analysis of regenerating young and old muscle.
Tibialis Anterior muscles from young (10 weeks old) and old (24 months old) mice were injected or not with cardiotoxin and were harvested 2, 4, 7, and 28 days after the injury. (A) The muscle mass (mg) was normalized to the body weight (mg) (n = 3–9). A two-way ANOVA test was performed, followed by multiple comparisons using Šidák test. (BI) The muscle sections were immunostained for various proteins. (BD) From laminin immunostaining, the mean cross-section myofiber area (B), cross-section myofiber area distribution at day 7 after injury (C), and the total number of myofibers per muscle section (D) were measured (n = 4–6). A two-way ANOVA test was performed, followed by multiple comparisons using Šidák test. (E) From IgG immunostaining, the proportion of positive myofibers, indicative of necrotic myofibers, was quantified as a percent of total myofibers (n = 3–5). A two-way ANOVA test was performed, followed by multiple comparisons using Šidák test. (F) From Collagen I immunostaining, the fibrosis area was quantified as a percentage of the total field. (n = 3–11). The two-way ANOVA test was nonsignificant. Multiple unpaired t tests were performed, and the P values are given for each day. (G) From PDGFRα immunostaining, Fibro-Adipogenoc Progenitor (FAP) number was quantified (n = 4–6). A two-way ANOVA test was performed, followed by multiple comparisons using Šidák test. (H) From CD31 immunostaining, the number of endothelial cells was quantified (n = 4–6). A two-way ANOVA test was performed, followed by multiple comparisons using Šidák test. (I) From F4/80 immunostaining, macrophage numbers were quantified (n = 3–6). A two-way ANOVA test was performed, followed by multiple comparisons using Šidák test. (J) The number of Ly6Cpos inflammatory macrophages was quantified by flow cytometry as a percentage of CD45pos immune cells (n = 5). A two-way ANOVA test was performed, followed by multiple comparisons using Šidák test. Data information: Values are given as mean ± SEM. Each dot represents one mouse. The result of the two-way ANOVA test is shown for each graph as *P < 0.05; **P < 0.01; ***P < 0.001; ****P < 0.0001. Source data are available online for this figure.
Figure 2
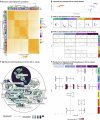
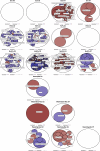
Figure 2. Principal component analysis and enriched signaling pathways in old versus young mononucleated cells.
(A) Heatmap of Spearman’s correlation coefficients for individual sample replicates isolated from age, time post injury and cell type. Correlation was computed on normalized counts after the preliminary filter. (B) Principal component analysis (PCA) of all 105 replicates based on vst. Principal component (PC) 1 splits the samples in immune cells of other cells and component 2 splits Endothelial cells (ECs), Fibro-Adipogenic Progenitors (FAPs), and Muscle Stem Cells (MuSCs). (C) For each cell type, PCA was done on their replicates. PC1 and 2 split samples by time post injury. (D) For each cell type and time post injury, PCA was done on these replicates: PC1 and 2 split samples by age. (E, F) Presentation of significantly (Padj <= 0.05) enriched Reactome pathways (with the GSEA method) with age. (E) A hierarchical overview of Reactome pathways is presented, each label corresponds to one of the 25 top-level pathways, and the label size is scaled based on the number of pathways contained in their pathways’ sons. Each circle corresponds to a pathway, and its color represents the number of celltype_day where this pathway was enriched. (F) Violin plots explore the number of enriched pathways (colored points) and their log2 fold change in x axis for each cell type, day_post_injury young vs old samples.
Figure 3
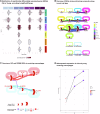
Figure 3. Differentially expressed genes (DEG) in old versus young mononucleated cells.
(A) Violin plots explore the number of DEGs, each color point is a DEG (i.e., 1905 DEG in D2 MuSCs) and their log2foldchange in x axis for each cell type, day_post_injury young vs. Old samples. (B) DEG proportion at one day (loops) or on several consecutive days (lines) to analyze if ageing impacts on gene expression in one cell type specifically at one or several time points during muscle regeneration. The thickness of the loops and the lines correlate with the number of DEGs. (C) DEG cycle and flow in resolving macrophages during regeneration with segregation of upregulated genes (reddish colors) and downregulated genes (blueish colors). Note the purple flow showing one gene upregulated at D2 then downregulated at D4 and D8. (D) Zoom expression of Sepp1 transcript in resolving macrophages at D2, 4, and 8 after injury.
Figure 4
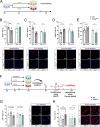
Figure 4. Effect of the loss of Sepp1 on macrophage phenotype and functions in vitro.
(AE) Wild-type (WT) or Sepp1KO bone marrow-derived macrophages (BMDMs) were polarized into pro-inflammatory and anti-inflammatory macrophages with IFNγ and IL10, respectively, and were analyzed for their inflammatory status by immunofluorescence. The number of cells expressing the pro-inflammatory markers iNOS (B) (n = 5–8), CCL3 (C) (n = 3–8) and the anti-inflammatory markers CD206 (D) (n = 4–8) and CD163 (E) (n = 3–7) was counted. A two-way ANOVA test was performed, followed by multiple comparisons using Šidák test. Bars = 40 μm. (FH) WT or Sepp1KO BMDMs were polarized as in (A) or left untreated (Unt.), and conditioned medium was collected and transferred onto Muscle Stem Cells (MuSCs) to evaluate their proliferation (G) (n = 4) and their myogenesis (H) (n = 5). A two-way ANOVA test was performed, followed by multiple comparisons using Šidák test. (H) Arrowheads show myonuclei within myotubes (one color for one myotube). Bars = 40 μm. Data information: values are given as mean ± SEM. Each dot represents one BMDM culture derived from one mouse. The result of the ANOVA test is shown for each graph as *P < 0.05; **P > 0.01; ****P < 0.0001. Source data are available online for this figure.
Figure 5
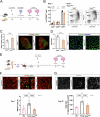
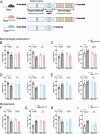
Figure 5. Effect of the loss of Sepp1 in macrophages on skeletal muscle regeneration in vivo.
(AD) Tibialis Anterior (TA) muscles from Wild-type (WT) and Sepp1ΔMac mice were injected with cardiotoxin and were harvested 3, 7, and 28 days after the injury. (B) The number of Ly6Cpos, Ly6Cint and Ly6Cneg macrophages was quantified by flow cytometry at day 3 as a percentage of total CD64pos macrophages (n = 6–8). Representative dot plots are shown. A two-way ANOVA test was performed, followed by multiple comparisons using Šidák test. (C) The number of fibers expressing the embryonic myosin heavy chain (eMHC) was counted at day 7 after the injury, as a percentage of the total number of myofibers per muscle section (n = 5–6). Student T test was performed. Bars = 500 μm. (D) The number of myonuclei present inside myofibers was counted after laminin staining at day 28 after the injury (n = 4–5). Student T test was performed. Bars = 40 μm. (EG) Old WT mice were irradiated and bone marrow transplanted with bone marrow from either young, old or Sepp1ΔMac mice and TA muscles were injected with cardiotoxin one month later and were harvested 7 and 28 days after the injury. (F) The area of fibers expressing eMHC was evaluated at day 7 as a percentage of the total damaged/regenerating area (n = 6–10). A one-way ANOVA test was performed, followed by multiple comparisons using the Tukey test. Bars = 80 μm. The middle panel is a section of the image shown in Fig. EV5J. (G) The area of myofibers present in regenerating areas was evaluated at day 28. One-way ANOVA test was performed, followed by multiple comparisons using the Tukey test. Bars = 80 μm. Data information: Values are given as mean ± SEM. Each dot represents one TA muscle. The result of the ANOVA test is shown for each graph as *P < 0.05; ****P < 0.0001. Source data are available online for this figure.
Figure EV1
Figure EV1. Histological analysis of regenerating young and old muscle.
Tibialis Anterior muscles from young (10 weeks old) and old (24 months old) mice were injected or not with cardiotoxin and were harvested 2, 4, 7 and 28 days after injury. (A) Mouse body weight was quantified (n = 3–9). Two-way ANOVA test was non significant. Multiple unpaired t tests were performed and the P values are given for each day. (BI) The muscle sections were immunostained for various proteins. From laminin immunostaining, the cross-section myofiber area distribution at day 28 after injury (B) (n = 6), and the total muscle area (C) (n = 4–6) were measured. Two-way ANOVA test was performed followed by multiple comparisons using Šidák test. (B) Multiple unpaired t tests were additionally performed and the P values are shown in blue. Representative pictures of immunostainings for Laminin (C) (bars = 80 μm), IgGs (E) (bars = 50 μm), PDGFRα (F) (bars = 50 μm), Collagen I (G) (bars = 40 μm), CD31 (H) (bars = 40 μm), and F4/80 (I) (bars = 40 μm). Data information: Values are given as mean ± SEM. Each dot represents one mouse. Result of the two-way ANOVA test is shown for each graph as *P < 0.05; ****P < 0.0001.
Figure EV2
Figure EV2. Enriched signaling pathways in old versus young mononucleated cells.
Hierarchical overview of Reactome pathway is presented, pathway labels correspond to 25 headers of the hierarchical levels, and the size is scaled based on the number of enriched pathways found in their respective sons. Each circle corresponds to a pathway and its color is the NES.
Figure EV3
Figure EV3. Differentially expressed genes (DEG) in old versus young mononucleated cells.
Volcano plot showing log2 fold change (RNAseq) for old versus young samples plotted against the –log10 adjusted P value (FDR = 0.05) as determined by DESeq2. Significantly differentially expressed genes (DEG) for the Old vs Young contrast were selected by fixing a Benjamini–Hochberg corrected p-value threshold of 0.05 (padj < = 0.05) (n = 3).
Figure EV4
Figure EV4. Effect of the loss of redox-activity and selenium transport in Sepp1 on macrophage phenotype and functions in vitro.
(A) Schematic representing Sepp1 structure and the mouse models having mutation impairing either the redox function (SeppU40S/U40S), or the selenium transport function (SeppΔ240-361). (BE) Wild-type (WT), SeppU40S/U40S and SeppΔ240-361 bone marrow-derived macrophages (BMDMs) were polarized into pro-inflammatory and anti-inflammatory macrophages with IFNγ and IL10, respectively and analyzed for their inflammatory status by immunofluorescence. The number of SeppU40S/U40S BMDMs expressing the pro-inflammatory markers iNOS (n = 6–8) and CCL3 (n = 5–8) (B) and the anti-inflammatory markers CD206 (n = 7–8) and CD163 (n = 4–7) (C) was counted. The number of SeppΔ240-361 BMDMs expressing the pro-inflammatory markers iNOS (n = 4–8) and CCL3 (n = 4–8) (D) and the anti-inflammatory markers CD206 (n = 5–8) and CD163 (n = 4–7) (E) was counted. (F–I) WT and SeppU40S/U40S BMDMs were polarized as above and conditioned medium was collected and transferred onto Muscle Stem cells (MuSCs) to evaluate their proliferation (F) (n = 4–5) and their myogenesis (G) (n = 5–6). (FI) WT and SeppΔ240-361 BMDMs were polarized as above and conditioned medium was collected and transferred onto MuSC) to evaluate their proliferation (H) (n = 4–5) and their myogenesis (I) (n = 5–6). Data information: Values are given as mean ± SEM. Each dot represents one experiment using primary cells issued from one animal. Two-way ANOVA test was performed followed by multiple comparisons using Šidák test. Result of the two-way ANOVA test is shown for each graph as *P < 0.05; **P < 0.01; ***P < 0.001; ****P < 0.0001.
Figure EV5
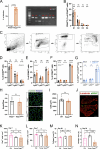
Figure EV5. Effect of the loss of Sepp1 in macrophages on skeletal muscle regeneration in vivo.
(A) Evaluation of the depletion of Sepp1 gene in CD11bpos bone marrow cells of Sepp1ΔMac mice (n = 4–9). Student t test was performed. (BF) Tibialis Anterior (TA) muscles from Wild-type (WT) and Sepp1ΔMac mice were injected with cardiotoxin and were harvested 1, 2, 3, 4 days after the injury. (B) The number of CD45pos CD64neg cells (neutrophils) was quantified by flow cytometry as a percentage of total CD45pos immune cells (n = 6–8). Two-way ANOVA test was performed followed by multiple comparisons using Šidák test. (C) Gating strategy for the analysis of macrophage subsets by flow cytometry. (DF) The number of Ly6Cpos, Ly6Cint and Ly6Cneg macrophages was quantified by flow cytometry at day 1 (D), 2 (E) and 4 (F) as a percentage of total CD64pos macrophages (n = 6). Two-way ANOVA test was performed followed by multiple comparisons using Šidák test. (G) LysMCre+/+ and control (LysM+/+) mice were analyzed for the populations of macrophages at day 3 after injury (n = 5–6). Two-way ANOVA test was performed followed by multiple comparisons using Šidák test. (H) Uninjured WT and Sepp1ΔMac TA muscles were analyzed for the number of nuclei per myofiber (n = 5–6). Student T test was performed. Bars = 40 μm. (I) Injured WT and Sepp1ΔMac TA muscles were analyzed for the size of the regenerating myofibers (CSA) 28 days after injury (n = 4–5). Student T test was performed. (J) View of a total muscle section of an old mouse transplanted with young bone marrow, 7 days post injury, embryonic myosin heavy chain (eMHC) is labeled in green (a part of that picture is shown in Fig. 5F, middle panel). Bar = 500 μm. (KN) Old WT mice were irradiated and bone marrow transplanted with bone marrow from either young, old or Sepp1ΔMac mice and TA muscles were injected with cardiotoxin one month later and were harvested 7 and 28 days after the injury (n = 3). The number of Pax7pos (K) and PDGFRα (L) was counted at day 7; the area covered by collagen I (M) and perilipin (N) was quantified at day 28 after injury. One-way ANOVA test was performed followed by multiple comparisons using Tukey test. Data information: Values are given as mean ± SEM. Each dot represents one mouse. Result of the two-way ANOVA test is shown for each graph as *P < 0.05; ****P < 0.0001.

References

    1. Arnold L, Henry A, Poron F, Baba-Amer Y, van Rooijen N, Plonquet A, Gherardi RK, Chazaud B (2007) Inflammatory monocytes recruited after skeletal muscle injury switch into antiinflammatory macrophages to support myogenesis. J Exp Med 204:1071–1081 - PMC - PubMed
    1. Bernet JD, Doles JD, Hall JK, Kelly Tanaka K, Carter TA, Olwin BB (2014) p38 MAPK signaling underlies a cell-autonomous loss of stem cell self-renewal in skeletal muscle of aged mice. Nat Med 20:265–271 - PMC - PubMed
    1. Burk RF, Hill KE (2009) Selenoprotein P-expression, functions, and roles in mammals. Biochim Biophys Acta 1790:1441–1447 - PMC - PubMed
    1. Burk RF, Hill KE, Motley AK (2003) Selenoprotein metabolism and function: evidence for more than one function for selenoprotein P. J Nutr 133:1517s–1520s - PubMed
    1. Christov C, Chretien F, Abou-Khalil R, Bassez G, Vallet G, Authier FJ, Bassaglia Y, Shinin V, Tajbakhsh S, Chazaud B et al (2007) Muscle satellite cells and endothelial cells: close neighbors and privileged partners. Mol Biol Cell 18:1397–1409 - PMC - PubMed