. 2025 Sep;44(17):4720-4744.
doi: 10.1038/s44318-025-00510-4. Epub 2025 Jul 18.

Parp7 generates an ADP-ribosyl degron that controls negative feedback of androgen signaling

Affiliations

Parp7 generates an ADP-ribosyl degron that controls negative feedback of androgen signaling

Krzysztof Wierbiłowicz et al. EMBO J. 2025 Sep.

Abstract

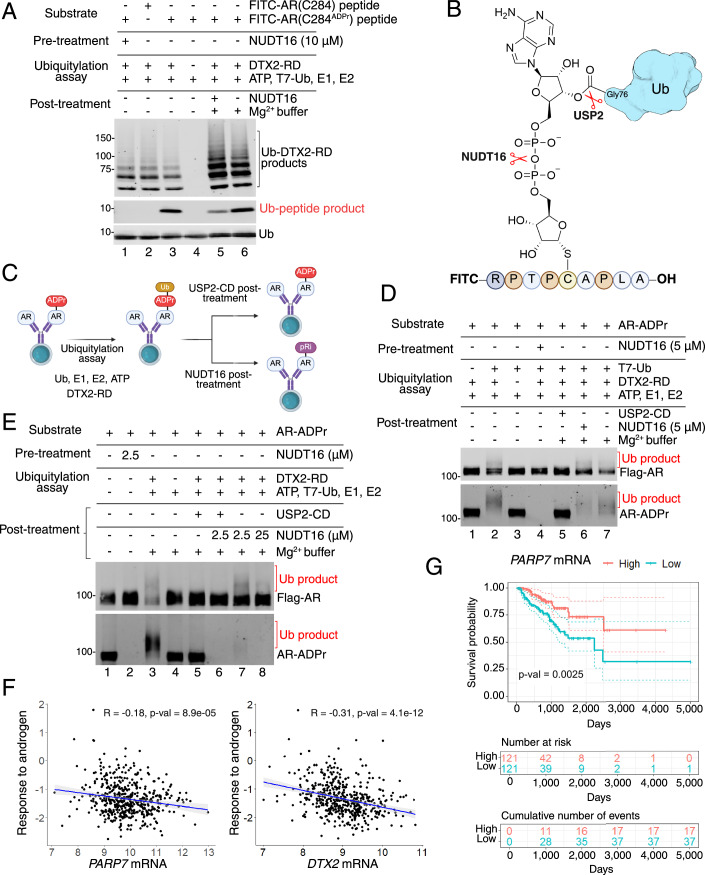
The androgen receptor (AR) transduces the effects of circulating and tumor-derived androgens to the nucleus through ligand-induced changes in protein conformation, localization, and chromatin engagement. Defining how these events are integrated with signal transduction is critical to understand how AR drives prostate cancer and unveil pathway features that are potentially amenable to therapeutic intervention. We describe a novel post-transcriptional mechanism that controls AR levels on chromatin and gene output based on highly selective, inducible degradation. We find that the mono-ADP-ribosyltransferase PARP7 generates an ADP-ribosyl degron in the DNA-binding domain of AR, which is recognized by the ADP-ribose reader domain in the ubiquitin E3 ligase DTX2 and degraded by the proteasome. Mathematical modeling of the pathway suggested that PARP7 ADP-ribosylates chromatin-bound AR, a prediction that was validated in cells using an AR DNA-binding mutant. Non-conventional ubiquitin conjugation to ADP-ribosyl-cysteine and degradation by the proteasome forms the basis of a negative feedback loop that regulates modules of AR target genes. Our data expand the repertoire of mono-ADP-ribosyltransferases to include gene regulation via highly selective protein degradation.

Keywords: ADP-ribosylation; AR; DTX2; RBN2397; Ubiquitin.


Conflict of interest statement

Disclosure and competing interests statement. The authors declare no competing interests. BMP discloses that he is a co-founder of Define Therapeutics.

Figures

Figure 1
Figure 1. Androgen-regulated gene expression is sensitive to PARP7 inhibition by RBN2397.
(A) Volcano plots showing differential gene expression analysis in the VCaP cell line across three experimental conditions: untreated (CTRL), treated with R1881 (R1881), and treated with R1881 + RBN2397 (R1881 + RBN). The top plot compares gene expression between R1881-treated and untreated samples (R1881 vs. CTRL), while the bottom plot compares gene expression between R1881 + RBN-treated samples to R1881-treated samples (R1881 + RBN vs. R1881), using R1881 as the control. Each dot represents a gene. The x axis shows the log2 fold change (Log2FC) and the y axis shows the negative log10 of the adjusted P value (P-adj). Genes that have significantly increased or decreased expression (P-adj <0.001) are highlighted in red and blue, respectively. The AR and PARP7 genes are indicated on the plots. The experiment was done with three biological replicates, and the P values were calculated using the Wald test with multiple testing correction—Benjamini–Hochberg method. (B) Venn diagrams visualizing the overlap between differentially expressed genes (P-adj <0.001) in two comparisons: R1881 vs CTRL (white) and R1881 + RBN vs R1881 (gray) differentially expressed genes (P-adj <0.001), alongside androgen receptor AR gene target genes (blue), identified through integration of AR ChIP-seq and RNA-seq from R1881-treated VCaP cells). The Venn diagrams on the right show PARP7 inhibition with RBN2397 affects the expression of R1881-sensitive genes, whether they are R1881-induced or R1881-repressed. The largest group of genes affected by RBN2397 treatment are those which are positively regulated by R1881 and undergo a further increase (45%). The second largest group are negatively regulated by R1881 and undergo a further decrease (38%). We also show genes that are upregulated by R1881 but downregulated by RBN2397, and vice versa. (C) Plot illustrating the overlap of differentially expressed genes between the R1881 vs. CTRL and R1881 + RBN vs. R1881 comparisons. On the x axis, “top ranks” represent genes with increased expression in both comparisons, while “bottom ranks” correspond to genes with decreased expression. The y axis shows the number of overlapping genes, plotted as a step function across ranked genes based on the Wald statistic. A dotted line separates the “top ranks” and “bottom ranks.” Only the top 1000 and bottom 1000 ranked genes are shown. For reference, the expected overlap and corresponding 95% confidence intervals, calculated from an empirical distribution obtained through subsampling, are also displayed. Notably, genes with increased expression in both comparisons exhibit a much larger overlap. The experiment was done with three biological replicates, and the lines represent the means. (D) Heatmaps displaying the top 30 genes contributing to the similarity score in (C) (left— increased expression with R1881, right—decreased expression with R1881). The left heatmap shows genes with increased expression upon R1881 treatment, while the right shows those with decreased expression. Columns represent experimental groups: CTRL, R1881, and R1881 + RBN. Expression values were normalized using variance-stabilizing transformation (VST). The color gradient used for visualization is indicated in the figure. The dendrograms to the left of each heatmap illustrate gene clustering based on expression patterns, grouping more similar genes together. Source data are available online for this figure.
Figure 2
Figure 2. PARP7 regulates temporal patterns of AR-dependent gene expression through negative feedback.
(A) Scheme visualizing the analysis workflow. The left side presents RNA-seq datasets used to create the compiled gene expression time course of androgen treatment in the VCaP cell line. The GEO accession number and the number of samples are shown for each time point. The right side presents the analysis workflow (WGCNA Weighted gene co-expression network analysis, ORA Overrepresentation analysis, GSEA Gene set enrichment analysis). (B) Dot plot showing the gene modules overrepresented in the set of 1000 AR target genes. The gene lists of modules only with more than 100 genes resulting from WGCNA were used as gene sets for ORA. The y axis represents the modules (the number (n) of genes is provided in parentheses for each module), and the x axis represents the fold enrichment. The dot size represents −log10(p-adj), and the dots colored in red represent modules with P-adj <0.001. The P values were calculated using the hypergeometric test with multiple testing correction—Benjamini–Hochberg method. (C) Dot plot showing the gene modules enriched in the R1881 + RBN vs R1881 differentially expressed genes. The gene lists of modules only with more than 100 genes resulting from WGCNA were used as gene sets for GSEA. The y axis represents the modules, and the x axis represents the Normalized enrichment score (NES). The dot size represents −log10(P-adj), and the dots colored in red represent modules with P-adj <0.001. The P values were calculated using the permutation-based approach. (D) Line plot showing the eigengene expression for significantly enriched modules from GSEA in (C). The plot on the top shows modules with positive NES (7 and 6), and the plot on the bottom shows modules with negative NES (19, 17, and 2). The y axis represents the eigengene expression, and the x axis represents the time of androgen treatment. The lines represent the means and the error bars represent standard deviation (0 h: n = 7; 8 h: n = 10; 12 h: n = 3; 18 h: n = 3; 22 h: n = 9; 24 h: n = 6; 48 h: n = 2; n represents number of biological replicates). (E) Line plots showing the results of a time course RT-qPCR experiment in VCaP cells treated with R1881 (black) and cotreated with R1881 and RBN3297 (red). The y axis represents the log2 of the expression fold change from 0 h time point normalized to the GUS housekeeping gene, and the x axis represents the time of treatment in hours. The module membership is shown in parentheses for each gene. The lines represent the means and the error bars represent standard deviation (n = 3; n represents number of biological replicates). Source data are available online for this figure.
Figure 3
Figure 3. Androgen-induced ADP ribosylation by PARP7 targets AR for proteasomal degradation.
(AC) Immunoblot detection of AR and AR-ADPr (by FL-AF1521) in VCaP cells subjected to a time course of R1881 (A), R1881 and RBN2397 (B), or R1881 and Bortezomib (Bortez) (C) treatment. Cells were collected every 2 h for an 18-h period. (D) Line plot visualizing the AR protein density measurements for immunoblots from (AC). The y axis represents the log2 of the AR/TUB density fold change from 0-h time point, and the x axis represents the time of treatment in hours. The curves were fitted using the loess method. Data points represent single measurements. (E) Schematic diagram of the androgen-induced AR degradation mechanism. (F) Immunoblot detection of AR and AR-ADPr (Fl-AF1521) in VCaP cells treated with DHT, DHT + RBN2397, and DHT+Bortezomib for times indicated on the panel. (G) Immunoblot detection of the AR and AR-V7 protein in VCaP cell extracts and AF1521 bound fractions. Cell extracts from VCaP cells treated with different combinations of R1881, RBN2397, and Bortezomib for 10 h and were combined with AF1521 beads for the enrichment of ADP-ribosylated proteins. (H) Immunoblot detection of Flag-AR, AR-ADPr, and FKBP51 in PC3-AR shCTRL (left) and shPARP7 (right) cells treated with R1881 and cotreated with R1881 and RBN2397 for times indicated on the panel. The shGFP was used as shCTRL. (I) Immunoblot detection of Flag-AR and AR-ADPr in PC3-AR cells treated for 18 h with R1881 and different PARP inhibitors (RBN2397—PARP7i; RBN012759—PARP14i; Veliparib, Olaparib, and Talazoparib—PARP1/2i). Source data are available online for this figure.
Figure 4
Figure 4. Mathematical modeling of androgen-induced AR degradation suggests that PARP7 acts upon chromatin-bound AR.
(A) Schematic diagram of the Simple Model architecture that does not explicitly consider AR-chromatin binding to generate transcript. (B) Plots of experimental transcript and simulated transcript for the top 100 parameter sets during R1881 treatment, with and without RBN2397 using the Simple Model architecture. Data are normalized to have a maximal value of 100. (C) Schematic diagram of the Chromatin Model architecture where AR bound to chromatin generates transcript and PARP7 acts upon AR only when bound to chromatin. (D) Plots of experimental transcript and simulated transcript for the top 100 parameter sets during R1881 treatment, with and without RBN2397 using the Chromatin Model architecture. Data is normalized to have a maximal value of 100. (E) Schematic diagram of the Nucleoplasm Model architecture that where AR bound to chromatin generates transcript and PARP7 acts upon AR only in the nucleoplasm. (F) Plots of experimental transcript and simulated transcript for the top 100 parameter sets during R1881 treatment, with and without RBN2397 using the Nucleoplasm Model architecture. Data is normalized to have a maximal value of 100. (G) Graph of model performance for each model architecture, measured by the sum of squared error (SSE) after 600,000 Monte Carlo simulations to find the best parameters for each. The lower the SSE score, the better the simulated data matches the experimental data. For each model, top 100 scores were used to calculate P values (pairwise t test, n = 100 different parameter sets), all data significantly different for P < 0.0001 (simple vs chromatin P = 1.7 × 10−78, simple vs nuclear P = 9.8 × 10−77, chromatin vs nuclear P = 1.32 × 10−214). The error bars represent the standard deviation of the data. (H) Bayes weights calculated from the Bayes Information Criterion (BIC) of each model. (I) Simulated AR levels, promoter occupancy, and transcriptional output from the top parameter set using the Chromatin Model. (J) Simulations using the Chromatin Model with differing starting levels of AR to have the indicated ratio to promoters in the model. Increasing AR:Promoter increases the duration of the delay in negative feedback. Source data are available online for this figure.
Figure 5
Figure 5. Androgen-induced AR degradation depends on DNA binding and affects chromatin occupancy.
(A) AR DNA-binding domain structure (1R4I) in its wild-type form (left) and with V582F amino acid substitution (right). (B) Immunoblot detection of Flag-AR, AR-ADPr (by FL-AF1521), and FKBP51 in PC3m(HA-PARP7/Flag-AR WT) cells (left) and PC3m(HA-PARP7/Flag-AR V582F mutant) cells (right) treated with R1881 or cotreated with R1881 and RBN2397 for times indicated on the panel. (C) Line plots showing the results of a time course ChIP-qPCR experiment in VCaP cells treated with R1881 (black) or cotreated with R1881 and RBN3297 (red). The y axis represents the ChIP signal characterized as the percentage of input DNA, and the x axis represents the time of treatment in hours. The lines represent the means, and the error bars represent standard deviation (n = 3; n represents number of biological replicates). (D) Confocal microscopy staining of HA-PARP7 and AR in PC3-AR(HA-PARP7) cells treated with R1881 or cotreated with R1881 and RBN2397 for times (0–18 h) indicated on the panel. Images were also taken after 42 h drug treatment (Appendix Fig. S4 along with the same re-displayed 0 h time point to allow comparison). The third column shows merged channels, and the Pearson correlation coefficient for pixel co-localization is indicated in the bottom left corner for every condition. A scale bar of 10 µm is provided on the bottom right corner of the upper left panel and applies to all panels. Source data are available online for this figure.
Figure 6
Figure 6. The DBD mediates androgen-induced degradation of AR.
(AE) Immunoblot detection of Flag-AR, AR-ADPr (by FL-AF1521), and FKBP51 in PC3m(HA-PARP7/Flag-AR wild type or mutant) cells treated with R1881 or cotreated with R1881 and RBN2397 for times indicated on the panel. (A) AR WT; (B) AR Mut1 (C125,131,290,327,406,519,620,670G); (C) AR Mut2 (C125,131,290,327,406,519,670G); (D) AR Mut3 (C125,131,290,327,406,519,670G & C620S); (E) AR Mut4 (C620S). (F) Diagrams of Flag-AR mutants employed in this figure (Mut1–4). All of the ADP-ribosylation cysteine sites on AR are marked in green, and the particular substitutions are marked in red for glycine and blue for serine. (G) Line plots showing the results of a time course RT-qPCR experiment in PC3m(HA-PARP7/Flag-AR WT) cells (upper panels) and PC3m(HA-PARP7/Flag-AR C620S mutant: Mut4) cells (lower panels) treated with R1881 (black) and cotreated with R1881 and RBN2397 (red). The y axis represents the log2 of the expression fold change from 0 h time point normalized to the GUS housekeeping gene, and the x axis represents the time of treatment in hours. The lines represent the means, and the error bars represent standard deviation (n = 3; n represents the number of biological replicates). (H) Immunoblot detection of VP16-AR-DBD-LBD stably co-expressed with WT AR in PC3 cells. The cells were treated with R1881 or cotreated with R1881 and the PARP7 inhibitor RBN2397 for the times indicated on the panel. The VP16-AR-DBD-LBD expresses at about 10% of the WT AR. (I) Diagram of the VP16-AR-DBD-LBD fusion. Previously described ADP-ribosylation cysteine sites in the AR DBD are marked in green,VP16-AR-DBD-LBD fusion contains a glycine substitution in the Cys670 ADP-ribosylation site. Source data are available online for this figure.
Figure 7
Figure 7. DTX2 is the E3 ligase for ADP-ribosylated AR.
(A) Immunoblot detection of Flag-AR and AR-ADPr (by FL-AF1521) in PC3-AR cells with siRNA knockdowns (total 4-day knockdown) of the selected relevant E3 ligases (DTX1, DTX2, DTX4, HUWE1, RNF146, SPOP, TRIP12 and UBR5), treated with R1881 for 21 h before cell harvest. The AR/TUB and AR-ADPr/AR ratios for each lane are presented below the blot. (B) Immunoblot detection of Flag-AR and AR-ADPr in PC3-AR cells with siDTX2 knockdown, treated with R1881 for the times indicated on the panel. The AR-ADPr/AR ratio for each lane is presented below the blot. (C) Immunoblot detection of Flag-AR and AR-ADPr in PC3-AR siCTRL and siDTX2 cell extracts and AF1521 bound fraction. Cell extracts from PC3-AR siCTRL and siDTX2 cells treated with R1881 for 6 h were combined with AF1521 beads for the enrichment of ADP-ribosylated proteins. (D) Immunoblot detection of Flag-AR and AR-ADPr in PC3-AR siCTRL/siDTX2 and PC3-AR HA-PARP7 cell extracts and GSH beads bound fraction. Cell extracts from PC3-AR siCTRL/siDTX2 and PC3-AR HA-PARP7 cells treated with R1881 for 6 h were combined with GSH beads loaded with GST-DTX2-RD or GST-DTX2-RDmut for the enrichment of proteins recognized by DTX2 DTC domain. (E) Diagrams of DTX2-RD and DTX2-RDmut. Three loss-of-function mutations in the DTC domain of DTX2-RDmut (S568A, H582A, and H594A) are indicated with a red asterisk. (F) Schematic diagram of AR protein preparation as a substrate for biochemical reactions. Cell extracts from PC3-AR siDTX2 cells treated (left) or untreated (right) with R1881 for 6 h were combined with M2 beads for immunoprecipitation. The purified protein from the preparation with R1881 treatment was used for experiments in (G, H), and the purified protein from the preparation without R1881 treatment was used only in (H). (G) Immunoblot detection of Flag-AR and AR-ADPr from the ubiquitylation assay on AR protein prepared with siDTX2 and R1881 treatment (F, left). The ubiquitylated products (Ub product, red bracket) are labeled for Flag-AR and AR-ADPr detection. All reactions contained AR-ADPr (R1881-treated samples), ATP, Ub, E1, and E2. For DTX2-RD status (dropout or DTX2-RDmut), refer to labels. (H) Immunoblot detection of Flag-AR, AR-ADPr, and GST-DTX2-RD from the ubiquitylation assay on AR protein prepared with siDTX2 transfection, and with or without R1881 treatment (F). The ubiquitylated products (Ub product) are labeled in red for Flag-AR and AR-ADPr detection. The dropouts of the ubiquitylation assay components (Ub, E1, E2, and 30 °C incubation) are indicated on the labels. The T7-Ubiquitin (T7-Ub) was detected by Ponceau staining. Lane numbers are indicated below the blot. (I) Bar plots showing the results of an RT-qPCR experiment in PC3-AR siCTRL/siDTX2 cells, untreated (gray), treated with R1881 (purple), and cotreated with R1881 and RBN2397 (blue). The y axis represents the relative expression normalized to the GUS housekeeping gene, and the x axis represents the siRNA used. The P values from the Welch’s t test for comparisons between corresponding conditions in siCTRL and siDTX2 are indicated on the plots. The top of the columns represent the means and the error bars represent standard deviation (n = 3; n represents number of biological replicates). Source data are available online for this figure.
Figure 8
Figure 8. DTX2 conjugates ubiquitin to AR through ADP-ribose.
(A) Immunoblot detection of Fluorescein (FITC) and T7-Ubiquitin (T7-Ub) from the ubiquitylation assay on FITC-AR(C284) or FITC-AR(C284ADPr) peptides. The labels indicate from the top: the substrate used (FITC-AR(C284) or FITC-AR(C284ADPr) peptides), pre-ubiquitylation assay treatments (NUDT16), the ubiquitylation assay (all reactions contained ATP, T7-Ub, E1 and E2, for DTX2-RD dropout, refer to labels), and the post- ubiquitylation assay treatments (NUDT16 or Mg2+ buffer). Lane numbers are indicated below the blot. (B) Schematic diagram representing FITC-AR(C284ADPr) peptide conjugated to ubiquitin (Ub). Indicated with red scissors are bonds within the ADP-ribose structure cleaved by NUDT16 and USP2. (C) Schematic of the ubiquitylation assay workflow for (D, E). (D) Immunoblot detection of Flag-AR and AR-ADPr (by FL-AF1521) from the ubiquitylation assay on AR protein prepared with siDTX2 transfection and R1881 treatment (refer to Fig. 6F for sample preparation workflow). The ubiquitylated products (Ub product) are labeled in red for Flag-AR and AR-ADPr detection. The labels separated by black lines indicate sequential steps from top to bottom. From the top, the labels indicate the substrate used (AR-ADPr), pre-ubiquitylation assay treatments (NUDT16), the ubiquitylation assay, and the post-ubiquitylation assay treatments (USP2-CD, NUDT16, or Mg2+ buffer). Lane numbers are indicated below the blot. (E) Immunoblot detection of Flag-AR and AR-ADPr from the ubiquitylation assay on AR protein prepared with siDTX2 and R1881 treatment (refer to Fig. 6F for sample preparation workflow). The ubiquitylated products (Ub product) are labeled in red for Flag-AR and AR-ADPr detection. The labels separated by black lines indicate sequential steps from top to bottom. From the top, the labels indicate the substrate used (AR-ADPr), pre-ubiquitylation assay treatments (NUDT16), the ubiquitylation assay, and the post-ubiquitylation assay treatments (USP2-CD, NUDT16, or Mg2+ buffer). Lane numbers are indicated below the blot. (F) Scatter plots depicting the correlation between PARP7 (left) or DTX2 (right) mRNA expression and the response to androgen pathway activity calculated by PARADIGM in primary prostate cancer patients from TCGA-PRAD cohort. Each dot represents one patient (n = 478, n represents the number of patients). Pearson correlation coefficients and corresponding P values are indicated on the plots. (G) Kaplan–Meier plot depicting progression-free interval (PFI) in primary prostate cancer patients from the TCGA-PRAD cohort, stratified by PARP7 expression levels. The red line represents patients with high PARP7 expression (top 25%), and the green line represents patients with low PARP7 expression (bottom 25%). The x axis represents time (days), and the y axis represents the progression-free interval probability. The interval distributions were compared using the log-rank test, with the P value indicating statistical significance. Dotted lines represent the 95% confidence interval. The P values were calculated using the log-rank test. Source data are available online for this figure.

References

    1. Ahmed S, Bott D, Gomez A, Tamblyn L, Rasheed A, Cho T, MacPherson L, Sugamori KS, Yang Y, Grant DM et al (2015) Loss of the mono-ADP-ribosyltransferase, Tiparp, increases sensitivity to dioxin-induced steatohepatitis and lethality. J Biol Chem 290:16824–16840 - PMC - PubMed
    1. Ahmed SF, Buetow L, Gabrielsen M, Lilla S, Chatrin C, Sibbet GJ, Zanivan S, Huang DT (2020) DELTEX2 C-terminal domain recognizes and recruits ADP-ribosylated proteins for ubiquitination. Sci Adv 6:eabc0629 - PMC - PubMed
    1. An J, Wang C, Deng Y, Yu L, Huang H (2014) Destruction of full-length androgen receptor by wild-type SPOP, but not prostate-cancer-associated mutants. Cell Rep 6:657–669 - PMC - PubMed
    1. Aravind L (2001) The WWE domain: a common interaction module in protein ubiquitination and ADP ribosylation. Trends Biochem Sci 26:273–275 - PubMed
    1. Bindesboll C, Tan S, Bott D, Cho T, Tamblyn L, MacPherson L, Gronning-Wang L, Nebb HI, Matthews J (2016) TCDD-inducible poly-ADP-ribose polymerase (TIPARP/PARP7) mono-ADP-ribosylates and co-activates liver X receptors. Biochem J 473:899–910 - PubMed

MeSH terms

LinkOut - more resources