. 2025 Aug;644(8076):516-526.
doi: 10.1038/s41586-025-09225-2. Epub 2025 Jul 18.

Pathology-oriented multiplexing enables integrative disease mapping

Malte Kuehl #  1   2   3   4   5 Yusuke Okabayashi #  6   7   8 Milagros N Wong #  9   10   11   12 Lukas Gernhold #  11   12 Gabriele Gut #  13   14 Nico Kaiser  15   11   12 Maria Schwerk  11   12 Stefanie K Gräfe  11   12 Frank Y Ma  16 Jovan Tanevski  17   18 Philipp S L Schäfer  17 Sam Mezher  11   12 Jacobo Sarabia Del Castillo  13 Thiago Goldbeck-Strieder  11   12 Olga Zolotareva  19   20 Michael Hartung  19 Fernando M Delgado Chaves  19 Lukas Klinkert  11   12 Ann-Christin Gnirck  11   21 Marc Spehr  22 David Fleck  22 Mehdi Joodaki  23 Victor Parra  23 Mina Shaigan  23 Martin Diebold  24 Marco Prinz  24 Jennifer Kranz  25   26 Johan M Kux  27 Fabian Braun  11   12   28 Oliver Kretz  11   12 Hui Wu  11   12 Florian Grahammer  11   12 Sven Heins  15 Marina Zimmermann  15   12 Fabian Haas  11   12 Dominik Kylies  11   12 Nicola Wanner  11   12 Jan Czogalla  11   12 Bernhard Dumoulin  11   12 Nikolay Zolotarev  11   12 Maja Lindenmeyer  11   12 Pall Karlson  29   30 Jens R Nyengaard  9   10   29 Marcial Sebode  31 Sören Weidemann  32 Thorsten Wiech  33 Hermann-Josef Groene  33   34 Nicola M Tomas  11   12 Catherine Meyer-Schwesinger  12   35 Christoph Kuppe  36 Rafael Kramann  36 Alexandre Karras  37 Patrick Bruneval  38 Pierre-Louis Tharaux  38 Diego Pastene  39 Benito Yard  39 Jennifer A Schaub  40 Phillip J McCown  40 Laura Pyle  41 Ye Ji Choi  41 Takashi Yokoo  42 Jan Baumbach  19   43 Pablo J Sáez  27 Ivan Costa  23 Jan-Eric Turner  11   12 Jeffrey B Hodgin  44 Julio Saez-Rodriguez  17 Tobias B Huber  11   12 Petter Bjornstad  41 Matthias Kretzler  40 Olivia Lenoir  38 David J Nikolic-Paterson  16 Lucas Pelkmans  13 Stefan Bonn  15   12 Victor G Puelles  45   46   47   48
Affiliations

Pathology-oriented multiplexing enables integrative disease mapping

Malte Kuehl et al. Nature. 2025 Aug.

Abstract

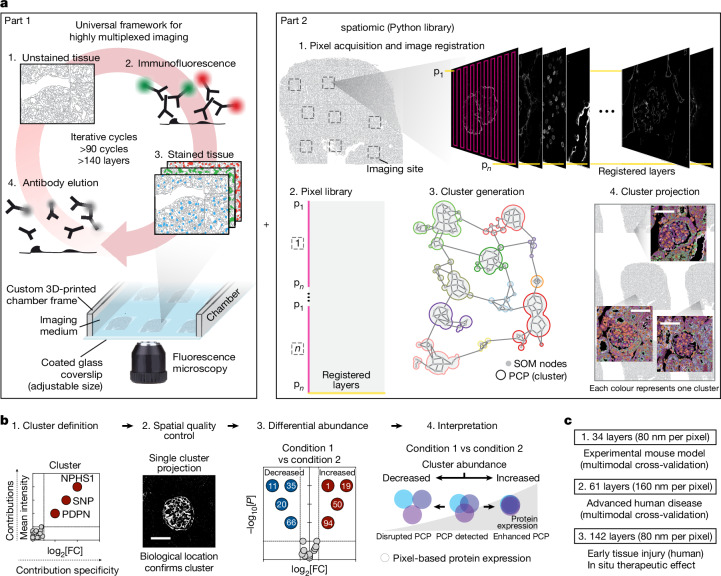
The expression and location of proteins in tissues represent key determinants of health and disease. Although recent advances in multiplexed imaging have expanded the number of spatially accessible proteins1-3, the integration of biological layers (that is, cell structure, subcellular domains and signalling activity) remains challenging. This is due to limitations in the compositions of antibody panels and image resolution, which together restrict the scope of image analysis. Here we present pathology-oriented multiplexing (PathoPlex), a scalable, quality-controlled and interpretable framework. It combines highly multiplexed imaging at subcellular resolution with a software package to extract and interpret protein co-expression patterns (clusters) across biological layers. PathoPlex was optimized to map more than 140 commercial antibodies at 80 nm per pixel across 95 iterative imaging cycles and provides pragmatic solutions to enable the simultaneous processing of at least 40 archival biopsy specimens. In a proof-of-concept experiment, we identified epithelial JUN activity as a key switch in immune-mediated kidney disease, thereby demonstrating that clusters can capture relevant pathological features. PathoPlex was then used to analyse human diabetic kidney disease. The framework linked patient-level clusters to organ disfunction and identified disease traits with therapeutic potential (that is, calcium-mediated tubular stress). Finally, PathoPlex was used to reveal renal stress-related clusters in individuals with type 2 diabetes without histological kidney disease. Moreover, tissue-based readouts were generated to assess responses to inhibitors of the glucose cotransporter SGLT2. In summary, PathoPlex paves the way towards democratizing multiplexed imaging and establishing integrative image analysis tools in complex tissues to support the development of next-generation pathology atlases.


Conflict of interest statement

Competing interests: G.G. and L. Pelkmans are listed as inventors on patents related to the 4i and single-pixel clustering methods and L. Pelkmans holds ownership in Apricot Therapeutics, which offers commercial services related to multiplexed histopathology. P.B. reports serving or having served as a consultant for AstraZeneca, Bayer, Bristol-Myers Squibb, Boehringer Ingelheim, Eli-Lilly, LG Chemistry, Sanofi, Novo Nordisk and Horizon Pharma. P.B. also serves or has served on the advisory boards and/or steering committees of AstraZeneca, Bayer, Boehringer Ingelheim, Novo Nordisk, and XORTX. M. Kretzler reports partial funding for contributions here originated from the Renal Pre-Competitive Consortium (RPC2), as funded by AstraZeneca, Eli Lilly, Janssen Pharmaceuticals, Novo Nordisk and Roche-Genentech. J.S.-R. reports funding from GSK, Pfizer and Sanofi and fees/honoraria from Travere Therapeutics, Stadapharm, Astex, Pfizer, Grunenthal, Moderna and Tempus Labs. M. Kuehl is an employee of and holds an ownership interest in KH Biotechnology, which provides consulting services to Lamin Labs. All other authors do not report competing interests.

Figures

Fig. 1
Fig. 1. PathoPlex.
a, PathoPlex represents a combination between a universal framework for highly multiplexed imaging in pathological tissues (left) and a Python library (spatiomic) to analyse protein co-expression patterns (PCPs) or clusters (right). b, Step-by-step interpretation of generated clusters. c, Summary of all experimental datasets in this study. Scale bars, 50 μm. FC, fold change; p, pixel.
Fig. 2
Fig. 2. Identification of epithelial JUN activity as a key switch in immune-mediated kidney disease.
a, Schematic overview for the proof-of-concept experiment in a mouse model of immune-mediated kidney disease before (acute injury) and after (CGN) pathological lesion formation (n = 10 mice; ROIs = 40). NTS, nephrotoxic serum; details of the antibody panel are provided in Supplementary Table 1. b, Spatiotemporal distribution of colour-coded clusters. c, Examples of interpretable clusters (C28, C21, C4 and C7) of biological significance. Each dot represents an ROI, which was used as an independent observation (n = 11 ROIs for controls, n = 11 ROIs for acute injury and n = 18 ROIs for CGN) and red bars represent medians and inter-quartile ranges. Mes, mesangial. d, Identification of C21 (with pJUN as a top contributor) as a key regulated pathomechanism before and after lesion formation. e, Images of the spatiotemporal distribution of C21 (left) and cell-specific frequency (right) among tubular epithelial cells and PECs. f, Treatment with a JNK inhibitor (JNKi) reduces the PDGF-mediated collective migration of murine PECs in vitro. In ‘collective migration’, error bars represent upper and lower limits. Data are from four biological replicates. Veh, vehicle. g, Confirmation of pJUN expression in PECs during different lesion stages among human kidney biopsy samples (n = 12 patients and n = 3 healthy individuals), which was also associated with CD44 co-expression. h, Schematic overview of the use of a JNKi as a preventive strategy (before NTS) and a therapeutic strategy (7 days after NTS) during the progression of immune-mediated kidney disease in a rat model of CGN. i,j, Proteinuria (n = 4 rats for all groups) and glomerular damage (n = 4 rats for day 0, n = 6 rats for all other groups; red bars represent medians and interquartile ranges) show a direct preventive (i) and therapeutic (j) effect of the JNKi. k, Using expression of CD44 as a readout of PEC activation, we confirmed the effect of the JNKi on PEC activation (using all rats available from i and j). Differential cluster abundance analysis used a two-sided t-test. Cluster composition analysis relied on a two-sided t-test with Holm–Šidák correction. For other comparisons, two-sided Mann–Whitney, Kruskal–Wallis with Dunn, analysis of variance (ANOVA) with Dunnett T3 or ANOVA with Holm–Šidák tests were used depending on the number of comparisons. ****P < 0.0001, ***P < 0.001, **P < 0.01, *P < 0.05 or not significant (NS). Scale bars, 50 µm (c,e,g,k). Diagrams in a, f and h were created using BioRender (https://biorender.com). Source Data
Fig. 3
Fig. 3. PathoPlex as a tool to analyse human DKD.
a, Schematic overview of the experimental design to compare control and DKD specimens (n = 38 18 controls, 20 DKD; ROIs = 422). Details of the antibody panel are provided in Supplementary Table 3. RCC, renal cell carcinoma. b, Scheme of cluster identification to differential abundance and cluster definition. We show the example of C19, which represents metabolic tubular injury (with TRPC6 and AIFM1 as top contributors). c, Single-cell segmentation reveals disease-specific cell-level metaclusters (MCs). PTs, proximal tubules; PTMs, post-translational modifications. d, Mean cluster abundances correlate with patient-level renal function (linear regression with 95% confidence interval). For this example, cluster 28 represents ECM remodelling and is inversely associated with estimated glomerular filtration rate (eGFR). e, Unsupervised bicluster analysis for patient stratification differentiates between DKD and control specimens with perfect accuracy and isolates a subset of biologically meaningful clusters. f, Druggabilty profiling of standard care. The top contributors of clusters selected in b were used as a DKD signature that was extended using open-access tools (that is, STRING), and then cross-referenced to the CTD to select a subset of drugs. Multiple medications for the standard care of diabetes interacted with our expanded DKD signature. g, Drug–protein interactions were quantified for our DKD signature. One example is PDE5 inhibitors as potential modulators of TRPC6–AIFM1 through cGMP signalling, which was confirmed through a re-analysis of public single-nucleus RNA-sequencing data. Differential cluster abundance analysis used a two-sided t-test with Benjamini–Hochberg correction. Cluster composition analysis relied on a two-sided t-test with Holm–Šidák correction. Correlation analysis was performed using two-sided Spearman’s rank coefficient. For other comparisons, two-sided t-test, Mann–Whitney or Kruskal–Wallis tests were used depending on the number of comparisons. ****P < 0.0001, ***P < 0.001, **P < 0.01, *P < 0.05. Scale bars, 100 µm (bd). Diagrams in a,e,f and g were created using BioRender (https://biorender.com). Source Data
Fig. 4
Fig. 4. PathoPlex as a tool to decode kidney injury before DKD.
a, Schematic overview showing the experimental design (n = 18 cases; ROIs = 284). Details of the antibody panel are provided in Supplementary Table 6. For this experiment, we used human research specimens from healthy individuals and individuals with T2D treated or not with SGLT2 inhibitors (SGLT2i). The images on the right show 140 clusters projected. b, Differential cluster abundance for each comparison. The key for clusters also applies to c and d. c, Examples of integrative subcellular clusters that were differentially regulated. Images were selected from all available ROIs (n = 284). d, Mean effect of SGLT2i on regulated clusters, showing examples of persistently dysregulated (C14, C40, C43, C48, C51, C87 and C116), statistically improved (C38 and C41) and normalized (C19 and C35) clusters. HC, healthy controls. e, Cluster-based model of glomerular and tubulointerstitial alterations before the development and in late stages of DKD, accounting for effects of SGLT2i. Differential cluster abundance analysis used a two-sided t-test with Benjamini–Hochberg correction. Scale bars, 100 µm (a,c). BB, brush border; CD, collecting duct; DT, distal tubule; EC, endothelial cell; FIB, fibroblasts; HSP, heat shock protein; IC, intercalated cell; MAM, mitochondria-associated endoplasmic reticulum membrane; NO, nitric oxide; ROS, reactive oxygen species; TAL, thick ascending limb; VSMC, vascular smooth muscle cell. Diagrams in a were created using BioRender (https://biorender.com). Source Data
Extended Data Fig. 1
Extended Data Fig. 1. Practical quality control steps.
(a) Full elution of antibodies and (b) absence of remnant signals when re-staining with secondary antibodies. (c) Specificity of staining and constancy of re-stained structures over multiple imaging cycles. (d) Secondary-only cycles do not show signal amplification. (e) Re-staining of SOD1 after 61 cycles, showing very strong agreement between intensity distributions. vWF, von Willebrand factor; SRB1, Scavenger receptor class B member 1; PDI, Protein disulfide isomerase; EZR, Ezrin; p-rp-S6, phospho-ribosomal protein S6; p-H3, phospho-histone-H3; PCNA, Proliferating cell nuclear antigen; COL4, Collagen type IV; LAMP1, lysosomal-associated membrane protein 1;VMT, Vimentin; FN, Fibronectin; WT1, Wilms tumor 1; ACE2, Angiotensin-converting enzyme 2; CK19, Cytokeratin 19; ANXA3, Annexin 3; LTL, Lotus tetragonolobus lectin; α-SMA, alpha-smooth muscle actin (ACTA2); SYNPO, Synaptopodin; EMCN, Endomucin; NPHN, Nephrin; ab, antibody; AF, autofluorescence; PDPN, Podoplanin; LMN, Laminin; AQP2, Aquaporin 2; E-CAD, E-cadherin; SOD1: Superoxide Dismutase 1; HSD11B2: 11-β-hydroxysteroid dehydrogenase type 2; u-H2B: ubiquitylated histone 2B. Scale bars represent 100 µm.
Extended Data Fig. 2
Extended Data Fig. 2. Practical solutions to minimize bias introduction.
(a) Schematic overview of all strategies deployed. (b) PathoPlex is compatible with multiple microscopy systems, including widefield, spinning disk and laser confocal, which directly determine imaging time, file size and image resolution. (c) Strategies to minimize bias introduction are based on creating self-contained batches, where tissues are processed in parallel using imaging chambers that contain specimens representing all experimental groups, including controls. (d) Suggested imaging chambers for histopathological studies (2–24 wells). (e) Multi-well pipetting can be performed manually or using liquid handling systems. Alternatively, 3D printing can be used to customize a 1-well imaging chamber, which simplifies liquid handling. (f) In addition, a 3D printer can also be used as a liquid handling system. The printer head is used to automate liquid addition and removal. (g) Specificity, and elution controls of 3D printer-based imaging cycles. LMNB1, Lamin B1 (cycle 1); EMCN, Endomucin (cycle 1); α-SMA, alpha-smooth muscle actin or ACTA2 (cycle 2); VMT, Vimentin (cycle 4); AKAP12, A-Kinase Anchoring Protein 12 (cycle 4); Secondary ab (QC cycle; cycle 6). Scale bars represent 100 µm. Parts of panels a, c and e were created using BioRender (https://biorender.com).
Extended Data Fig. 3
Extended Data Fig. 3. PathoPlex complements pathology evaluations.
2 expert pathologists analyzed all samples and defined all 3 groups with 100% accuracy. (a) Quantitative pathology analyses to differentiate acute injury and CGN vs controls, showing compartment-specific changes in acute injury and CGN. Each dot represents one mouse (N = 3 controls, N = 3 acute injury, and N = 6 CGN; red line represents medians). Two-sided t tests and Mann Whitney tests were used. (b) While mice with CGN have overt lesions, those with acute injury show only minor abnormalities, namely subtle vacuolation in the proximal tubuli (green). (c) Volcano plot showing all regulated clusters comparing controls to acute injury, featured cluster 26 (C26). (d) Principal component (PC) analysis revealed clear separation between images from controls (blue) and acute injury (orange) specimens with C26 being the top contributor to PC1. (e) Spatial projections of cluster 26 (C26) show a regulation pattern in the luminal side of kidney tubuli, a similar location to the one used for pathologists to define acute injury. ****P < 0.0001, ***P < 0.001; EEA1: Early Endosome Antigen 1, EZR: Ezrin. Scale bars represent 60 µm.
Extended Data Fig. 4
Extended Data Fig. 4. Transcriptional profiling in experimental crescentic nephritis identifies JUN as a top regulated gene.
(a) Schematic description of experimental design with nephrotoxic serum (NTS) glomerulonephritis and glomerular nuclear isolation for bulk RNA sequencing. (b) Volcano plots show transcriptionally regulated genes at day 3 post NTS injection. (c) Transcription factor activity score, and (d) differential expression of JUN-regulated targets, where blue means downregulated by JUN and red means upregulated by JUN. Differential gene expression analysis was performed using PyDESeq2 combining single-factor analysis using Wald tests with log2 fold-change shrinkage using approximate posterior estimation generalized linear models. Parts of panel a were created using BioRender (https://biorender.com).
Extended Data Fig. 5
Extended Data Fig. 5. c-Jun activity in a rat model of crescentic nephritis.
(a) Percentage of CD44+phospho-c-Jun+ parietal epithelial cells (PECs) among controls, NTS injected day 1 (alone and vehicle) and NTS injected day 1 with a preventive JNK inhibitor (JNKi) administration. (b) Percentage of CD44+phospho-c-Jun+ PECs among NTS injected day 7 (alone), NTS injected d28 (alone and vehicle) and NTS injected day 28 with JNKi administration started at day 7 post NTS injection.
Extended Data Fig. 6
Extended Data Fig. 6. Validation of TRPC6 expression in experimental diabetic kidney disease.
(a) Expression of TRPC6 in normal murine proximal tubuli using immunogold in electron microscopy. This is a representative image from 3 biological replicates. (b) Expression of TRCP6 using Imaging Mass Cytometry in the human kidney (controls and diabetic kidney disease; DKD). These are representative images from 2 biological replicates per condition. (c) Schematic representation of a murine model of obesity and early DKD, showing albuminuria at 24 weeks of age. (d) Increased expression (distributional shift in pixel intensity) of TRPC6 in proximal tubuli in ob/ob mice at 24 weeks of age. Scale bar in (a) represents 250 nm and scale bars in (b) represent 50 µm. Parts of panel c were created using BioRender (https://biorender.com).
Extended Data Fig. 7
Extended Data Fig. 7. Projecting clusters onto histopathology staining.
Histopathological staining allows cluster assignment to exact structural locations. (a) Cluster 0 (ERK-mediated podocyte signaling) and (b) cluster 14 (integrin-mediated nephron signaling). In both cases, cluster abundance was regulated in DKD. ****P < 0.0001. Scale bars represent 100 µm.
Extended Data Fig. 8
Extended Data Fig. 8. Cluster abundance associates with clinical kidney function.
Cluster abundances correlate with clinical renal function (estimated glomerular filtration rate; eGFR). (a) Cluster 11 (impaired distal nephron metabolism) and (b) cluster 39 (dysregulated glucocorticoid receptor signaling). Scale bars represent 100 µm.
Extended Data Fig. 9
Extended Data Fig. 9. Multivariate cluster join counts analysis.
(a) Schematic representation of our approach to characterize direct spatial interactions between neighbouring clusters. (b) Spatial interactions highlight changes in associations across disease states and scales. GR, Glucocorticoid receptor; PTMs, Post-translational modifications; PTs, proximal tubular cells; DT, distal tubule; CD, collecting duct; ER, Endoplasmic reticulum; MVs, microvesicles; ECM, Extra cellular matrix; activ, activation; podo, podocytes; physio, physiology; metab, metabolism; cytoskel, cytoskeletal; ECs, endothelial cells; GECs, glomerular endothelial cells; mTOR, mammalian target of Rapamycin; macro, macrophages; lyso, lysosomes; microtub, microtubules; mechanotrans, mechanotransduction; Cell adh, cell adhesion; Myofib, myofibroblasts.
Extended Data Fig. 10
Extended Data Fig. 10. Condition-specific structural patterns.
(a) Schematic representation of our approach to characterize cluster-cluster predictions using MISTy. (b) Cluster predictions highlight changes across disease states and scales. GR, Glucocorticoid receptor; PTMs, Post-translational modifications; PTs, proximal tubular cells; DT, distal tubule; CD, collecting duct; ER, Endoplasmic reticulum; MVs, microvesicles; ECM, Extra cellular matrix; activ, activation; podo, podocytes; physio, physiology; metab, metabolism; cytoskel, cytoskeletal; ECs, endothelial cells; GECs, glomerular endothelial cells; mTOR, mammalian target of Rapamycin; macro, macrophages; lyso, lysosomes; microtub, microtubules; mechanotrans, mechanotransduction; Cell adh, cell adhesion; Myofib, myofibroblasts.
Extended Data Fig. 11
Extended Data Fig. 11. Image-level pseudotime analysis from cluster mapping using PILOT.
(a) Pseudotime analysis was performed based on our interpretable clusters, identifying a path from controls to diabetic kidney disease (DKD) that correlates with histopathological changes. This path can be separated into two trajectories. (b) Trajectory 1 defined a transition based on estimated glomerular filtration rate (eGFR), marking the range in renal function in our non-diabetic controls. Pseudotime was strongly associated with clusters representing loss of tubular integrity, extracellular matrix remodelling (ECM; fibrosis) and myofibroblast expansion (fibrosis). (c) Trajectory 2 was strongly associated with clusters representing podocyte injury, mitochondrial stress in proximal tubuli (PTs) and glucocorticoid receptor (GR) dysfunction. PILOT uses non-linear regression methods and leverages the Wald test to evaluate the difference in the fitted model for each cluster vs. the model fitted for background clusters.
Extended Data Fig. 12
Extended Data Fig. 12. External validation of DKD features.
(a) Cell types identified via single-cell RNA-sequencing. Even in early diabetic kidney disease, transcripts related to ER stress, Ca2+-mediated tubular injury, integrin beta 1-, and GR-signaling (b), as well as ECM remodelling and pro-fibrotic signaling (c) showed differential gene expression patterns compatible with differences observed at the protein level found in advanced diabetic kidney disease. SGLT2 inhibitor (SGLT2i)-treated patients exhibited incomplete modulation of transcriptomic changes. TAL: Thick ascending limb; PT: Proximal tubule; PC: Principal cell; ECs: Endothelial cells; IC: Intercalated cell; PC/CNT: Principal cells / Connecting tubule; DCT: Distal convoluted tubule; Mes/VSMC/Fib: Mesangial cells/Vascular smooth muscle cells/Fibroblasts; ATL/PEC: Ascending thin limb/Parietal epithelial cells; GECs: Glomerular endothelial cells; Mac/Mono: Macrophages/Monocytes; Lymph: Lymphocytes.

References

    1. Vandereyken, K., Sifrim, A., Thienpont, B. & Voet, T. Methods and applications for single-cell and spatial multi-omics. Nat. Rev. Genet.24, 494–515 (2023). - PMC - PubMed
    1. Moffitt, J. R., Lundberg, E. & Heyn, H. The emerging landscape of spatial profiling technologies. Nat. Rev. Genet.23, 741–759 (2022). - PubMed
    1. Strack, R. Highly multiplexed transcriptome imaging. Nat. Methods12, 486–487 (2015). - PubMed
    1. Angelo, M. et al. Multiplexed ion beam imaging of human breast tumors. Nat. Med.20, 436–442 (2014). - PMC - PubMed
    1. Giesen, C. et al. Highly multiplexed imaging of tumor tissues with subcellular resolution by mass cytometry. Nat. Methods11, 417–422 (2014). - PubMed

LinkOut - more resources