. 2025 Jul 18;30(1):84.
doi: 10.1186/s11658-025-00759-x.

GPD2 inhibition impairs coagulation function via ROS/NF-κB/P2Y12 pathway

Affiliations

GPD2 inhibition impairs coagulation function via ROS/NF-κB/P2Y12 pathway

Jiajie Chen et al. Cell Mol Biol Lett. .

Abstract

Background: Coronary heart disease (CHD) remains a global health threat. As antiplatelet therapy constitutes the cornerstone of CHD management, ticagrelor has been universally endorsed as a first-line agent in major clinical guidelines. However, the therapeutic efficacy of ticagrelor is compromised by interindividual variability in bleeding risk. Notably, while inherited genetic variations account for part of this heterogeneity, the dynamic regulatory role of modifiable epigenetic mechanisms-particularly DNA methylation in mediating platelet reactivity-remains inadequately characterized, presenting a critical knowledge gap in optimizing precision antiplatelet strategies.

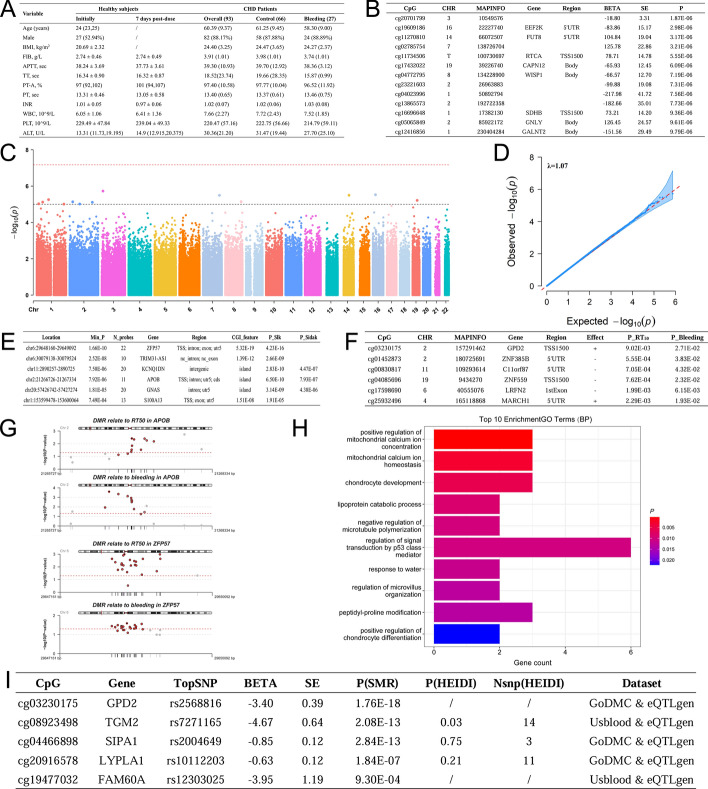
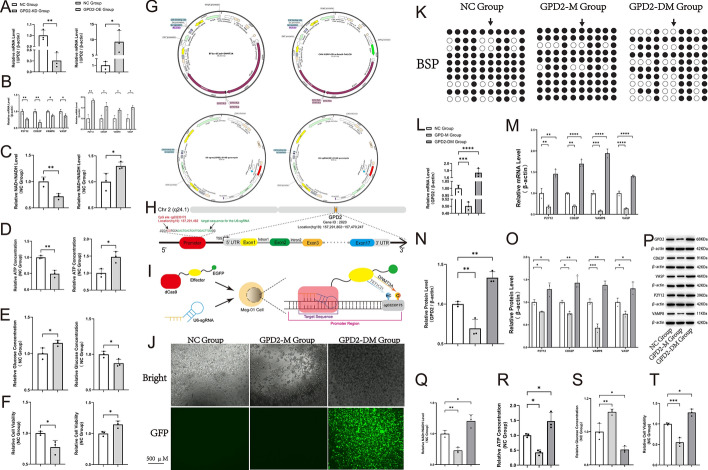
Methods: We utilized the 850k methylation array to measure DNA methylation levels in blood samples from 47 healthy controls and 93 patients with CHD. Subsequently, epigenome-wide association study (EWAS), summary data-based Mendelian randomization (SMR), and heterogeneity in dependent instruments (HEIDI) analyses were applied to pinpoint critical methylation sites that influence gene expression, platelet function recovery, and bleeding risk. After developing a targeted cellular model using the CRISPR-dCas9-DNMT3A/Tet1CD-U6-sgRNA system and integrating with transcriptomic sequencing data, we conducted mechanistic cellular experiments to elucidate how these methylation sites affect platelet function recovery and bleeding risk. The findings were further validated through animal studies.

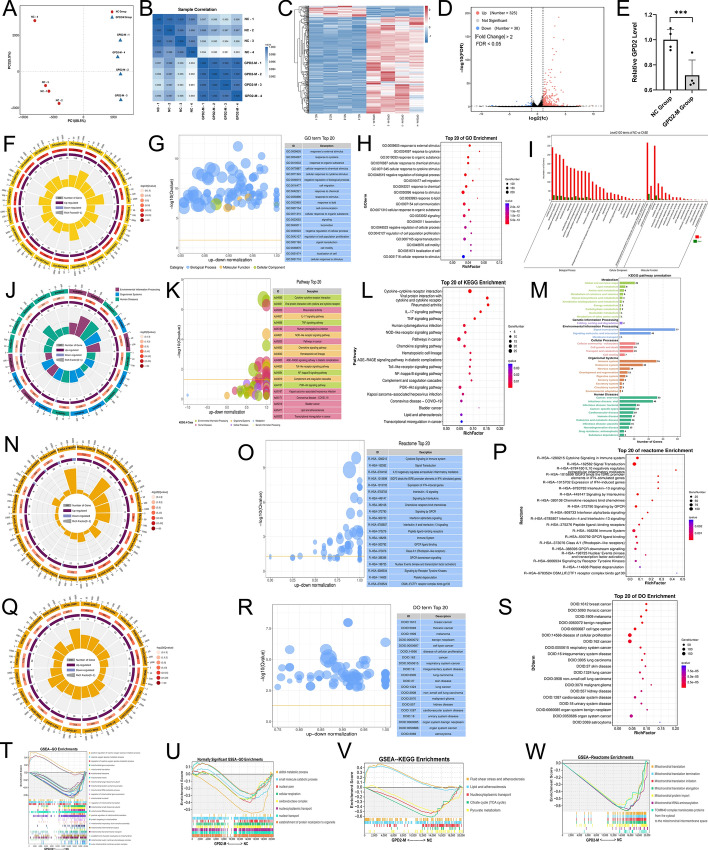
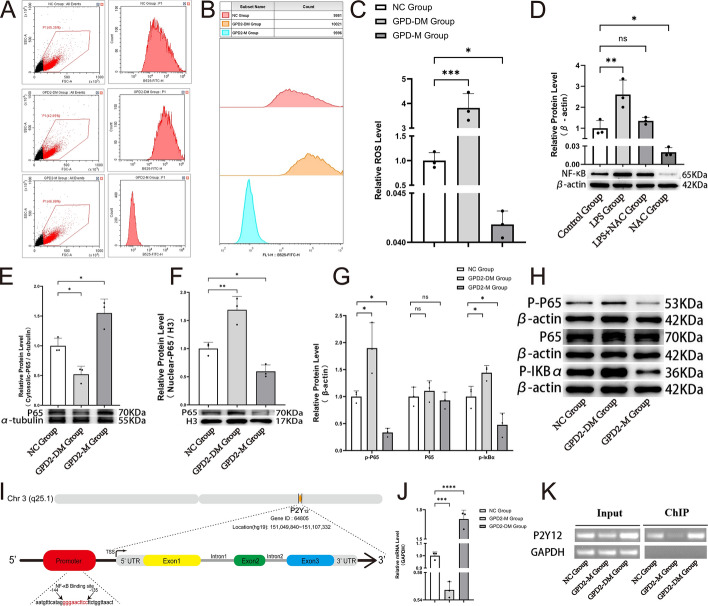
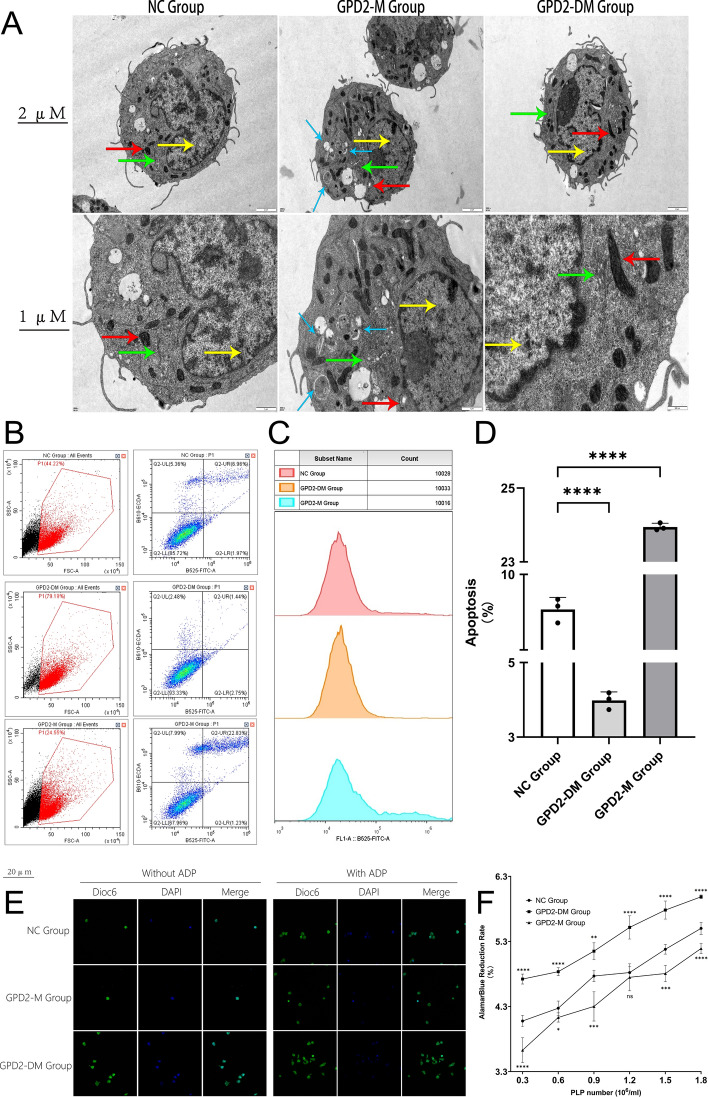
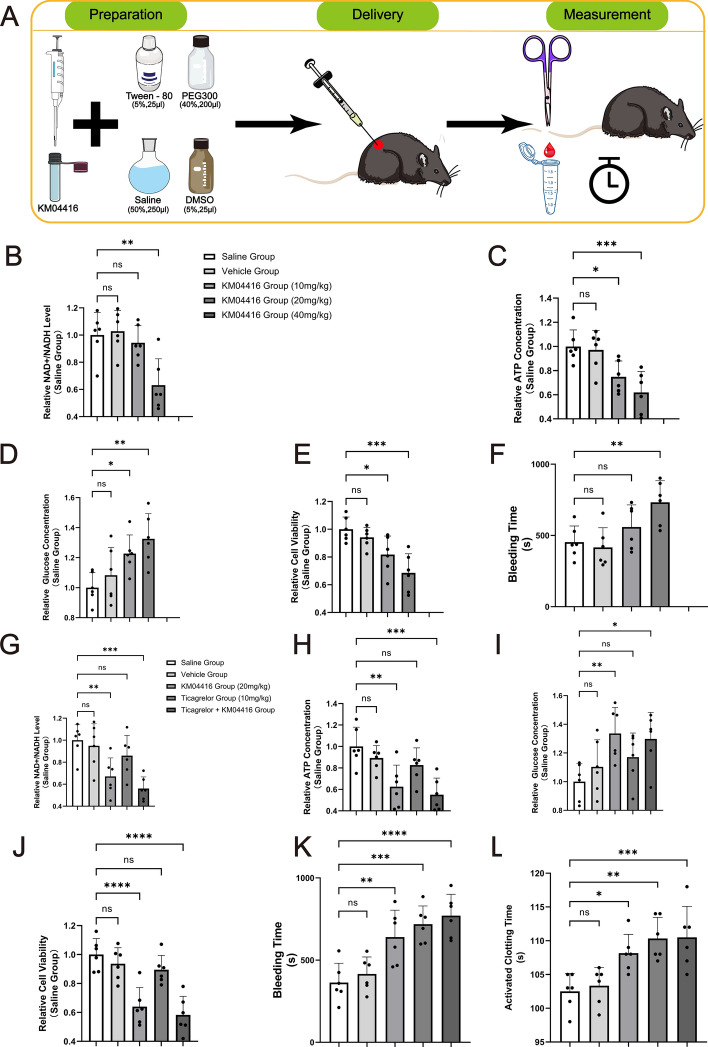
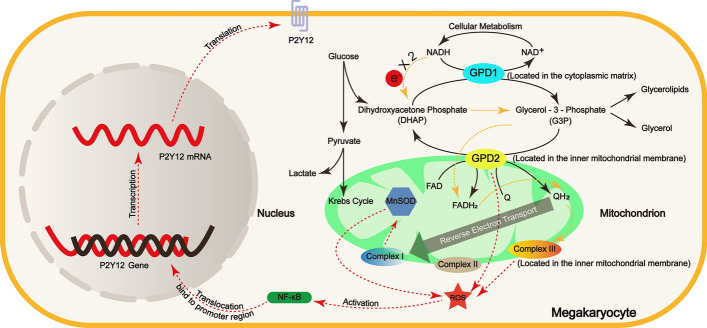
Results: Integrated analysis of EWAS and SMR-HEIDI revealed that hypermethylation at CpG site cg03230175 within the GPD2 gene promoter region was significantly associated with decreased GPD2 gene expression (P = 1.76E-18), delayed platelet functional recovery (P = 9.02 × 10⁻³), and elevated hemorrhagic risk (P = 2.71 × 10⁻²). Transcriptomic studies indicated that GPD2 gene (cg03230175) methylation affects mitochondrial function, nuclear factor kappa B (NF-κB) signaling pathway, reactive oxygen species metabolic process, and G protein-coupled receptor (GPCR) ligand binding. Cellular experiments demonstrated that the GPD2 gene (cg03230175) methylation inhibits coagulation function by suppressing reactive oxygen species (ROS) production, NF-κB activation, and P2Y12 gene expression (P2Y12 receptor plays a pivotal role in platelet activation, thrombus formation, and the pathogenesis of thrombotic disorders). The animal study results confirmed that GPD2 enzyme inhibition can indeed prolong the clotting time in mice.

Conclusions: GPD2 gene (cg03230175) methylation resulted in reduced gene expression levels, inhibited mitochondrial energy metabolism, decreased ROS levels, and affected P2Y12 gene expression through the NF-κB pathway, ultimately leading to inhibition of coagulation function. Registry: The Impact of Genotype on Pharmacokinetics and Antiplatelet Effects of Ticagrelor in Healthy Chinese (IGPPT).

Trial registration number: NCT03092076. Date of Registration: 09 March 2017, retrospectively registered. URL of trial registry record: https://clinicaltrials.gov/ct2/show/NCT03092076 .

Keywords: DNA methylation; Epigenetic mechanism; GPD2; NF-κB; P2Y12; ROS.


Conflict of interest statement

Declarations. Ethics approval and consent to participate: The Ethics Review Committee of Guangdong Provincial People’s Hospital approved our human and animal studies (no. GDREC:KY2023-090-02) on 10 March 2023, in compliance with the “Ethical Review Measures for Biomedical Research Involving Human Subjects” and “Guidance on the Humane Treatment of Laboratory Animals” issued by the Ministry of Science and Technology of China, as well as relevant international animal welfare guidelines and regulations (including the ICLAS statement). Our research strictly adhered to the Declaration of Helsinki and other applicable guidelines. The study was registered with ClinicalTrials.gov (NCT03092076) and was strictly conducted in accordance with the relevant provisions of the Declaration of Helsinki and received approval from the Medical Research Ethics Committee of Guangdong Provincial People’s Hospital (no. GDREC2015143H(R1) and no. GDREC2017071H). Each patient was fully informed of the details of the research and the entire process. Furthermore, written informed consent was obtained from all participants (no. 20150115 and no.20170211). Competing interests: The authors declare that they have no competing interests.

Figures

Fig. 1
Fig. 1
Flowchart of the study
Fig. 2
Fig. 2
The results of EWAS. A Baseline characteristics of the study population. B EWAS results for RT50 and annotation information. MAPINFO: chromosomal coordinates of the CpG (build 37); Region: gene region feature category describing the CpG position from UCSC; TSS200: 0–200 bases upstream of the transcriptional start site (TSS); TSS1500: 200–1500 bases upstream of the TSS, 5′UTR: within the 5′ untranslated region between the TSS and the ATG start site; Body: between the ATG and stop codon; irrespective of the presence of introns, exons, TSS, or promoters; 3′UTR: between the stop codon and poly A signal. C Manhattan plot of EWAS results for RT50. Each dot represents a CpG site. The red dashed line denotes the significance threshold after Bonferroni correction, which is P = 6.74 × 10−8, whereas the black dashed line signifies the threshold at P = 1 × 10−5. D QQ plots of EWAS results for RT50. Each dot represents a CpG site. E The DMR results of RT50 and annotation information. Slk_P: uncorrected Stouffer–Liptak–Kechris p values; Sidak_P: p values corrected for multiple testing are reported. F The CpG sites that are in the promoter region and have the same effect on RT50 and bleeding risk. P_RT50: p value for RT50; P_Bleeding: p value for bleeding risk. G DMRs associated with RT50 and bleeding risk. The red dashed line represents the threshold of nominal significance, p = 0.05. Each red dot indicates a CpG site within DMRs. The purple dots represent the CpG sites with the most significant associations with the phenotype within DMRs. H The top 10 GO enrichments of key CpG sites. A more intense red color indicates a smaller p-value. I The pleiotropic associations between CpG sites and annotated genes. P(SMR): p-value from SMR; P(HEIDI): p-value from HEIDI test; Nsnp(HEIDI): number of single-nucleotide polymorphisms (SNPs) used in the HEIDI test
Fig. 3
Fig. 3
Upon knockdown, overexpression, methylation, or demethylation of the GPD2 gene, significant alterations were observed in indices related to coagulation function and energy metabolism. A The relative expression level of the GPD2 gene. B The relative expression levels of genes associated with clotting. C The relative NAD+/NADH levels. D The relative intracellular ATP concentration. E The relative glucose concentration in medium. F The relative cell viability. G Schematic diagram of the CRISPR-dCas9-DNMT3A/TET1CD-U6-sgRNA system. H Schematic diagram showing the U6-sgRNA recognition position in the GPD2 gene promoter. I Schematic description of targeted methylation or demethylation via the CRISPR-dCas9-DNMT3A/TET1CD-U6-sgRNA system. J Fluorescence microscopy images. Cells emitting green fluorescence observed under green fluorescent protein (GFP) mode are deemed successfully infected. K Bisulfite sequencing. Hollow circles represent nonmethylated CpG, whereas solid circles represent methylated CpG motif. The black arrow points to the cg03230175 site. Each row represents an individual clone. L, M The relative messenger RNA (mRNA) levels of GPD2 gene and indicators associated with clotting. NP The relative protein levels of GPD2 and indicators associated with clotting after methylation or demethylation of GPD2 gene. Q The relative NAD+/NADH level. R The relative intracellular ATP concentration. S The relative glucose concentration in medium. T The relative cell viability
Fig. 4
Fig. 4
The results of bulk RNA-seq. A PCA plot. B Correlation heatmap. C Complex heatmap. Red indicates upregulated genes, whereas blue represents downregulated genes. D Volcano plot. E Statistical chart of GPD2 gene expression; F GO enrichment circle plot. First circle: The top 20 enriched GO terms, with the scale for the number of DEGs on the outside. Different colors represent different ontologies. Second circle: The number of DEGs enriched in the GO term, along with the Q-value. The longer the bar, the more genes, and the redder the color, the smaller the Q-value. Third circle: bar graph of the proportion of upregulated and downregulated DEGs. Dark purple represents the proportion of upregulated genes, while light purple represents the proportion of downregulated genes; specific values are shown below. Fourth circle: the rich factor for each GO term, with background grid lines, each increment representing 0.1; G GO bubble plot. The y-axis represents −log10(Q-value), and the x-axis denotes the z-score value. The yellow line indicates the threshold at Q = 0.05. On the right is a list of the top 20 GO terms by Q-value. Different colors represent different ontologies; H GO enrichment bubble plot. The chart is constructed using the top 20 GO terms with the lowest Q-values. The y-axis represents the GO terms, and the x-axis indicates the rich factor. A larger bubble represents a greater number of genes, and the redder color means a smaller Q-value; I GO categorical bar chart. The x-axis represents secondary GO terms, and the y-axis indicates the number of DEGs within each term, with different colors denoting different GO terms. J KEGG enrichment circle plot. K KEGG bubble plot. L KEGG enrichment bubble plot. M KEGG categorical bar plot. The bold font on the y-axis indicates the KEGG_A level classification information, while the other colored fonts represent the B_level classification information. The x-axis shows the number of DEGs enriched in the pathway. N Reactome enrichment circle plot. O Reactome bubble plot. P Reactome enrichment bubble plot. Q DO enrichment circle plot. R DO bubble plot. S DO enrichment bubble plot. T GSEA-GO ES plot, this plot illustrates the enrichment score (ES) for the gene set associated with the GO term along the ranked list of genes. A positive ES value indicates that the gene expression associated with the GO term is upregulated in the GPD2-M group. Conversely, a negative ES value signifies downregulation. U GSEA-GO ES plot of GO terms centered around the GPD2 gene. V GSEA-KEGG ES plot. W GSEA-reactome ES plot
Fig. 5
Fig. 5
GPD2 gene (cg03230175) methylation modulates intracellular ROS levels, which can influence P2Y12 gene expression by modulating the activation of NF-κB. NF-κB p65 binding to the P2Y12 promoter was determined by ChIP assay. A Flow cytometric analysis. The left panel shows a scatter plot of all events, highlighting P1 region. The right panel presents a histogram of fluorescence intensity for the B525-FITC-H channel within the P1 gate. B Summary flow cytometric analysis of cells from the three groups. Each panel represents the fluorescence intensity histograms for each group. C Statistical analysis bar plot of ROS levels. The ROS levels in each group are shown. Data expressed as mean ± standard error on the mean (SEM), n = 3. D Statistical chart of the relative NF-κB p65 protein levels after various interventions, accompanied by Western blot analysis. E Statistical chart of relative cytosolic NF-κB p65 protein level, accompanied by Western blot analysis. F Statistical chart of relative nuclear NF-κB p65 protein level, accompanied by Western blot analysis. G, H Statistical chart and Western blot analysis of relative levels of phosphorylated P65 (p-P65), total P65, and phosphorylated IκBα (p-IκBα) proteins. I Schematic diagram showing the NF-κB binding position in the P2Y12 promoter. J Statistical bar graph of the relative mRNA levels. K Gel electrophoresis banding pattern compares mRNA levels under input and ChIP conditions across the same three groups. The right panel shows the amplification of the P2Y12 promoter region containing the NF-κB binding motif after ChIP from MEG-01 cells, and the left panel shows the total DNA input. GAPDH was used as a control to demonstrate precipitation specificity
Fig. 6
Fig. 6
The methylation status of the GPD2 gene (cg03230175) affects mitochondrial morphology, apoptosis, and number and aggregation of platelet-like particles (PLPs). A Transmission electron microscopy image. Yellow arrows indicate the nucleus; red arrows indicate mitochondria; green arrows indicate the endoplasmic reticulum; black arrows indicate autophagosomes. B, C Flow cytometry analysis of cell apoptosis via annexin V/propidium iodide (PI) staining. D Statistical analysis bar plot of apoptotic cells. The proportion of apoptotic cells in each group is shown. Data expressed as mean ± SEM, n = 3. E Laser scanning confocal microscopy image. Representation of PLPs observed under a laser scanning confocal microscope in each group. F Statistical analysis line graph. The relative fluorescence intensity of PLPs across each group at varying PLPs concentrations. Data presented as mean ± SEM, n = 6
Fig. 7
Fig. 7
The GPD2 enzyme regulates coagulation function by affecting the mitochondrial energy metabolism process. A Illustrative diagram of the process of animal experiments. DMSO (5%) serves as the primary solvent and penetration enhancer; 40% PEG300 enhances drug solubility; 5% Tween-80 acts as a surfactant; 50% saline ensures physiological compatibility. B Relative NAD+/NADH levels in mice following injection of KM04416. C Relative ATP concentration in mice following injection of KM04416. D Relative glucose concentration in mice following injection of KM04416. E Relative cell viability in mice following injection of KM04416. F Tail-clip bleeding time in mice after the injection of KM04416. G Relative NAD+/NADH levels in mice following injection of KM04416 or ticagrelor. H Relative ATP concentration in mice following injection of KM04416 or ticagrelor. I Relative glucose concentration in mice following injection of KM04416 or ticagrelor. J Relative cell viability in mice following injection of KM04416 or ticagrelor. K Tail-cut bleeding time in mice after the injection of KM04416 or ticagrelor. L Activation clotting time in mice after the injection of KM04416 or ticagrelor
Fig. 8
Fig. 8
Graphical summary of the role of GPD2 in coagulation function. The solid black lines in the figure indicate normal metabolic processes. The dashed yellow line depicts the electron transfer pathway. The red dotted line illustrates the route through which the GPD2 enzyme influences blood clotting function

References

    1. Levine GN, Bates ER, Bittl JA, Brindis RG, Fihn SD, Fleisher LA, Granger CB, Lange RA, Mack MJ, Mauri L, Mehran R, Mukherjee D, Newby LK, O’Gara PT, Sabatine MS, Smith PK, Smith SC Jr. 2016 ACC/AHA guideline focused update on duration of dual antiplatelet therapy in patients with coronary artery disease: a report of the American College of Cardiology/American Heart Association Task Force on Clinical Practice Guidelines. J Am Coll Cardiol. 2016;68(10):1082–115. 10.1016/j.jacc.2016.03.513. - PubMed
    1. Corbett SJ, Ftouh S, Lewis S, Lovibond K, Guideline Committee. Acute coronary syndromes: summary of updated NICE guidance. BMJ. 2021;372:m4760. 10.1136/bmj.m4760. - PubMed
    1. Kamran H, Jneid H, Kayani WT, Virani SS, Levine GN, Nambi V, Khalid U. Oral antiplatelet therapy after acute coronary syndrome: a review. JAMA. 2021;325(15):1545-1555. 10.1001/jama.2021.0716. Erratum in: JAMA. 2021 Jul 13;326(2):190. 10.1001/jama.2021.9484. - PubMed
    1. Wallentin L, Becker RC, Budaj A, Cannon CP, Emanuelsson H, Held C, Horrow J, Husted S, James S, Katus H, Mahaffey KW, Scirica BM, Skene A, Steg PG, Storey RF, Harrington RA, Freij A, Thorsén M, PLATO Investigators. Ticagrelor versus clopidogrel in patients with acute coronary syndromes. N Engl J Med. 2009;361(11):1045–57. 10.1056/NEJMoa0904327. - PubMed
    1. Valgimigli M, Bueno H, Byrne RA, Collet JP, Costa F, Jeppsson A, Jüni P, Kastrati A, Kolh P, Mauri L, Montalescot G, Neumann FJ, Petricevic M, Roffi M, Steg PG, Windecker S, Zamorano JL, ESC Scientific Document Group, ESC Committee for Practice Guidelines (CPG), ESC National Cardiac Societies. 2017 ESC focused update on dual antiplatelet therapy in coronary artery disease developed in collaboration with EACTS: the task force for dual antiplatelet therapy in coronary artery disease of the European Society of Cardiology (ESC) and of the European Association for Cardio-Thoracic Surgery (EACTS). Eur Heart J. 2018;39(3):213–60. 10.1093/eurheartj/ehx419. - PubMed

Associated data