. 2025 Jul 18;23(1):346.
doi: 10.1186/s12964-025-02340-7.

MIR4726EccDNA drives bortezomib resistance in multiple myeloma by enhancing MIR4726-5p/NXF1/NKIRAS2 axis dependent autophagy

Affiliations

MIR4726EccDNA drives bortezomib resistance in multiple myeloma by enhancing MIR4726-5p/NXF1/NKIRAS2 axis dependent autophagy

Fangfang Li et al. Cell Commun Signal. .

Abstract

Background: Despite many new drugs, multiple myeloma (MM) remains an incurable plasma cell malignancy, and drug resistance is a long-standing topic in this field. Characterized by efficient transcription without being limited by the double helix structure and promoter, extrachromosomal circular DNA (EccDNA) has been proven to be widely involved in cancer development and drug resistance.

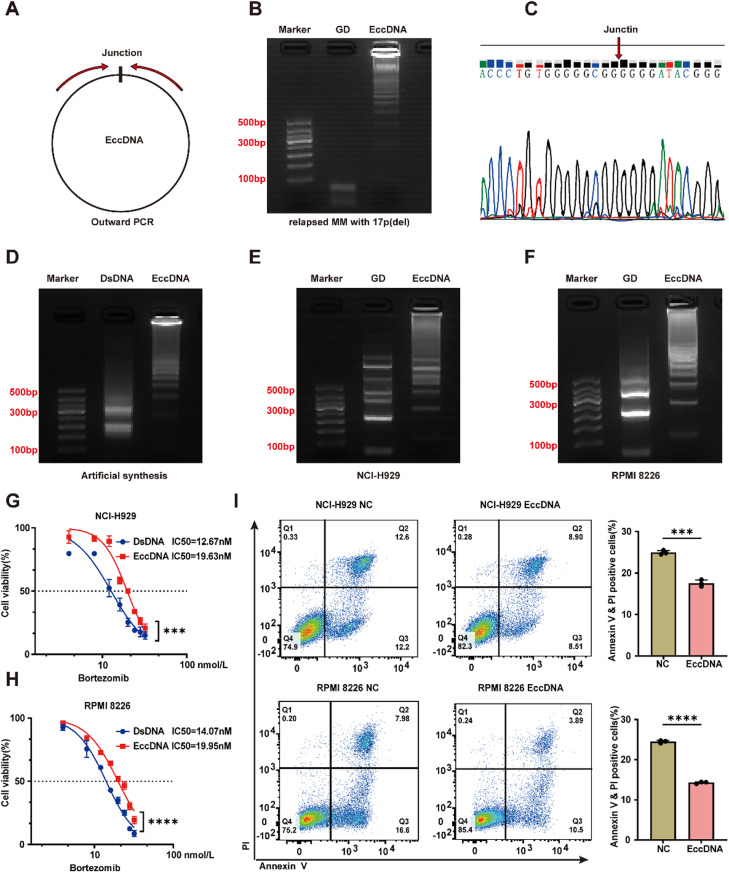
Methods: We performed circle-seq and mRNA-seq on samples from three MM patients at the time of complete response and relapse to screen EccDNA candidate molecules. Outward PCR and Sanger sequencing were used to identify EccDNA molecules. RT‒qPCR and WB were performed to detect gene expression levels. Fluorescence in situ hybridization (FISH) was carried out to detect the deletion of chromosome 17p (del (17p)). Transmission electron microscopy (TEM) was conducted to observe autophagosomes. Luciferase reporter assays were performed to validate the binding of microRNAs to target genes. Cell viability assays and apoptosis assays were employed to assess drug resistance. Xenograft tumor mouse models were established for in vivo experiments. Immunohistochemistry (IHC) was used to detect protein expression levels.

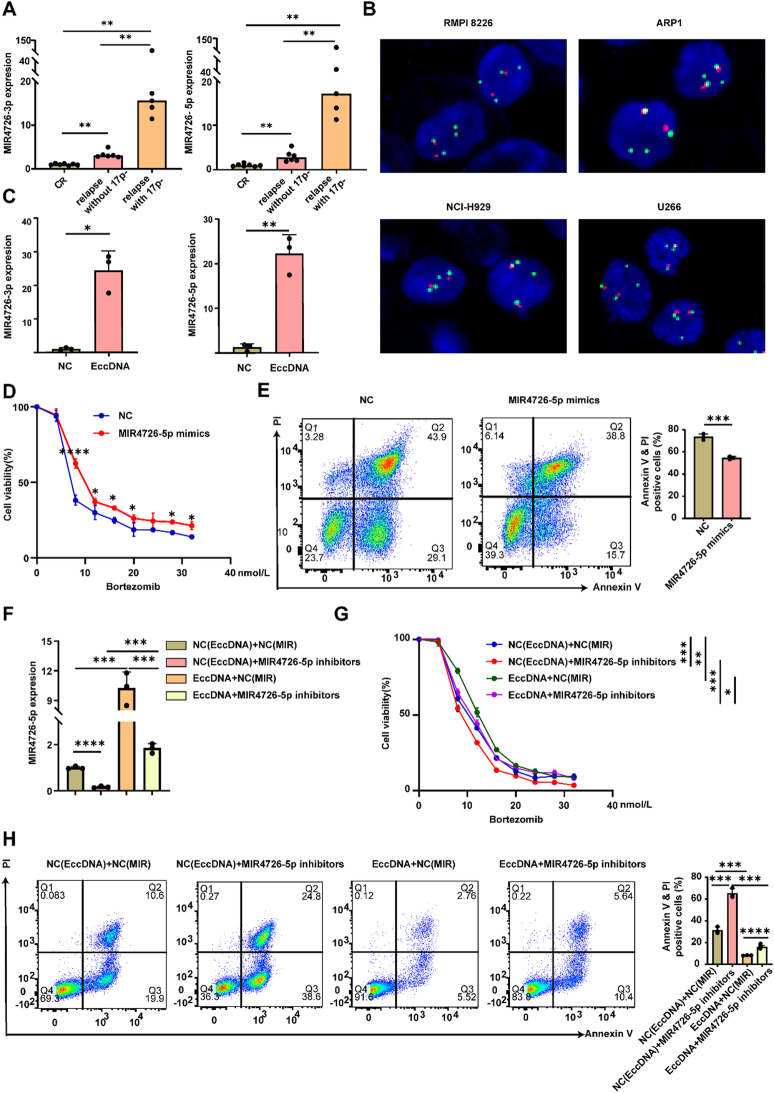
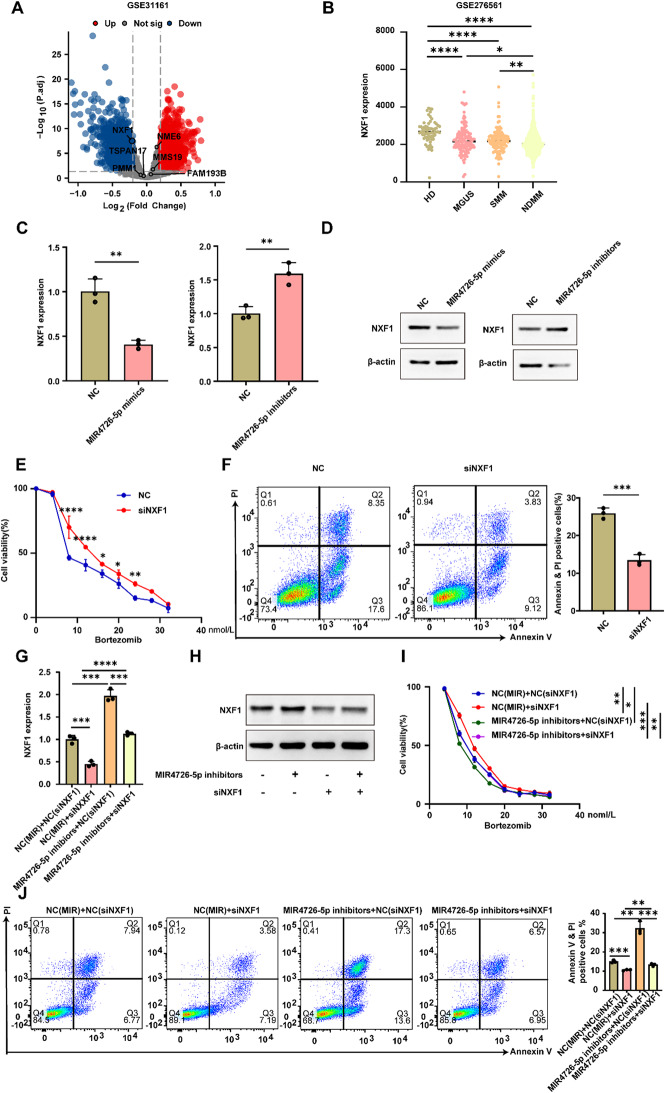
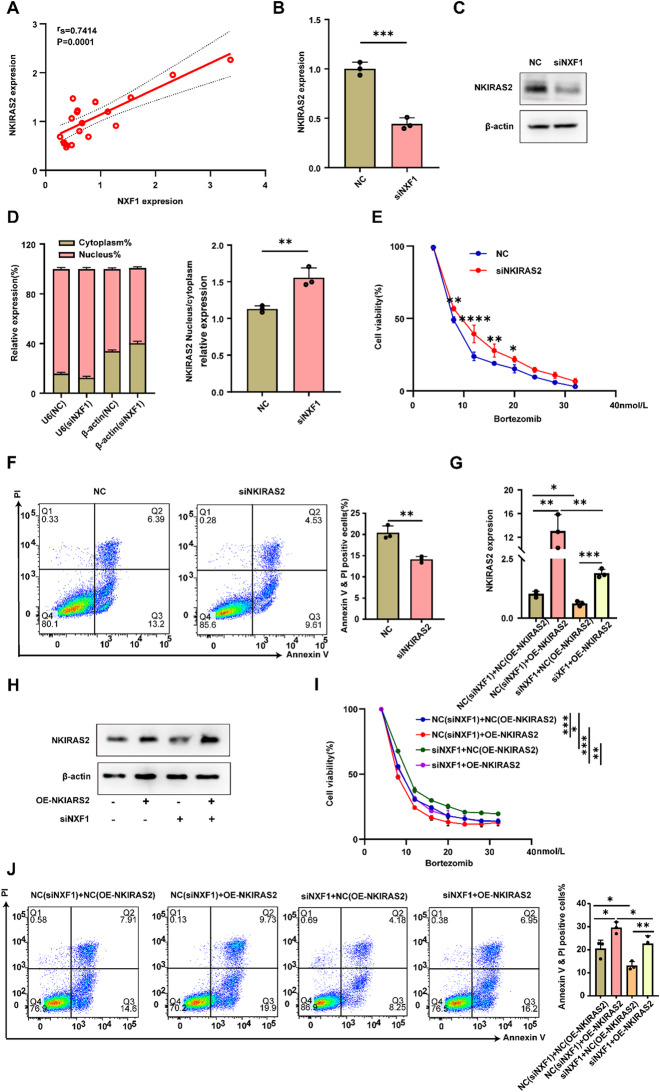
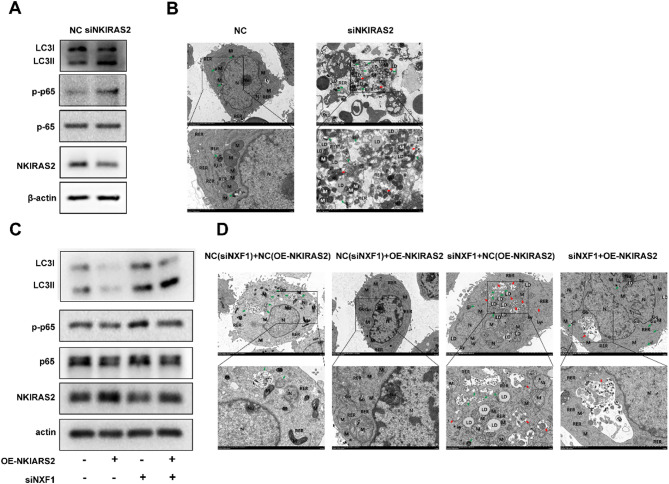
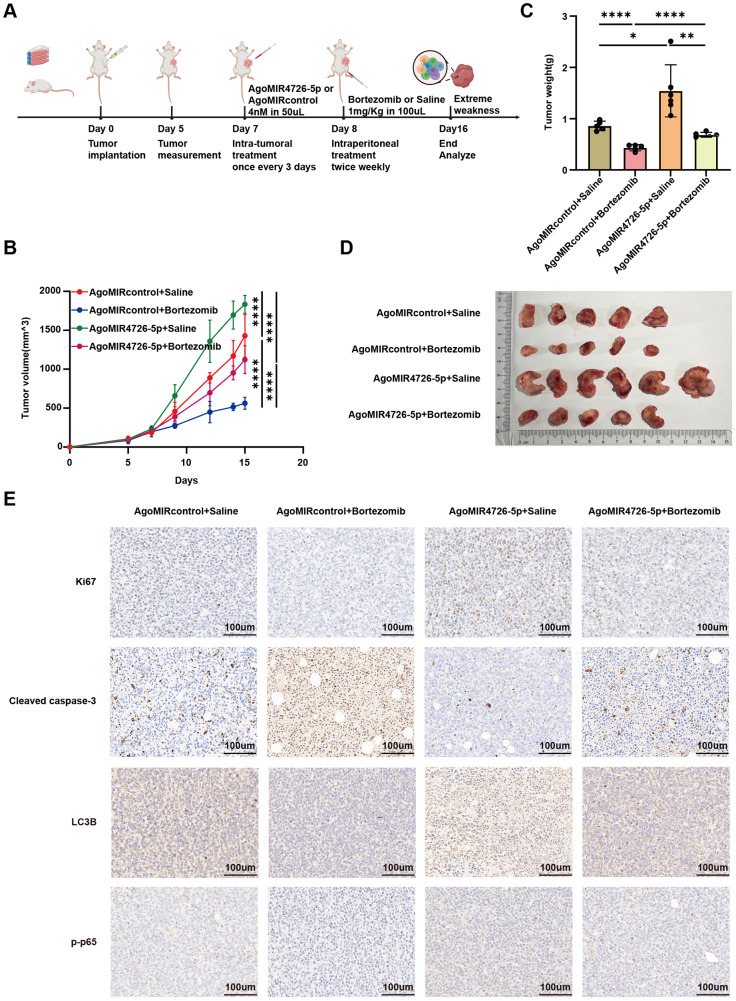
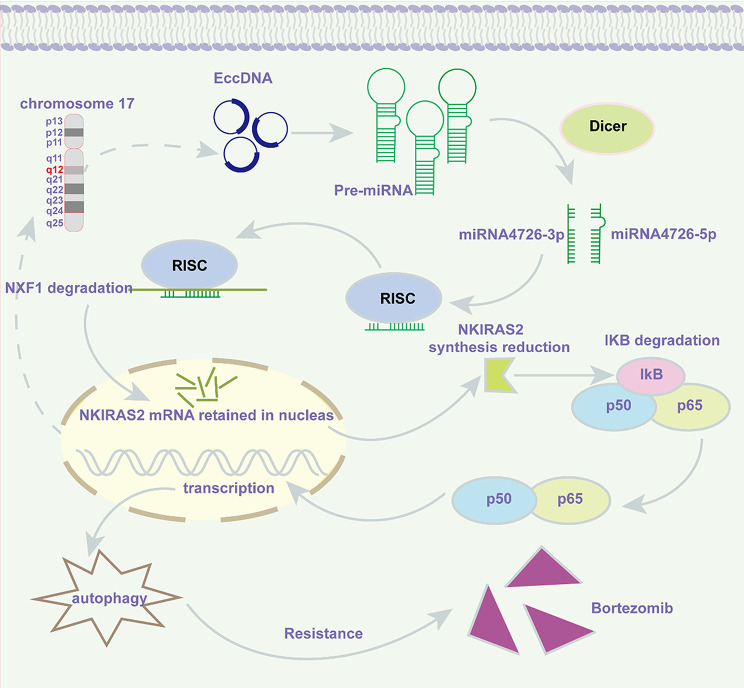
Results: We successfully identified an EccDNA molecule (EccDNAchr17:38719676-38719812) in one relapsed MM patient with del(17p) and named it MIR4726EccDNA. We demonstrated that the overexpression of MIR4726EccDNA in MM cells can increase bortezomib resistance. We further confirmed that the precursor miRNA carried by MIR4726EccDNA can be efficiently transcribed in MM cells and that MIR4726EccDNA drives bortezomib resistance via the MIR4726-5p/NXF1/NKIRAS2 axis. We further revealed that downregulation of NFKB inhibitor interacting Ras like 2 (NKIRAS2) activated the NF-κB pathway and increased autophagy. Moreover, we established a xenograft model of human MM via subcutaneous inoculation. We administered intra-tumoral injection of AgoMIR4726-5p and intraperitoneal injection of bortezomib and found that AgoMIR4726-5p promoted tumor progression and partially drove bortezomib resistance.

Conclusions: In summary, our findings indicate that artificially synthesized MIR4726EccDNA is functional in cells and that MIR4726EccDNA enhances tumor progression and partially mediates drug resistance by enhancing MIR4726-5p/NXF1/NKIRAS2 axis dependent autophagy.

Keywords: Autophagy; Bortezomib; Extrachromosomal circular DNA (EccDNA); MIR4726-5p; Multiple myeloma; NKIRAS2; NXF1.


Conflict of interest statement

Declarations. Ethics approval and consent to participate: This research was approved by the Ethics Committee of Central South University (CSU-2024-0341), and written informed consent was obtained from all patients before enrollment in the research program. Consent for publication: Not applicable. Competing interests: The authors declare no competing interests.

Figures

Fig. 1
Fig. 1
MIR4726EccDNA drives bortezomib resistance in MM cells. A Schematic illustrating outward PCR. B. Agarose electrophoresis gel images for the outward PCR products of GD or EccDNA in the relapsed MM with del(17p). C. Sanger sequencing results of the outward PCR products to identify the MIR4726EccDNA junction site. D‒F. Agarose electrophoresis gel images of the outward PCR products of the artificially synthesized dsDNA or EccDNA (D) and the outward PCR products of GD or EccDNA in EccDNA-transfected NCI-H929 cells (E) and RPMI 8226 cells (F). G-H NCI-H929 cells and RPMI 8226 cells were transfected with dsDNA or EccDNA for 24 h, followed by treatment with a series of bortezomib concentrations for another 24 h. A cell viability assay was subsequently performed, and the IC50 was calculated. I NCI-H929 cells and RPMI 8226 cells were transfected with dsDNA or EccDNA for 24 h, followed by treatment with 10 nmol/L bortezomib for another 24 h. Then, an apoptosis assay was performed. DsDNA: Double-stranded linear DNA. GD: Genomic DNA. NC: Negative control. Student’s t test was applied to calculate statistical significance: *p < 0.05; **p < 0.01; *** p < 0.001. ****p < 0.0001
Fig. 2
Fig. 2
MIR4726EccDNA drives bortezomib resistance by upregulating MIR4726-5p. A qPCR analysis of MIR4726-3p and MIR4726-5p expression was performed in 18 MM patients, including 7 in complete response, 6 in relapse without del(17p), and 5 in relapse with del(17p). B FISH images of del(17p) in 4 MM cell lines (NCI-H929, RPMI 8226, ARP1 and U266). C qPCR analysis of MIR4726-3p and MIR4726-5p expression in the negative control or MIR4726EccDNA-transfected NCI-H929 cells. D-E NCI-H929 cells were transfected with negative control or MIR4725-5p mimics for 24 h, followed by treatment with 10 nmol/L bortezomib for another 24 h. Then, cell viability (D) and apoptosis (E) assays were performed. F qPCR analysis of MIR4726-5p expression in NCI-H929 cells co-transfected with MIR4726EccDNA, MIR4726-5p inhibitors or a negative control for 24 h. G-H After co-transfection with MIR4726EccDNA, MIR4726-5p inhibitors or the negative control for 24 h, NCI-H929 cells were treated with 10 nmol/L bortezomib for another 24 h. Then, cell viability (G) and apoptosis (H) were measured. NC: Negative control. Student’s t test and two-way ANOVA were applied to calculate statistical significance: *p < 0.05; **p < 0.01; *** p < 0.001. ****p < 0.0001
Fig. 3
Fig. 3
MIR4726-5p mediates bortezomib resistance by targeting NXF1. A NXF1 expression in the MM (relapse vs. baseline) dataset (GSE31161). B NXF1 expression in healthy donors (HDs), monoclonal gammopathy of undetermined significance (MGUS), smoldering MM (SMM) and newly diagnosed MM (NDMM) patients in the GSE276561 dataset. C‒D NXF1 expression in NCI-H929 cells transfected with the negative control, MIR4726-5p mimics or MIR4726-5p inhibitors, as determined by qPCR (C) and WB (D). E-F RPMI 8226 cells were transfected with negative control or siNXF1 and incubated for 24 h, followed by treatment with 10 nmol/L bortezomib for another 24 h. Then, cell viability (E) and apoptosis (F) assays were performed. G‒H qPCR (G) and WB (H) analyses of NXF1 expression in RPMI 8226 cells co-transfected with MIR4726-5p inhibitors, siNXF1 or the negative control for 24 h. I‒J After co-transfection with MIR4726-5p inhibitors, siNXF1 or the negative control for 24 h, RPMI 8226 cells were treated with 10 nmol/L bortezomib for another 24 h. Then, cell viability (I) and apoptosis (J) were measured. NC: Negative control. Student’s t test and two-way ANOVA were applied to calculate statistical significance: *p < 0.05; **p < 0.01; *** p < 0.001. ****p < 0.0001
Fig. 4
Fig. 4
NXF1 downregulation enhances bortezomib resistance by increasing the nuclear retention of NKIRAS2. A Correlation between NXF1 and NKIRAS2 expression in 21 MM patients, including 10 newly diagnosed MM (NDMM), 6 in relapse without del(17p), and 5 in relapse with del(17p), was determined via qPCR analysis. B-C NKIRAS2 expression in negative control or siNXF1-transfected RPMI 8226 cells, as determined by qPCR (B) and WB (C). D The nucleus/cytoplasm ratio of NKIRAS2 expression in siNXF1-transfected RPMI 8226 cells was determined via qPCR analysis; U6 is located mainly in the nucleus, whereas β-actin is located mainly in the cytoplasm and is a marker for successful nuclear and cytoplasmic RNA separation. E-F RPMI 8226 cells were transfected with negative control or siNKIRAS2 for 24 h, followed by treatment with 10 nmol/L bortezomib for another 24 h. Then, cell viability (E) and apoptosis (F) assays were performed. G-H, qPCR (G) and WB (H) analyses of NKIRAS2 expression in RPMI 8226 cells co-transfected with siNXF1, OE-NKIRAS2 plasmids or negative control for 24 h. I‒J After co-transfection with siNXF1, OE-NKIRAS2 plasmids or the negative control for 24 h, RPMI 8226 cells were treated with 10 nmol/L bortezomib for another 24 h. Then, cell viability (I) and apoptosis (J) were measured. NC: Negative control. Student’s t test and two-way ANOVA were applied to calculate statistical significance: *p < 0.05; **p < 0.01; *** p < 0.001. ****p < 0.0001
Fig. 5
Fig. 5
Downregulation of NKIRAS2 induced activation of the NF-κB pathway and increased autophagy. A LC3I, LC3II, p-p65, p65, and NKIRAS2 expression by WB in negative control or siNKIRAS2-transfected RPMI 8226 cells. B After treatment with 10 nmol/L bortezomib for 24 h, the autophagosomes in the RPMI 8226 WT and siNKIRAS2 cells were analyzed via TEM. C LC3I, LC3II, p-p65, p65, and NKIRAS2 expression in siNXF1-, OE-NKIRAS2 plasmids- or negative control-transfected RPMI 8226 cells as determined by WB. D After treatment with 10 nmol/L bortezomib for 24 h, TEM analysis of autophagosomes in siNXF1-, OE-NKIRAS2- or negative control-transfected RPMI 8226 cells was performed. NC: Negative control. Cell nucleus (N); Nucleolus (Nu); Mitochondria (M); Rough endoplasmic reticulum (RER); Lipid droplets (LD); Lysosomes (Ly); Autophagic lysosomes (↑); Autophagosome (↑); Golgi apparatus (Go)
Fig. 6
Fig. 6
AgoMIR4726-5p promotes MM progression and reduces the antitumor effect of bortezomib in vivo. A Flow chart for the in vivo experiment (created with bioRender.com, with permission). B Tumor volume was calculated with the formula (length × width2)/2, and length and width were measured with electronic calipers. The frequency of measurements was adjusted according to the tumor growth rate. C Weights of the tumors at the end of the study. D Photographs of all mouse tumors in the four groups. E Representative immunohistochemical analysis of Ki67, LC3B, p-p65, and cleaved caspase 3 in tumors from the 4 groups of mice
Fig. 7
Fig. 7
A schematic model of how MIR4726EccDNA drives bortezomib resistance by enhancing MIR4726-5p/NXF1/NKIRAS2 axis dependent autophagy. MIR4726EccDNA derived from 17q12 is efficiently transcribed into MIR4726 in cells. MIR4726-5p downregulates NKIRAS2 expression by targeting NXF1, leading to the nuclear retention of NKIRAS2. As a negative regulator of the NF-κB pathway, the decreased expression of NKIRAS2 activated the NF-κB pathway, which in turn promoted the transcription of autophagy-related genes, increased autophagy, and mediated bortezomib resistance

Similar articles

References

    1. Liu W, Liu J, Song Y, Wang X, Zhou M, et al. Mortality of lymphoma and myeloma in china, 2004–2017: an observational study. J Hematol Oncol. 2019;12(1):22. - PMC - PubMed
    1. Wang S, Xu L, Feng J, Liu Y, Liu L, Wang J, et al. Prevalence and incidence of multiple myeloma in urban area in china: A National Population-Based analysis. Front Oncol. 2020;9:1513. - PMC - PubMed
    1. Van De Donk NWCJ, Pawlyn C, Yong KL. Multiple myeloma. Lancet. 2021;397(10272):410–27. - PubMed
    1. Avet-Loiseau H, Li C, Magrangeas F, Gouraud W, Charbonnel C, Harousseau JL, et al. Prognostic significance of Copy-Number alterations in multiple myeloma. JCO. 2009;27(27):4585–90. - PMC - PubMed
    1. Chng WJ, Dispenzieri A, Chim CS, Fonseca R, Goldschmidt H, Lentzsch S, et al. IMWG consensus on risk stratification in multiple myeloma. Leukemia. 2014;28(2):269–77. - PubMed

MeSH terms

LinkOut - more resources