. 2025 Jul 18;44(1):211.
doi: 10.1186/s13046-025-03463-y.

SNRPB/CCNB1 axis promotes hepatocellular carcinoma progression and cisplatin resistance through enhancing lipid metabolism reprogramming

Affiliations

SNRPB/CCNB1 axis promotes hepatocellular carcinoma progression and cisplatin resistance through enhancing lipid metabolism reprogramming

Xin Jin et al. J Exp Clin Cancer Res. .

Abstract

Background: Hepatocellular carcinoma (HCC) is a major cause of cancer-related mortality globally, significantly impacting worldwide health. Hence, identifying key molecular drivers of HCC progression is crucial for enhancing treatment options and prognostic methods. This study explores the function of Small Nuclear Ribonucleoprotein Polypeptides B and B1 (SNRPB) in HCC, unveiling critical pathways that affect the progression of the disease.

Methods: Utilizing multi-dimensional data that integrates bulk RNA sequencing (bulk RNA-seq), single-cell RNA sequencing (scRNA-seq), and spatial transcriptomics (ST) from HCC patients, we have identified SNRPB as a pivotal gene associated with the spliceosome, playing a central role in both tumor initiation and progression. We also investigated the intricate process by which SNRPB influences cyclin B1 (CCNB1) expression through FOXM1-mediated activation, using a combination of bioinformatics, functional assays, Chromatin Immunoprecipitation (ChIP), and Co-Immunoprecipitation (Co-IP) studies. Complementary in vivo experiments and metabolic assays were conducted to explore the relationship between tumor growth and lipid metabolism further. Additionally, evaluations of cisplatin sensitivity were performed, providing an in-depth analysis of influence of SNRPB on HCC.

Results: Across multiple cohorts, SNRPB exhibited a marked upregulation within tumors, correlating significantly with poor prognosis. Knockdown of SNRPB suppressed HCC cell proliferation and migration, while promoting apoptosis. Mechanistically, SNRPB regulated CCNB1 expression via FOXM1-mediated transcription, and SNRPB overexpression enhanced lipid metabolism and cisplatin resistance. This increase in drug sensitivity was mediated through alterations in lipid metabolism and the regulatory effects on CCNB1, providing a comprehensive insight into multifaceted role of SNRPB in HCC pathology and potential therapeutic targets. Finally, CCNB1 knockdown reversed the proliferative and tumorigenic effects of SNRPB overexpression in a preclinical HCC model.

Conclusions: SNRPB promoted HCC progression by modulating the FOXM1-CCNB1 axis and lipid metabolism, and could act as a potential therapeutic target to augment chemotherapy sensitivity in HCC.

Keywords: Drug resistance; Hepatocellular carcinoma; Lipid metabolism; SNRPB.


Conflict of interest statement

Declarations. Ethics approval and consent to participate: This study was approved by the Ethics Committees of Fudan University Shanghai Cancer Center (No. 050432-4-2108*). The informed consent was obtained from all patients for the archival of their biospecimens and their use in future studies. Competing interests: The authors declare no competing interests.

Figures
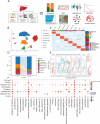
Fig. 1
Fig. 1
Fig. 1
Fig. 2
Fig. 2
The role of spliceosome-associated cluster in HCC. (A) The UMAP plots of global cell type illustrating the enrichment scores of spliceosome prognostic genes in HCC patients. (B) Violin plot of enrichment scores of spliceosome prognostic genes in global cell type in HCC patients. (C) The UMAP plots of epithelial cells illustrating the enrichment scores of spliceosome prognostic genes in HCC patients. (D) Violin plot of enrichment scores of spliceosome prognostic genes in epithelial cells in HCC patients. (E) Survival analysis based on TCGA cohort showed that elevated scores of spliceosome prognostic genes were associated with poor prognosis in HCC patients. (F) Survival analysis based on ICGC cohort showed that elevated scores of spliceosome prognostic genes were associated with poor prognosis in HCC patients. (G) The result of enrichment analysis for specifically expressed genes of C3 cluster. (H) The spatial distribution of C3 cluster in HCC determined by ST data (GSE238264). (I) The heatmap showing the association between C3 cluster and clinical factors in TCGA cohort. (J) The communication network between C3 cluster and other cell types in HCC patients
Fig. 3
Fig. 3
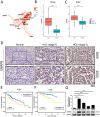
Identification of SNRPB as a key regulator in HCC. (A) The plot illustrating the correlation among the 15 identified spliceosome-related genes. (B) The box plot showing elevated SNRPB expression in HCC compared to normal liver tissues in TCGA cohorts. (C) The box plot showing elevated SNRPB expression in HCC compared to normal liver tissues in ICGC cohorts. (D) IHC analysis revealed significant upregulation of SNRPB expression in HCC tissues compared to normal tissues. (E) Survival analysis based on TCGA cohort showed that elevated SNRPB expression was associated with poor prognosis in HCC patients. (F) Survival analysis based on ICGC cohort showed that elevated SNRPB expression was associated with poor prognosis in HCC patients. (G) Endogenous SNRPB expression was compared in normal liver cells (HL-7702) and HCC cell lines, with significantly higher levels observed in HCC cells. Data were drawn as mean ± SD (n ≥ 3). * P < 0.05, ** P < 0.01, *** P < 0.001
Fig. 4
Fig. 4
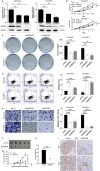
Functional analysis of SNRPB knockdown in HCC cells. (A) Validation of SNRPB knockdown efficiency in SK-HEP-1 and HCCLM3 cells at both mRNA and protein levels using two effective shRNAs (shSNRPB-2 and shSNRPB-3). (B) CCK-8 assay demonstrates the inhibitory effects of SNRPB knockdown on HCC cell proliferation in SK-HEP-1 and HCCLM3 cells. (C) Colony formation assay shows that SNRPB knockdown significantly suppresses the clonogenic capacity of HCC cells. (D) Flow cytometry analysis reveals that SNRPB knockdown significantly increases apoptosis rates in SK-HEP-1 and HCCLM3 cells. (E) Transwell assay demonstrates that silencing SNRPB significantly reduces the migratory capacity of HCC cells. (F) The pictures taken from the excised xenografts of indicated experimental groups. (G) Tumor volume measurements in subcutaneous xenograft tumor models showing the effects of SNRPB knockdown on tumor growth. (H) Tumor weight analysis at the time of sacrifice in xenograft models. (I) IHC staining of tumor tissues showing Ki67 expression levels. Data were drawn as mean ± SD (n ≥ 3). * P < 0.05, ** P < 0.01, *** P < 0.001
Fig. 5
Fig. 5
Mechanistic analysis of SNRPB-mediated regulation of CCNB1 expression in HCC. (A) Volcano plot illustrating the significantly upregulated and downregulated genes identified in SK-HEP-1 cells following SNRPB knockdown. (B) The results of KEGG pathway enrichment analysis on the significantly downregulated genes. (C) IHC analysis of tissue microarray showing elevated CCNB1 expression in HCC tissues compared to adjacent normal tissues. (D) The box plot showing elevated CCNB1 expression in HCC compared to normal liver tissues in TCGA and ICGC cohorts. (E) Survival analysis based on TCGA cohort showing negative correlation between CCNB1 expression and overall survival in HCC patients. (F) Survival analysis based on ICGC cohort showing negative correlation between CCNB1 expression and overall survival in HCC patients. (G) Identification of FOXM1-binding sites in the CCNB1 promoter using bioinformatics tools. (H) ChIP assay demonstrating significant FOXM1 enrichment at Site 1 of the CCNB1 promoter in SK-HEP-1 cells. (I) Dual-luciferase reporter assay confirming that mutations at Site 1 (CCNB1-mut1) abolish FOXM1-mediated transcriptional activation of CCNB1. (J) ChIP assay showing enhanced FOXM1 enrichment at the CCNB1 promoter in SK-HEP-1 cells overexpressing SNRPB. (K) Co-IP assay demonstrating a protein-protein interaction between SNRPB and FOXM1. Data were drawn as mean ± SD (n ≥ 3). * P < 0.05, ** P < 0.01, *** P < 0.001
Fig. 6
Fig. 6
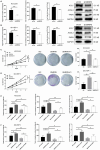
The functional role of CCNB1 in mediating the effects of SNRPB on HCC progression. (A) CCK-8 assay assessing the proliferation of HCC cells in four experimental groups: control (NC + shCtrl), SNRPB overexpression (SNRPB + shCtrl), CCNB1 knockdown (NC + shCCNB1), and combined SNRPB overexpression and CCNB1 knockdown (SNRPB + shCCNB1), highlighting the restoration of proliferation upon CCNB1 knockdown in SNRPB-overexpressing cells. (B) Colony formation assay showing the impact of SNRPB overexpression and CCNB1 knockdown on HCC cell colony formation, with a focus on the restoration of clonogenic capacity in the combined treatment group. (C) Tumor volume measurements in subcutaneous xenograft tumor models showing the effects of SNRPB overexpression and CCNB1 knockdown on tumor growth, emphasizing the partial reversal of enhanced tumor growth by CCNB1 knockdown in SNRPB-overexpressing tumors. (D) Tumor weight analysis at the time of sacrifice in xenograft models, highlighting the partial reversal of increased tumor weight due to CCNB1 knockdown in SNRPB-overexpressing tumors. (E) The pictures taken from the excised xenografts of indicated experimental groups. (F) IHC staining of tumor tissues showing SNRPB, CCNB1 and Ki67 expression levels, with a focus on the restoration of Ki67 expression in the combined treatment group, indicating the reversal of the effects of SNRPB overexpression. Data were drawn as mean ± SD (n ≥ 3). * P < 0.05, ** P < 0.01, *** P < 0.001
Fig. 7
Fig. 7
Investigation of SNRPB and CCNB1 in regulating lipid metabolism in HCC cells. (A) Triglyceride, total cholesterol, and free fatty acid levels were detected in HCCLM3 cells following SNRPB knockdown, showing a reduction in lipid metabolism markers. (B) Triglyceride, total cholesterol, and free fatty acid levels were detected in SK-HEP-1 cells following SNRPB knockdown, showing a similar reduction in lipid metabolism markers. (C) The CCK-8 assay and colony formation assay in HCCLM3 cells showing the reversal of proliferative and clonogenic advantages by ACLY inhibition. (D) The CCK-8 assay and colony formation assay in SK-HEP-1 cells showing the reversal of proliferative and clonogenic advantages by ACLY inhibition. (E) Triglyceride, total cholesterol, and free fatty acid levels were detected in HCCLM3 cells, demonstrating the effect of SNRPB overexpression and CCNB1 knockdown on lipid metabolism, with partial reversal of lipid metabolism enhancement by CCNB1 knockdown. (F) Triglyceride, total cholesterol, and free fatty acid levels were detected in SK-HEP-1 cells, showing the interplay between SNRPB overexpression and CCNB1 knockdown in regulating lipid metabolism. Data were drawn as mean ± SD (n ≥ 3). * P < 0.05, ** P < 0.01, *** P < 0.001
Fig. 8
Fig. 8
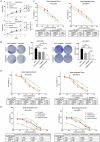
The role of SNRPB in regulating cisplatin sensitivity in HCC cells through lipid metabolism and CCNB1 modulation. (A) CCK-8 assay assessing the proliferation of HCC cells treated with cisplatin, SNRPB knockdown, or both, showing the synergistic effect of combined treatments on cell proliferation inhibition. (B) Colony formation assay showing the impact of cisplatin and SNRPB knockdown on clonogenic ability of HCC cells, highlighting the synergistic inhibition of colony formation by combined treatments. (C) IC50 values of cisplatin in shCtrl and shSNRPB HCC cell lines (HCCLM3 and SK-HEP-1), showing increased cisplatin sensitivity upon SNRPB knockdown. (D) IC50 values of cisplatin in HCC cells treated with ACLY inhibitor (FI) in combination with SNRPB overexpression, indicating the restoration of cisplatin sensitivity through lipid metabolism inhibition. (E) IC50 values of cisplatin in HCC cells with SNRPB overexpression and CCNB1 knockdown, demonstrating the modulation of cisplatin sensitivity by the SNRPB/CCNB1 axis. Data were drawn as mean ± SD (n ≥ 3). * P < 0.05, ** P < 0.01, *** P < 0.001

References

    1. Vogel A, Meyer T, Sapisochin G, et al. Hepatocellular carcinoma. Lancet. 2022;400:1345–62. 10.1016/s0140-6736(22)01200-4. - PubMed
    1. Ganesan P, Kulik LM. Hepatocellular carcinoma: new developments. Clin Liver Dis. 2023;27:85–102. 10.1016/j.cld.2022.08.004. - PubMed
    1. Siegel RL, Giaquinto AN, Jemal A. Cancer statistics, 2024.CA Cancer J Clin.2024;74:12–49.10.3322/caac.21820 - PubMed
    1. Bray F, Laversanne M, Sung H, et al. Global cancer statistics 2022: GLOBOCAN estimates of incidence and mortality worldwide for 36 cancers in 185 countries. CA Cancer J Clin. 2024;74:229–63. 10.3322/caac.21834. - PubMed
    1. Alawyia B, Constantinou C. Hepatocellular carcinoma: a narrative review on current knowledge and future prospects. Curr Treat Options Oncol. 2023;24:711–24. 10.1007/s11864-023-01098-9. - PubMed

MeSH terms

LinkOut - more resources