. 2025 Jul 19;16(1):6657.
doi: 10.1038/s41467-025-61515-5.

Plasma proteomics for biomarker discovery in childhood tuberculosis

Affiliations

Plasma proteomics for biomarker discovery in childhood tuberculosis

Andrea Fossati et al. Nat Commun. .

Abstract

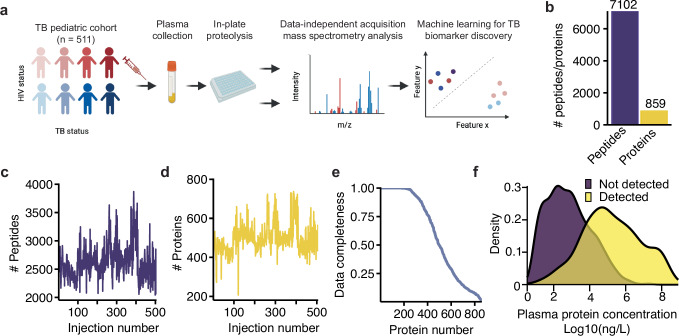
Failure to rapidly diagnose tuberculosis disease (TB) and initiate treatment is a driving factor of TB as a leading cause of death in children. Current TB diagnostic assays have poor performance in children, thus a global priority is the identification of novel non-sputum-based TB biomarkers. Here we use high-throughput proteomics to measure the plasma proteome for 511 children, with and without HIV, and across 4 countries, to distinguish TB status using standardized definitions. By employing a machine learning approach, we derive four parsimonious biosignatures encompassing 3 to 6 proteins that achieve AUCs of 0.87-0.88 and which all reach the minimum WHO target product profile accuracy thresholds for a TB screening test. This work provides insights into the unique host response in pediatric TB disease, as well as a non-sputum biosignature that could reduce delays in TB diagnosis and improve the detection and management of TB in children worldwide.


Conflict of interest statement

Competing interests: The authors declare no competing interests.

Figures

Fig. 1
Fig. 1. A high-throughput workflow for plasma proteomics.
a Plasma proteomics workflow and experimental design (created by BioRender). b Barplot showing the total number of unique peptide sequences (purple) and protein groups (yellow) identified across all samples. c, d After removing 7 outlier samples, the number of peptides (c), and proteins (d) identified per MS injection. e Percentage of identifications (y-axis) versus the number of identified proteins (x-axis). f Density for the concentration ranges of plasma proteins, with those proteins detected in our study represented in the yellow density, while purple density represents remaining proteins not detected in our study. X-axis represents the logged ng/L concentration determined from HumanProteinAtlas. Source data are provided as a Source Data file.
Fig. 2
Fig. 2. Quality control and reproducibility of plasma proteomics across multiple clinical sites.
a Pie chart illustrating the number of samples originating from each clinical site. b Empirical cumulative distribution function plot for the raw MS intensity of the samples (x-axis) from the various clinical sites. c Upset plot showing the overlap in protein identifications between the different clinical sites. d Principal Component Analysis (PCA) of the DIA-PASEF dataset following COMBAT batch correction. X-axis shows the first component (10% variance) and y-axis the second component (6% variance). Each point represents a sample, while the color code indicates the clinical site. e Protein level percent coefficient of variation (%CV) within each clinical site and across all samples. Source data are provided as a Source Data file.
Fig. 3
Fig. 3. Abundance proteomics analysis of pediatric TB cohorts.
a Benchmark of data between patients with respiratory burden and healthy controls, excluding Latent TB Infection. X-axis shows the TB classification status, while y-axis represents the protein-level intensity. Box shows the protein intensities for individual samples (dots), the median value (center line) IQR range (box limits), and 1.5 times the IQR (whiskers). P-values are calculated from a two-sided Kruskal–Wallis test. N-values represent the number of patients within each group. b Volcano plot between Confirmed (n = 133) and Unlikely TB (n = 231). The x-axis shows the Log2 fold change at the protein level, while the y-axis represents the significance as −log10 of the Benjamini–Hochberg (BH) corrected p-values derived from a two-sided Welch t-test. Significant proteins (BH-adjusted p < 5%) are shown in red (upregulated) and blue (downregulated). Yellow dots indicate inflammatory marker proteins from (a). Barplot showing the number of differentially expressed proteins (DEPs) that were either upregulated (red, n = 17) or downregulated (blue, n = 30). c Density plot showing the z-scored intensity for the most significantly regulated protein (IGHV3-30), divided by TB status in confirmed TB (pink), unconfirmed TB (green), and unlikely TB (blue). d Gene set enrichment analysis for identification of dysregulated pathways between Confirmed TB and Unlikely TB. Dot size represents the BH adjusted p from a two-sided mean difference (MD) test of protein abundances. Colors indicate the overlap between each signaling pathway and the protein dataset. Only pathways with over 60% overlap are represented. Source data are provided as a Source Data file.
Fig. 4
Fig. 4. Machine learning to develop a parsimonious biosignature for pediatric TB disease.
a Absolute feature importance from a LASSO model for the top ten most important features. b ROC curves for best-scoring combination of features on the test data (25%). Each curve represents the feature subset achieving the highest AUC derived from all combinations of 1 (n = 50), 2 (n = 1225), 3 (n = 19,600), 4 (n = 230,300), 5 (n = 2,118,760), and 6 (n = 15,890,700) features. WHO TPP for a screening test (70% specificity and 90% sensitivity) is denoted by the black circle. c Barplot for the sensitivity achieved at 70% specificity for all 6 models. Dotted red line represents 90% sensitivity. d Venn diagram of the overlap in proteins from the 3-, 4-, 5-, or 6-protein model. e Dotplot representing the mean (dot) and the standard deviation (line) for the proposed biosignature proteins (5 and 6 protein models) across individual patients from different TB classes. N-values represent the number of patients within each class. Different colors highlight the different TB classes according to NIH consensus definition. Each protein is normalized to the Unlikely TB protein abundance for that respective protein. Source data are provided as a Source Data file.
Fig. 5
Fig. 5. Detection of unconfirmed TB.
a Barplot showing the number of positive predicted (yellow) and negative predicted (purple) in the proposed linear models using 3, 4, 5, or 6 proteins. Values in the barplot indicate the number of predicted cases in each category. b Upset plot displaying the overlap between all positive predictions using the 3-, 4-, 5-, or 6-protein models. c Principal component analysis of Confirmed and Unconfirmed TB. X-axis shows the first component and y-axis shows the second component. Each dot represents a sample. Samples are color coded based on either TB status (Confirmed TB, black) and further for the Unconfirmed TB based on the positive prediction in the various models: 1/4 of models (light blue), 2/4 of models (green), 3/4 of models (yellow), or all models (dark blue). Samples negatively predicted by all models (Negative Unconfirmed) are shown in orange. Shading approximates the 95% confidence region for the 2D normal distribution of each group. Source data are provided as a Source Data file.

Update of

References

    1. World Health Organization. Global Tuberculosis Report 2024 (World Health Organization, Genève, Switzerland, 2024).
    1. World Health Organization & Viney, K. Roadmap Towards Ending TB in Children and Adolescents (World Health Organization, Genève, Switzerland, 2023).
    1. Jaganath, D., Beaudry, J. & Salazar-Austin, N. Tuberculosis in children. Infect. Dis. Clin. North Am.36, 49–71 (2022). - PMC - PubMed
    1. MacLean, E. et al. A systematic review of biomarkers to detect active tuberculosis. Nat. Microbiol.4, 748–758 (2019). - PubMed
    1. Yao, F. et al. Plasma immune profiling combined with machine learning contributes to diagnosis and prognosis of active pulmonary tuberculosis. Emerg. Microbes Infect.13, 2370399 (2024). - PMC - PubMed

LinkOut - more resources