. 2025 Jul 19;16(1):6654.
doi: 10.1038/s41467-025-60902-2.

Single cell and spatial alternative splicing analysis with Nanopore long read sequencing

Affiliations

Single cell and spatial alternative splicing analysis with Nanopore long read sequencing

Yuntian Fu et al. Nat Commun. .

Abstract

Long-read sequencing boosts alternative splicing analysis but faces technical and computational barriers in single-cell and spatial settings. High Nanopore error rates compromise cell barcode and UMI recovery, while read truncation and misalignment undermine isoform quantification. Downstream, a statistical framework to assess splicing variation within and between cells or spatial spots is lacking. We introduce Longcell, a statistical and computational pipeline for isoform quantification from single-cell and spatially barcoded Nanopore long reads. Longcell efficiently recovers cell barcodes and UMIs, corrects sequencing errors, and models splicing diversity within and between cells or spots. Applied across multiple datasets, Longcell allows accurate identification of spatial isoform switching. Longcell also reveals widespread high intra-cell isoform heterogeneity for highly expressed genes. Finally, on a perturbation experiment for 9 splicing factors, Longcell identifies regulatory targets that are validated by targeted sequencing.


Conflict of interest statement

Competing interests: The authors declare no competing interests.

Figures

Fig. 1
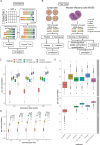
Fig. 1. Overview of single cell Nanopore RNA seq preprocessing in Longcell.
A Top: The structure of a read in 10 × 5’ toolkit. Bottom left: Edit distance distribution between 10mers aside the confidently identified cell barcode and the original sequences. Bottom right: UMI graph constructed using this distribution. UMIs highlighted in green originate from the same molecule but fail to be connected due to sequencing errors. B Application of DBSCAN (blue) and Longcell (coral) to sampled 10-mer adapters across simulated amplification levels (n = 20 replicates per level). C UMI cluster size distribution for gene ENSG00000269590, which has only one isoform. Compared to 10× short reads, DBSCAN applied to Nanopore reads produces more singleton and small clusters. D Correction of wrongly mapped exons for VPS28-201 after UMI deduplication. The misaligned region is indicated by a black arrow. E Bulk-level percent-spliced-in (ψ) estimation for constitutive exons before (blue) and after (coral) Longcell correction. Each point represents an exon (n = 1146 from 325 genes); lines connect values for the same exon pre- and post-processing. F Comparison for isoform quantification of VPS28 across methods. The y-axis shows the proportion of misaligned reads mapped to VPS28-201. G Overview of Longcell: ① simulated isoforms for a gene, including two true isoforms (a and b) and a misaligned (n). ② UMIs are first clustered within each cell. In the example cell, three UMI clusters are formed. ③ Misalignment correction is performed using an isoform attribution table built per cell based on UMI clusters. Using cluster 1 as an example, isoform (a) is the majority, so the misaligned read (n) is attributed to isoform a, and (n, a) is recorded as 1 in the table. The table is then aggregated across cells and isoforms which are frequently assigned to other isoforms are classified as misalignment. ④ Truncation errors are corrected by comparing to complete read within each cluster. In the example, the truncated 5’ end for the third read in cluster 1 and the second read in cluster 3 is corrected. ⑤ Small UMI clusters are pruned based on cluster size distributions for each isoform. All boxplots show the median (center line), the 25th and 75th percentiles (bounds of the box), and whiskers extend to 1.5× the interquartile range from the box limits. Outliers beyond 1.5× IQR are shown as individual points. Source data are provided in 10.5281/zenodo.15320816.
Fig. 2
Fig. 2. UMI deduplication results on simulated and real datasets.
A The procedure to simulate single-cell long reads sequencing as a benchmark dataset. Different number of transcripts are first simulated under the guidance of a cell isoform expression dataset. Each transcript is then amplified according to their GC ratio. Then, the sequencing errors and truncations are introduced to mimic the Nanopore sequencing data quality. B The procedure to generate the real benchmark dataset. The left plot shows the sequencing for Jurkat cells: The 10× full-length cDNA library was randomly split into two parts, one for Pacbio and one for Nanopore. Sequences from Pacbio was processed by their official tool isoseq, while Nanopore sequencing was processed by other methods for single-cell isoform quantification. The output from each method is then compared with the isoform quantification from Isoseq by correlation. The right plot shows the sequencing for the mouse olfactory bulb: The Visium full-length cDNA library was randomly split into two parts, one for Illumina and one for Nanopore. The Ilumina sequencing is used to guide the cell barcode and UMI recovery to generate a confident single-cell isoform quantification. Methods to be benchmarked are applied only to the Nanopore data. The output from each method is then compared with the confident isoform quantification by correlation. C The per cell Spearman correlation on simulated data across different data quality for 220 cells. D The per-cell Spearman correlation on the full transcriptome simulated data across different down-sampling rates for 918 cells. E The per cell Spearman correlation on the real data: the upper one is the result on the Jurkat cells (5881 cells) and the bottom one is the result on the MOB (918 cells). Boxplots are defined as in Fig. 1. Source data are provided in 10.5281/zenodo.15320816.
Fig. 3
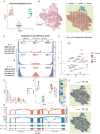
Fig. 3. Quantification of intra-cell versus inter-cell isoform heterogeneity in colorectal metastasis to the liver.
A The UMAP of the colorectal cancer metastasis to the liver (CRCLM) single cell data, each point is a cell colored by its cell type definition. B The paired VISIUM sequencing for the same CRCLM sample. The left plot shows the histology, indicating the tumor region. The right plot shows the dominant cell type in each spot. C The relationship between ψ¯ and ϕ, ψ¯ means the mean of percent-spliced-in for an exon across the cell population, ϕ means the inter-cell heterogeneity of this exon. The histograms of ψ are colored by their ψ¯. The dots above each histogram show the alternative splicing across the cell population. The dot filled in red means the target exon is preserved in the isoforms in this cell, while the dot filled in white means the target exon is spliced out. The circle filled in red gradient means the cell expresses both isoforms. D ϕ vs. ψ¯ distribution for alternative spliced exons in CRCLM single cell data, the color indicates the confidence interval of ϕ estimation. E The ψ distribution for exon 6 of MYL6, which has a very high ϕ, indicating high intercell heterogeneity. In this histogram, x-axis shows the exon ψ and y-axis shows the cell frequency whose ψ value falls in this bin. As ψ estimation is influenced by the gene expression, the average gene expression for is bin is shown in color gradient. F The left plot shows the ψ distribution for exon 6 of MYL6 across cells, epithelial show the highest inclusion-level of this exon. The expression of two dominant isoforms across different cells are shown in the right heatmap, epithelial has higher expression of MYL6-218 compared to other cell types. G The sashimi plot shows the comparison of bulk expression of MYL6-207 and MYL6-218 between epithelial cells and other immune cells. H The spatial view of the expression for MYL6-218 (top) and MYL6-207 (bottom). The regions for myeloid cells are marked by black circles. Source data are provided in 10.5281/zenodo.15320816.
Fig. 4
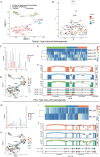
Fig. 4. Quantification of intra-cell versus inter-cell isoform heterogeneity in embryo mouse brain.
A Umap of cells in the mouse embryo brain colored by cell types. B ϕ vs. ψ¯ distribution for alternative spliced exons, color indicates the confidence interval of ϕ. C The ψ distribution for exon 4 of Serbp1, which has a relatively low ϕ and shows a unimodal distribution, indicating a low inter-cell heterogeneity. D Umap of cells in mouse embryo brain. Cells are colored by ψ for exon 4 of Serbp1. Cells that have low expression (<3) of this gene and could not give a confident ψ estimation are the smallest points colored in gray. The gene expression for each cell is shown by the point size while the ψ estimation is shown by color gradient. Three differentiation stages from neuroblast to glutamatergic cells are highlighted by three circles (red: early, blue: middle, and green: late). E, F The alternative splicing for Serbp1 in above three circled groups. The alternative splicing of exon 4 and 5 in Serbp1 mainly leads to 4 isoforms: Serbp1-201, Serbp1-203, Serbp1-207, and Serbp1-211. Each single cell co-expressed part of those 4 isoforms and there is no obvious cell-type-specific pattern of the alternative splicing from both single cell view (E heatmap) and bulk level (F sashimi plot). G The ψ distribution for exon 9 of Pkm, which has a relatively high ϕ and shows a bimodal distribution, indicating a high inter-cell heterogeneity. H Umap of cells in mouse embryo brain. Cells are colored by ψ for exon 9 of Pkm. I, J The alternative splicing for Pkm in above three circled groups. The alternative splicing of exon 9 in Pkm mainly leads to 2 isoforms: Pkm-201 ad Pkm-202. An obvious transition of the expression of two isoforms can be identified both in both bulk (J sashimi plot) and single cell level (I heatmap). Source data are provided in 10.5281/zenodo.15320816.
Fig. 5
Fig. 5. Differential splicing analysis and the detection of alternative splicing regulated by splicing factors.
A The principle of generalized likelihood ratio test to identify differentially expressed isoforms. The mean change vs. variance change of ψ for all significant meta splicing sites identified in Jurkat (B) and stimulated Jurkat cells (C) after knock-out of splicing factors. Each point is a significant meta-splicing site labeled by its gene identity. Meta splicing sites with too low mean or variance change are not labeled. D Correspondence of significant meta-splicing sites between original and stimulated Jurkat cells. The line represents the fitted linear regression; shaded areas indicate the 95% confidence interval around the fit. After stimulation, there is a significant change of gene expression and alternative splicing in Jurkat cells, but the regulation of splicing factors keeps the same direction. Source data are provided in 10.5281/zenodo.15320816.
Fig. 6
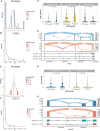
Fig. 6. Isoform transition after knock-out of splicing factors.
A, B ψ distribution of exons 3 and 4 of DGUOK in nontarget and PCBP2 knock-out cells estimated from the full transcriptome sequencing data. A significant decrease of ψ (fdr=2.16×10⁷) can be observed after the knock-out. C Comparison of expression for 3 main DGUOK isoforms between nontarget and PCBP2 knock-out cell populations by two-sided Wilcoxon rank sum test. The exact p-values are shown without adjustment for multiple tests. D Sashimi plot for 3 main DGUOK isoforms in Nontarget and PCBP2 knock-out cell populations. The detected exons are marked by a black box. E, F ψ distribution of exons 14 and 15 of ARHGEF1 changes after knock-out of CELF2. A significant decrease of ψ (fdr=3.77×10⁹) can be observed. G Comparison of expression for 2 main ARHGEF1 isoforms between nontarget and CELF2 knock-out cell populations using the same test setting as (C). H Sashimi plot for 2 main ARHGEF1 isoforms in Nontarget and CELF2 knock-out cell populations. Source data are provided in 10.5281/zenodo.15320816.
Fig. 7
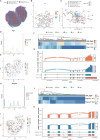
Fig. 7. Longcell application on the VISIUM sequencing of a mouse olfactory bulb slice.
A The spatial plot for the VISIUM slice, each spot is colored by the layer identification. B ϕ vs. ψ¯ distribution for alternative spliced exons, color indicates the confidence interval of ϕ. C The mean change vs. variance change of ψ for all significant meta-sites which are alternatively spliced across different layers. The point size indicates the significance after FDR control, while the color indicates in which layer this meta-site is alternatively spliced. D The ψ distribution for exon 3 of Plp1, which has the highest ϕ and shows a bimodal distribution, indicating a low inter-cell heterogeneity. E Spatial plot of spots in the slice of mouse olfactory bulb. The spots are colored by ψ for exon 3 of Plp1. Cells which have low expression (<3) of this gene and could not give a confident ψ estimation are the smallest points colored in gray. The gene expression for each spot is shown by the point size, while the ψ estimation is shown by the color gradient. F, G The alternative splicing for Plp1 in different layers. H The ψ distribution for exon 4 of Mapre3, which has a relatively high ϕ and show a bimodal distribution, indicating a high inter-cell heterogeneity. I Spatial plot of spots in the slice of mouse olfactory bulb. The spots are colored by ψ for exon 4 of Mapre3. J, K The alternative splicing for Mapre3 in different layers. Source data are provided in 10.5281/zenodo.15320816.

Update of

References

    1. Scotti, M. M. & Swanson, M. S. RNA mis-splicing in disease. Nat. Rev. Genet17, 19–32 (2016). - PMC - PubMed
    1. Baralle, F. E. & Giudice, J. Alternative splicing as a regulator of development and tissue identity. Nat. Rev. Mol. Cell Biol.18, 437–451 (2017). - PMC - PubMed
    1. Zhang, Y., Qian, J., Gu, C. & Yang, Y. Alternative splicing and cancer: a systematic review. Signal Transduct. Target Ther.6, 78 (2021). - PMC - PubMed
    1. Stanley, R. F. & Abdel-Wahab, O. Dysregulation and therapeutic targeting of RNA splicing in cancer. Nat. Cancer3, 536–546 (2022). - PMC - PubMed
    1. Zhang, X. et al. Cell-type-specific alternative splicing governs cell fate in the developing cerebral cortex. Cell166, 1147–1162 e1115 (2016). - PMC - PubMed

MeSH terms

Substances

LinkOut - more resources