. 2025 Jul 19;8(1):1074.
doi: 10.1038/s42003-025-08484-z.

Tissue-engineered neuromuscular organoids

Affiliations

Tissue-engineered neuromuscular organoids

Beatrice Auletta et al. Commun Biol. .

Abstract

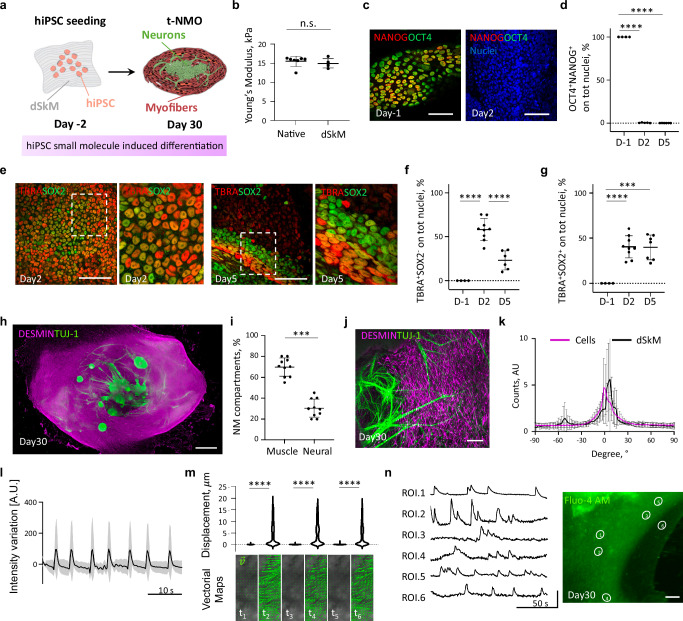
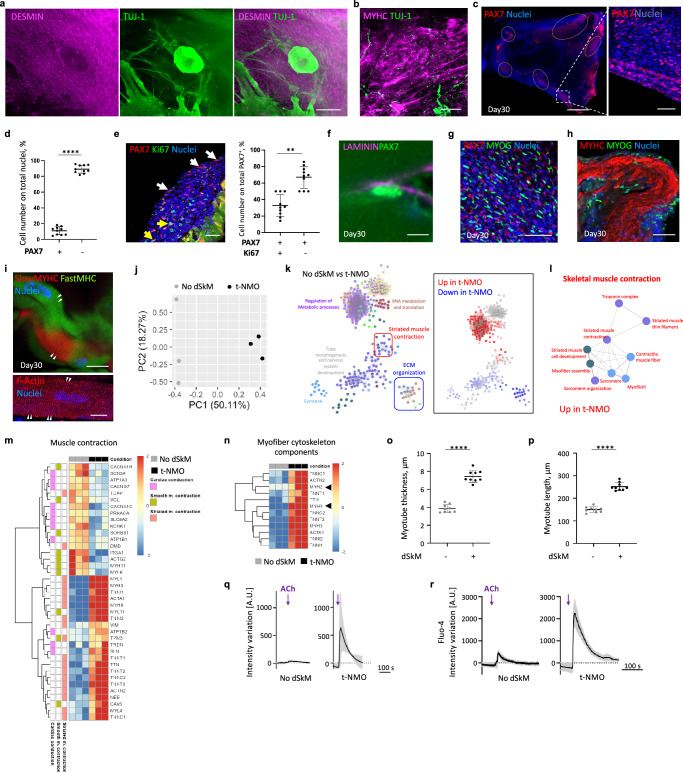
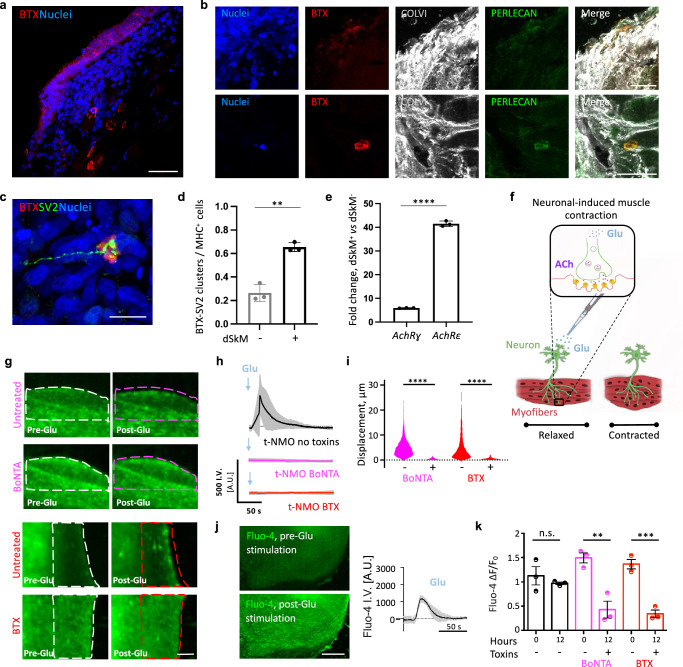
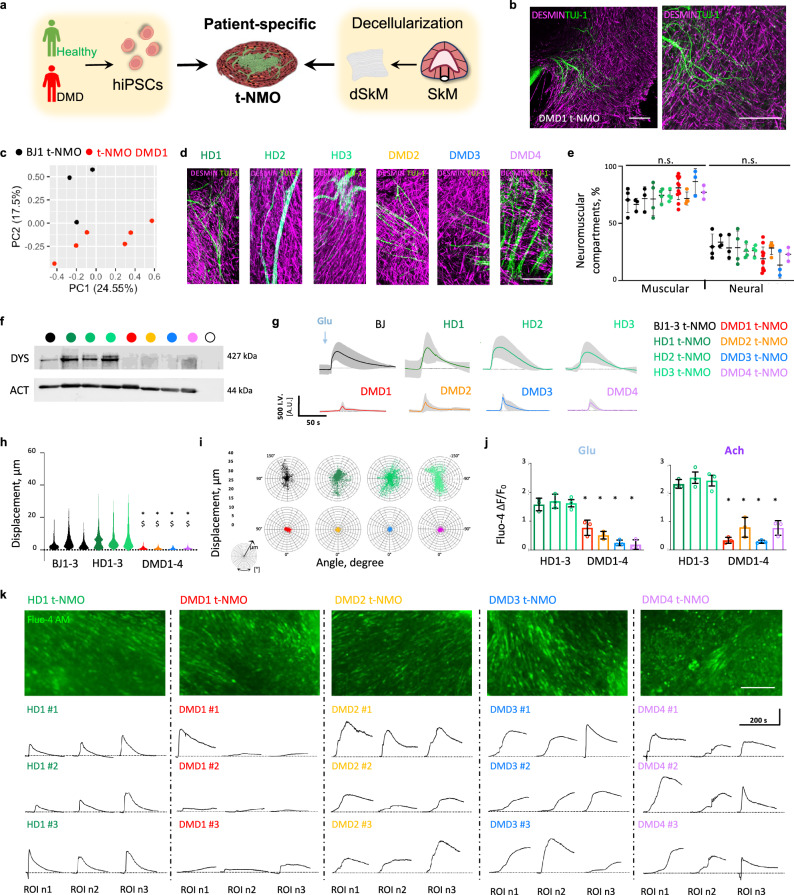
Skeletal muscle development, homeostasis, and function rely on complex interactions among multiple cell types and the extracellular matrix (ECM). Developing in vitro models that recapitulate both intrinsic cellular and extrinsic ECM elements of innervated skeletal muscle is crucial for advancing basic biology and disease modeling studies. Here, we combine tissue engineering approaches with human induced pluripotent stem cell (hiPSC) technology to create tissue-engineered neuromuscular organoids (t-NMOs). Using decellularized muscles as scaffolds, hiPSCs differentiate to form organoids that establish a continuum with the provided biomaterial. After 30 days, t-NMOs exhibit compartmentalized neural and muscular components that establish functional interactions, allowing muscle contraction. We demonstrate the model's potential by creating Duchenne Muscular Dystrophy patient-specific t-NMOs, that recapitulate the reduced skeletal muscle contraction and altered calcium dynamics typical of the disease. Altogether, our study presents a tissue-engineered organoid that model the human neuromuscular system (dys)function, highlighting the potential of applying the ECM in organoid engineering.


Conflict of interest statement

Competing interests: The authors declare no competing interests.

Figures

Fig. 1
Fig. 1. DSkMs support hiPSC differentiation into tissue-engineered NMO.
a Schematic illustration showing the strategy used for t-NMO generation. Scaffolds derived from dSkM were used as substrate for seeding hiPSCs as single cells. Upon 2 days from seeding, cells underwent to a small-molecule based differentiation protocol until day 30 to derive t-NMOs. b Scatter dot plot showing the mean of the Young’s modulus measured by atomic force microscopy of native freshly isolated murine diaphragms (Native) and decellularized murine diaphragms (dSkM). Data are shown as mean ± s.d. of 5–7 independent biological replicates; unequal variance Student’s t-test; n.s., not statistically significant. c Z-stack confocal immunofluorescence imaging showing hiPSCs co-expressing NANOG (red) and OCT4 (green) 48 h (Day-1) after hiPSCs seeding onto the dSkM and 72 (D2) hours from hiPCs differentiation. Scale bars, 100 μm. d Scatter dot plot showing the percentage of OCT4+ NANOG+ cells on the total amount of nuclei after 48 h from hiPSCs seeding (D-1) and 72 (D2) and 120 (D5) hours from hiPCs differentiation. Data are shown as mean ± s.d. of 4–6 independent biological replicates from two differentiation experiments, at least 4500 nuclei were counted per each time point; one-way ANOVA with Tukey’s multiple comparisons test, ****P  < 0.0001. Statistical results are reported in Supplementary Table 1. e Z-stack confocal immunofluorescence images showing cells expressing TBRA (red) and SOX2 (green) after 2 (Day2) and 5 (Day5) days from hiPSC differentiation onto dSkM. Scale bars, 50 μm. f Scatter dot plot showing the percentage of TBRA+SOX2- progenitors after 48 h from hiPSCs seeding (D-1) and after 2 (D2) and 5 (D5) days from hiPSCs differentiation. Data are shown as mean ± s.d. of 4, 9 and 6 independent biological replicates from at least two differentiation experiments, at least 6000 nuclei were counted per each time point; One-way ANOVA with Tukey’s multiple comparisons test, ****P  < 0.0001. Statistical results are reported in Supplementary Table 2. g Scatter dot plot showing the percentage of TBRA+SOX2+ progenitors after 48 h from hiPSCs seeding (D-1) and after 2 (D2) and 5 (D5) days from hiPSCs differentiation. Data are shown as mean ± s.d. of 4, 9 and 7 independent biological replicates, from at least two independent experiments, and at least 6000 nuclei were counted per each time point; One-way ANOVA with Tukey’s multiple comparisons test, ****P  < 0.0001. Statistical results are reported in Supplementary Table 3. h Representative stereomicroscope immunofluorescence image showing whole mount t-NMO stained for desmin (magenta) and TUJ-1 (green) after 30 days of hiPSC differentiation. Scale bar, 2 mm. i Scatter dot plot showing the mean of the area occupied by muscular (desmin positive) or neuronal (TUJ-1 positive) cells in t-NMO after 30 days of differentiation, expressed as percentage on the total neuromuscular area. Data are shown as mean ± s.d. of 10 independent biological replicates, 4 derived from BJ1-hiPSCs, 3 from BJ2-  and 3 from BJ3-hiPSCs. Each hiPSC line was used for an independent t-NMO differentiation experiment; dots represent a single biological replicate; unequal variance Student’s t-test; n.s., ***P = 0.0008. j Representative Z-stack confocal immunofluorescence image of whole mount t-NMO stained for desmin (magenta) and TUJ-1 (green) after 30 days of differentiation. Scale bar, 200 μm. k Quantification of cellular and dSkM ghost myofiber directionality. Data are shown as mean ± s.d. of 3 independent biological replicates from one differentiation experiment. l Mean normalized fluorescence intensity variation of contracting t-NMOs loaded with calcein registered during live imaging acquisition with a fluorescent stereomicroscope. Images were processed with Spiky and analyzed with MATLAB. Data are shown as mean ± s.d. of 3 independent biological replicates from three independent differentiation experiments; A.U., arbitrary unit. m Upper panel, violin plot showing the maximum displacement of a representative t-NMO reported in L from one differentiation experiment and measured during 3 cycles of contraction - relaxation (t1 vs t2, t3 vs t4, t5 vs t6) using PIVlab. The analysis was performed considering the identical query region per each time point analyzed (number of analyzed vectors per each time point: 4870). Unequal variance Student’s t-test was used; ****P  < 0.0001. Lower panel, representative vector maps generated by comparing pairs of frames selected before contraction (t1, t3, t5) or at the maximum of sample contraction (t2, t4, t6). n Left panel, representative charts of peak amplitude spectrum (ΔF/F0) basal activity of t-NMO loaded with Fluo-4 and analyzed with live fluorescence imaging after 30 days from hiPSCs differentiation to reveal calcium transients. Data are shown as independent ROI of a single sample. Right panel, representative single frame of live imaged (Fluo-4) cells in t-NMO after 30 days of differentiation used for calcium live imaging analysis. Scale bar, 200 μm.
Fig. 2
Fig. 2. Characterization of the myogenic compartment of day 30 t-NMOs.
a Representative stereomicroscope image showing muscular and neural integration in t-NMO by whole mount immunofluorescence staining for desmin (magenta) and TUJ-1 (green). Scale bar, 500 μm. b Representative confocal Z-stack image of t-NMO stained for TUJ-1 (green) and MYHC (magenta). Scale bar, 400 μm. c Representative confocal Z-stack image showing whole mount immunofluorescence staining for PAX7 (red). Nuclei were stained with Hoechst (blue). Scale bars, 1 mm (left) and 100 μm (right). d Scatter dot plot showing the mean number of PAX7-positive (+) and of PAX7-negative (–) cells, expressed as percentage on the total nuclei acquired per image (≥100 nuclei per image). Data are shown as mean ± s.d. of 10 independent biological replicates, 4 derived from BJ1-hiPSCs, 3 from BJ2- and 3 from BJ3-hiPSCs. Each hiPSC line was used for an independent t-NMO differentiation experiment; dots represent a single biological replicate; unequal variance Student’s t-test was used; ****P  < 0.0001. e Left panel, representative confocal Z-stack images showing immunofluorescence staining that identify PAX7+Ki67- (white arrows) and PAX7+Ki67+ (yellow arrows) cells. Scale bar, 50 μm. Right panel, scatter dot plot showing the mean of PAX7 positive cells (+) that do not co-express (–) or co-express (+) the proliferating marker Ki67, expressed as percentage on total PAX7+ cells (a total of ≥ 200 PAX7+ cells were analyzed). Data are shown as mean ± s.d. of 10 independent biological replicates, 4 derived from BJ1-hiPSCs, 3 from BJ2- or 3 from BJ3-hiPSCs. Each hiPSC line was used for an independent t-NMO differentiation experiment; dots represent a single biological replicate; unequal variance Student’s t-test was used; **P  = 0.0027. f. Representative confocal Z-stack image showing immunofluorescence staining for PAX7 (green) and laminin (magenta). Scale bar, 10 μm. g Representative image showing immunofluorescence staining for MYOG (green) and PAX7 (red) of t-NMO cryo-sections. Nuclei were stained with Hoechst (blue). Scale bar, 200 μm. h Representative confocal Z-stack image of t-NMO immunostained for MYHC (red) and MYOG (green). Nuclei were stained with Hoechst (blue). Scale bar, 50 μm. i Representative confocal Z-stack images of t-NMO immunofluorescence analysis of myofibers showing sarcomeric organization (white arrowheads) of fast and slow MYHCs (upper) and F-actin (lower). Nuclei were stained with Hoechst (blue). Scale bars, 10 μm. j Principal component analysis (PCA) of samples obtained in presence (t-NMO, black) or in absence of dSkM (No dSkM, gray). Each dot represents a single biological replicate. k Left, enrichment analysis of differentially expressed genes between samples obtained in presence (t-NMO) or in absence of dSkM (No dSkM), within Gene Ontology and Reactome databases. Dot colors in the network highlight groups of categories with overlapping genes. Right, inset represents the same network where dots are colored according to the percentage of genes within each category that have positive (red) or negative (blue) log-fold change of gene expression. l Enlargement of the portion of network highlighted in (k), with categories related to skeletal muscle contraction, which are upregulated in samples obtained in presence of dSkM (t-NMO), when compared to those derived in absence of dSkM (No dSkM). m Hierarchical clustering with heatmap visualization of DEGs within the Reactome Muscle Contraction category. n Hierarchical clustering with heatmap visualization of manually annotated DEGs identifying myofiber cytoskeleton components. Arrows point at the adult MYH2 and neonatal MYH8 genes. o Scatter dot plot showing the mean thickness of desmin+ myotube cross-section in samples derived in absence (–) or in presence (+) of dSkM. Data are shown as mean ± s.d. of 9 independent biological replicates per experimental condition, 3 derived from BJ1-, 3 from BJ2- and 3 from BJ3-hiPSCs. Each hiPSC line was used for an independent differentiation experiment; each dot represents the mean of 30 myotubes per each biological replicate; unequal variance Student’s t-test was used; ****P  <  0.0001. p Scatter dot plot showing the mean length of desmin+ myotube in whole mount samples derived in absence (–) or in presence (+) of dSkM. Data are shown as mean ± s.d. of 9 independent biological replicates per experimental condition, 3 derived from BJ1-, 3 from BJ2- and 3 from BJ3-hiPSCs. Each hiPSC line was used for an independent differentiation experiment; each dot represents the mean of 30 myotubes per each biological replicate; unequal variance Student’s t-test was used; ****P  <  0.0001. q Representative quantification of mean normalized fluorescence intensity variation registered during muscle contraction in samples derived in absence (No dSkM) and in presence of dSkM (t-NMO) upon ACh stimulation via live imaging fluorescent stereomicroscope acquisition. Data are shown as mean ± s.d. of 3 independent biological replicates from one differentiation experiment. Dotted lines correspond to the baseline equal to 0. r Representative mean of peak amplitude spectrum (ΔF/F0) of cells in samples derived in absence and in presence of dSkM (t-NMO) and stimulated with ACh. Samples were loaded with Fluo-4 and analyzed with live fluorescence imaging to reveal calcium transients upon ACh stimulation. Data are shown as mean ± s.d. of 7 or 3 independent biological replicates from one differentiation experiment.
Fig. 3
Fig. 3. Characterization of the neuronal compartment in day 30 t-NMOs.
a Representative stereomicroscope images showing neural network integration in t-NMOs stained in whole mount immunofluorescence for TUJ-1 (green) and actin (red). Scale bar, 200 μm. b Representative confocal Z-stack image of whole mount t-NMO immunostained for desmin (magenta) and TUJ-1 (green). Scale bar, 400 μm. c Representative confocal Z-stack images showing neural progenitor cells co-expressing PAX6 (green) and SOX2 (red). Scale bar, 40 μm. d Representative confocal Z-stack images showing immunofluorescence staining of t-NMOs for the mature neuron markers NEUN (red) and MAP2 (white). Scale bar, 50 μm. e Scatter dot plot showing the area of neural progenitors (co-expressing SOX2 and PAX6) or of NEUN+ cells on the total neuronal area. Data are shown as mean ± s.d. of 5 independent biological replicates from two independent differentiation experiments, at least 982 nuclei were counted per each replicate and dots represent single biological replicates; unequal variance Student’s t-test was used; ****P  < 0.0001. f Scatter dot plot showing the mean distance of PAX6+SOX2+ neural progenitors or NEUN+ neurons from the dSkM in t-NMO cross-sections. Data are shown as mean ± s.d. of 5 independent biological replicates from two independent differentiation experiments, at least 30 measures were counted per each replicate and dots represent single biological replicates; unequal variance Student’s t-test was used; ****P  < 0.0001. g Upper panels, representative confocal Z-stack images showing immunofluorescence staining of t-NMOs for the MN marker CHAT (green) and nuclei (white). Inserts with higher magnification images are reported in the lower panels. Scale bars, 20 μm. h Representative confocal Z-stack images showing TUJ-1 (green) positive neuritic projections in samples obtained in absence (upper panel, No dSkM) or in presence (lower panel, t-NMO) of dSkM. Scale bars, 500 μm. i Scatter dot plot showing the mean thickness (cross-section) of TUJ-1 positive neuritic projections in samples obtained in absence (–) or in presence (+) of dSkM. Data are shown as mean ± s.d. of 9 independent biological replicates per each experimental condition, 3 derived from BJ1-, 3 from BJ2- and 3 from BJ3-hiPSCs. Each hiPSC line was used for an independent differentiation experiment; each dot represents the mean of 30 neuritic projections measured per each biological replicate; ****P  < 0.0001. j Scatter dot plot showing the mean length of TUJ-1 positive neuritic projections in samples obtained in absence (–) or in presence (+) of dSkM. Data are shown as mean ± s.d. of 9 independent biological replicates per each experimental condition, 3 derived from BJ1-, 3 from BJ2- and 3 from BJ3-hiPSCs. Each hiPSC line was used for an independent differentiation experiment; each dot represents the mean of 30 neuritic projections measured per each biological replicate; unequal variance Student’s t-test was used; ****P  < 0.0001.
Fig. 4
Fig. 4. t-NMOs show NMJ elements and functional neuromuscular interaction 30 days after hiPSC differentiation.
a Representative immunofluorescence image showing α-bungarotoxin+ (BTX, red) regions in t-NMO. Nuclei were stained with Hoechst (blue). Scale bar, 50 μm. b Representative immunofluorescence images showing BTX+ (red) regions localization within ECM stained for collagen VI (COLVI, gray) and proteoglycans (Perlecan, green). Nuclei were stained with Hoechst (blue). Scale bars, 25 μm. c Representative immunofluorescence image of BTX+ (red) regions found in close contact with SV2+ neuritic projections (green). Scale bar, 20 μm. d Quantification of BTX+ clusters contacted by SV2+ neuritic projections (BTX-SV2 clusters). Data are normalized for the number of MHC+ cells, and shown as mean ± s.d. of 3 independent biological replicates from a single differentiation experiment. Unequal variance Student’s t-test was used; **P  = 0.012. e AChR γ and ε subunit gene expression in t-NMOs. Data are normalized to MHC gene expression and displayed as fold change over the samples derived in absence of dSkM. Data are shown as mean ± s.d. of 3 independent biological replicates from a single differentiation experiment. Unequal variance Student’s t-test was used; ****P  < 0.001. f Schematic illustration showing the strategy used for testing neuromusuclar function in t-NMO. Glutamate (Glu) was supplemented to induce neural-mediated release of acetylcholine (ACh) and muscle response (NMJ, neuromuscular junction). g Representative images showing displacement of t-NMO after Glu stimulation before (untreated) and after 12 h of treatment with BoNTA or BTX. Dotted lines are used to better visualize t-NMO displacement. Scale bar, 150 μm. h Representative quantification of normalized fluorescence intensity variation registered during contraction of t-NMOs stimulated with Glu after 12 h of treatment with BoNTA or BTX. As control, t-NMOs not treated with neurotoxins were analyzed (t-NMO no toxins). Data are shown as mean ± s.d. of 3 independent biological replicates from a single differentiation experiment. Dotted lines correspond to the baseline equal to 0. i Violin plot showing the maximum displacement of t-NMOs upon Glu stimulation before (–) and after (+) 12 h of treatment with BoNTA or BTX using PIVlab. Each violin represents the displacement vectors obtained from 3 biological replicates per each experimental condition generated from a single differentiation experiment (vector number analyzed ≥3147 per each experimental condition). One-way ANOVA with Tukey’s multiple comparisons test was used, ****P  < 0.001. Statistical results are reported in Supplementary Table 7. j Left panel, representative images of t-NMO loaded with Fluo-4 before (pre-Glu) and after (post-Glu) Glu stimulation. Scale bar, 500 μm. Right panel, representative mean of Fluo-4 fluorescence intensity variation during time of live imaging acquisition in t-NMOs upon Glu stimulation. Dotted lines correspond to the baseline normalized to 0. In the right panel, data are shown as mean ± s.d. of 3 independent biological replicates. k Quantification of calcium peak amplitude (ΔF/F0) detected with Fluo-4 live imaging analysis upon Glu stimulation of t-NMOs before (i.e., 0 h from treatment; –) or after 12 h of treatment (+) with BoNTA or BTX. As control, t-NMOs not treated with neurotoxins were analyzed at 0 and 12 h (–). The fluorescence intensity peak (F) registered during stimulation was measured and normalized to the baseline fluorescence intensity registered before neurotransmitter stimulation (F0). Data are shown as mean ± s.d. of 3 independent biological replicates from a single differentiation experiment. One-way ANOVA with Tukey’s multiple comparisons test, n.s. not significant, **P  =  0.0006, ***P  =  0.0009. Statistical results are reported in Supplementary Table 8.
Fig. 5
Fig. 5. DMD t-NMOs reproduce dysfunctional activity of the skeletal muscle compartment 30 days after hiPSC-differentiation.
a Schematic illustration showing the strategy used for producing patient specific t-NMOs from healthy donors (Health) or patients affected by Duchenne muscular dystrophy (DMD). b Representative confocal Z-stack immunofluorescence images of DMD1 t-NMO stained for desmin (magenta) and TUJ-1 (green). Scale bars, 200 μm. c Principal component analysis (PCA) of t-NMO samples from BJ-hiPSCs (black) and DMD1 t-NMOs (red). Each dot represents a single t-NMO. Statistical results are in Supplementary Data 3. d Representative whole mount immunofluorescence staining for TUJ-1 (green) and desmin (magenta) of HD1-3, DMD2, DMD3 and DMD4 t-NMOs after 30 days of hiPSC differentiation. Scale bar 200 μm. e Scatter dot plot showing the mean area occupied by muscular (desmin+) or neuronal (TUJ-1+) cells in t-NMOs derived from BJ1-3 (black), HD1-3 (scale of green), DMD1 (red), DMD2 (orange), DMD3 (blue) and DMD4 (violet). Data are shown as mean ± s.d. of ≥ 3 independent biological replicates; each dot represent a t-NMO. Each hiPSC line was used for at least one independent t-NMO differentiation experiment. One-way ANOVA with Tukey’s multiple comparisons test; n.s., not significant. Statistical results are reported in Supplementary Table 9. f Western blot for dystrophy (DYS, upper) and actin (ACT, lower) in BJ1 (black), HD1-3 (scale of green), DMD1 (red), DMD2 (orange), DMD3 (blue) and DMD4 (violet) t-NMOs. As negative control we used dSkM (empty circle). In each lane, proteins extracted from 3 independent biological replicate were loaded. g Representative quantification of mean normalized fluorescence intensity variation registered during contraction of t-NMOs stimulated with Glu derived from BJ (black), HD1-3 (scale of green), DMD1 (red), DMD2 (orange), DMD3 (blue) and DMD4 (violet). Data are shown as mean ± s.d. of ≥ 3 independent biological replicates. Each hiPSC line was used for 1 to 3 independent t-NMO differentiation experiments. h Violin plot showing the maximum displacement of t-NMOs stimulated with Glu and derived from BJ1-3 (black), HD1-3 (scale of green), DMD1 (red), DMD2 (orange), DMD3 (blue) and DMD4 (violet) using PIVlab. Each violin represents the mean of the displacement vectors obtained from 3 biological replicates per experimental condition (vector number analyzed ≥7580). Each hiPSC line was used for 1 to 3 independent t-NMO differentiation experiments. One-way ANOVA with Tukey’s multiple comparisons test showing the statistically significant differences among BJ1-3 and DMD1-4 t-NMOs (*) or HD1-3 and DMD1-4 t-NMOs ($) are reported in Supplementary Table 11. i Representative polar charts showing quantification of the maximum displacement (μm) and of the displacement directionality (angle, degree) obtained with PIVlab analysis of t-NMOs stimulated with Glu and derived from BJ1-3 (black), HD1-3 (scale of green), DMD1 (red), DMD2 (orange), DMD3 (blue) and DMD4 (violet). j Quantification of calcium peak amplitude (ΔF/F0) detected with Fluo-4 live imaging analysis upon Glu and ACh stimulation of t-NMOs derived from HD1-3 (scale of green), DMD1 (red), DMD2 (orange), DMD3 (blue) and DMD4 (violet). The fluorescence intensity peak (F) during stimulation was measured and normalized to the baseline fluorescence intensity registered before neurotransmitter stimulation (F0). Data are shown as mean ± s.d. of 3 biological replicates per each condition; each dot represent a t-NMO. Each hiPSC line was used for one independent t-NMO differentiation experiment. One-way ANOVA with Tukey’s multiple comparisons test showing the statistically significant differences among HD1-3 and DMD1-4 t-NMOs (*) are reported in Supplementary 12. k Upper panels, representative ROIs for Fluo-4 fluorescence imaging analysis of HD t-NMOs and DMD t-NMOs. Scale bar 100 μm. Lower panels, representative Fluo-4 fluorescence intensity variation during time of live imaging acquisition in HD1 t-NMOs and DMD1-4 t-NMOs upon Ach stimulation. Dotted lines correspond to the baseline normalized to 0. Data are shown 3 independent replicates (#) per each sample type, and 3 ROIs (n) for each biological replicate. Each hiPSC line was used for one independent t-NMO differentiation experiment.

References

    1. Urzi, A. et al. Efficient generation of a self-organizing neuromuscular junction model from human pluripotent stem cells. Nat. Commun. 14, 1–15 (2023). - PMC - PubMed
    1. Fralish, Z., Lotz, E. M., Chavez, T., Khodabukus, A. & Bursac, N. Neuromuscular development and disease: Learning from in vitro and in vivo Models. Front. Cell Dev. Biol.9, 1–35 (2021). - PMC - PubMed
    1. Faustino Martins, J. M. et al. Self-organizing 3D human trunk neuromuscular organoids. Cell Stem Cell26, 172–186.e6 (2020). - PubMed
    1. Zhang, K., Bai, L., Xu, W. & Shen, C. Human neuromuscular junction three-dimensional organoid models and the insight in motor disorders. J. Mol. Cell Biol.13, 767–773 (2021). - PMC - PubMed
    1. Pereira, J. D. et al. Human sensorimotor organoids derived from healthy and amyotrophic lateral sclerosis stem cells form neuromuscular junctions. Nat. Commun. 12, 1–17 (2021). - PMC - PubMed

LinkOut - more resources