. 2025 Jul 19;22(1):190.
doi: 10.1186/s12974-025-03517-0.

Activated TBK1 promotes ACSL1-mediated microglia lipid droplet accumulation and neuroinflammation in Parkinson's disease

Affiliations

Activated TBK1 promotes ACSL1-mediated microglia lipid droplet accumulation and neuroinflammation in Parkinson's disease

Chunlei Han et al. J Neuroinflammation. .

Abstract

Microglia-mediated neuroinflammation plays a crucial role in the progression of Parkinson’s disease (PD). Dysregulation of lipid droplet homeostasis is a significant factor affecting microglial inflammatory responses, but the mechanisms underlying lipid droplet imbalance in PD are currently unclear. Here, we report a subtype of microglia characterized by high expression of long-chain acyl-CoA synthetase 1 (ACSL1) through single-nucleus RNA sequencing analysis and machine learning algorithms, linking lipid metabolism to PD neuroinflammation. The results of multiple loss- and gain-of-function experiments indicate that ACSL1 localized to the endoplasmic reticulum (ER) promotes lipid droplet accumulation to exacerbate microglial activation and dopaminergic neurons death. Mechanistically, activation of TANK-binding kinase 1 (TBK1) leads to the enrichment of ACSL1 on the endoplasmic reticulum, which generates acyl-CoA that are channelled for lipid droplet biogenesis. Additionally, high expression of ACSL1 promotes activation of TBK1 through Nrdp1-mediated K63 ubiquitination of TBK1, which triggers the amplification of the aforementioned biological effects. Moreover, NF-κB directly binds to the ACSL1 promoter and positively regulates its transcription, resulting in increased ACSL1 expression in microglia. Our findings suggest that manipulating lipid droplet biogenesis by modulating ACSL1 may be a potential strategy for treating neuroinflammation in PD patients.

Supplementary Information: The online version contains supplementary material available at 10.1186/s12974-025-03517-0.

Keywords: ACSL1; Lipid droplet; Microglia; Neuroinflammation; Parkinson’s disease; TBK1.


Conflict of interest statement

Declarations. Ethical approval: All experimental protocols complied with international guidelines and were conducted under the supervision of the Ethics Committee of Beijing Neurosurgical Institute, Capital Medical University (protocol no. BNI202308002). Consent for publication: Not applicable. Competing interests: The authors declare no competing interests.

Figures
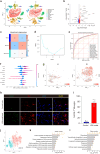
Fig. 1
Fig. 1
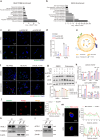
snRNA-seq reveals unique transcriptomic features of ACSL1high microglia in the substantia nigra in PD patients. a, T-distributed stochastic neighbour embedding (t-SNE) of human midbrain nuclei. Cells are coloured by cell type, and each point represents a single cell. b, Volcano plot showing significant DEGs in PD versus HC microglia. The dashed line represents an adjusted P value < 0.05 as the cutoff. c, WGCNA was conducted using the expression data of DEGs to identify the disease state. d, The RFE algorithm was used to obtain feature genes from the WGCNA Brown module. e, Cross-validation of machine learning models to obtain the average ROC curve. f, A bee swarm plot showing the feature importance ranking derived from the SV algorithm. The top 10 genes in terms of feature importance ranking are displayed. g, Expression of ACSL1 in microglia in the HC and PD groups; each point represents a single cell. h, Representative immunofluorescence images of the control mouse (n = 5) and LPS-PD mouse (n = 5) SN region stained for the microglial markers IBA1 (red) and ACSL1 (green) and stained with DAPI (blue). Scale bars, 20 μm. P-value determined by unpaired, two-tailed Student’s t-test. i, Quantification of percentage of IBA1 + microglia positive for ACSL1. j, Microglia in the substantia nigra of PD patients were classified into ACSL1high and ACSL1low subpopulations based on unsupervised clustering and ACSL1 expression levels. k-l, GO-BP (Gene Ontology Biological Process) and KEGG (Kyoto Encyclopedia of Genes and Genomes) analyses were used to investigate the functions of PD ACSL1high microglia
Fig. 2
Fig. 2
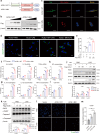
Effects of ACSL1 knockdown on microglia-mediated neuroinflammation in vitro and in vivo. a, Relative mRNA expression of the proinflammatory cytokines IL-6, IL-1β and TNFα after LPS (100 ng/ml) treatment for 18 h in primary microglia transfected with NC or si-ACSL1. b, IL-6, IL-1β and TNFα concentrations in the medium of primary microglia transfected with NC or si-ACSL1 after LPS treatment for 18 h. c, NO concentration in the medium of primary microglia transfected with NC or si-ACSL1 treated with or without LPS for 18 h. d, ROS fluorescence intensity of primary microglia transfected with NC or si-ACSL1 after treatment with PBS or LPS for 18 h. e, The protein expression levels of iNOS, COX2 and mature IL-1β in primary microglia were determined by Western blot analysis. β-actin was used as a loading control. f, A schematic diagram showing the animal experimental procedure. g, The colocalization of EGFP (green) and IBA1 (red) in the mouse SNpc region. Scale bar, 20 μm. h-i, Western blot (k) and quantification (l) of ACSL1 in SNpc region tissues from mouse brains. β-actin was used as a control. (n = 3 per mice group). j, Representative images of IBA1+ cells and GFAP+ cells in the SNpc region of mice in the NC + PBS, NC + LPS, shACSL1#1 + LPS and shACSL1#2 + LPS groups. Scale bar, 200 μm. k, l, Representative images (k) and quantification (l) of TH+ cells in the striatum and SNpc region of mice in the NC + PBS (n = 5), NC + LPS (n = 5), shACSL1#1 + LPS (n = 5) and shACSL1#2 + LPS (n = 5) groups. Scale bars, 500 μm and 200 μm. m-n, Western blot (m) and quantification (n) of α-Syn in SNpc region tissues from mouse brains. β-actin was used as a control. (n = 3 mice per group). o-p, Behavioural tests two weeks after PBS or LPS stereotaxic intrastriatal injection in NC- or sh-ACSL1 AAV-treated mice. (o) Rotarod test and (p) pole test. (n = 8 mice per group). All data are shown as mean ± SEM using one-way ANOVA. Multiple comparison corrections were applied via Dunnett’s multiple comparisons test. ***P < 0.001; **P < 0.01; *P < 0.05; ns, not significant
Fig. 3
Fig. 3
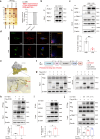
ACSL1 knockdown inhibits lipid droplet formation. a-b, Reactome and KEGG enrichment was used to visualize the metabolic pathways of ACSL1high microglia. c-d, Transfected BV2 cells were treated with PBS or LPS (1 µg/ml) for 18 h. Representative micrographs of BODIPY-stained BV2 cells. (c) Quantification of the BODIPY fluorescence per cell (d). e, Schematic representation of the structural composition of an LD. Coloured objects represent LD surface-bound proteins localized to the phospholipid monolayer. Triacylglycerols and sterol esters are found in the neutral lipid core. f, Representative confocal images of transfected BV-2 cells after treatment with LPS and coadministration of chloroquine (20 µM) for 12 h. Scale bar, 20 μm. g, The expression of p62 and LC3B was assessed by Western blot in BV-2 cells transfected with NC or si-ACSL1 after treatment with LPS and cotreated with chloroquine. h-i, The relative mRNA expression of lipolysis markers (h) and lipid uptake markers (i) in BV-2 cells transfected with NC or si-ACSL1 after treatment with LPS or PBS. j, Colocalization of BODIPY (green) and ACSL1 (red) in BV-2 cells. k, The expression levels of ACSL1 in the mitochondrial and cytosolic fractions of BV-2 cells were assessed by Western blotting. Tomm20 was used as a mitochondrial fraction marker. l, The expression levels of ACSL1 in the ER fractions of BV-2 cells were assessed by Western blotting. Calreticulin was used as an ER fraction marker. m, The colocalization of ACSL1 (green) and MitoTracker (red) in BV-2 cells was analysed by confocal microscopy. Quantification of fluorescence colocalization was performed with ImageJ. All data are shown as mean ± SEM using one-way ANOVA. Multiple comparison corrections were applied via Dunnett’s multiple comparisons test. ***P < 0.001; **P < 0.01; *P < 0.05; ns, not significant
Fig. 4
Fig. 4
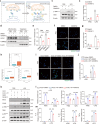
ACSL1 exacerbates microglial inflammatory responses by promoting lipid droplet accumulation. a, Schematic representation of the ACSL1-WT and ACSL1-MN sequences. b, Exogenous ACSL1 expression was detected by Western blot analysis after transfection of BV-2 cells with Flag-ACSL1-WT or Flag-ACSL1-MN into BV-2 cells. c, Immunofluorescence micrographs after transfection of BV-2 cells Flag-ACSL1-WT or Flag-ACSL1-MN. Mito-tracker was used to label mitochondria. d-e, Transfected ACSL1-WT or ACSL1-MN BV2 cells were treated with PBS or LPS (1 µg/ml) for 18 h. Representative micrographs of BODIPY-stained microglia cells (b) and quantification of BODIPY fluorescence per cell. f-j, Relative IL-6, IL-1β, and TNFα mRNA levels; (f) IL-6, IL-1β, and TNFα concentrations; (g) NO concentration; (h) relative ROS fluorescence (i) and iNOS, COX2 and IL-1β expression (j) were measured in primary microglia transfected with ACSL1-WT or ACSL1-MN after LPS treatment. k, Primary microglia cells were transfected with ACSL-WT or ACSL1-MN for 48 h and then exposed to LPS (100 ng/ml) for 24 h. Then, the conditioned media from different groups were collected to culture the SH-SY5Y cells for 24 h. After treatment, the SH-SY5Y cells were subjected to immunoblot analyses to assess the protein levels of PARP, Cleaved-PARP, caspase3, Cleaved-caspase3 and β-actin. l-m, Microglia cells were treated as described in (l), and SH-SY5Y cells were subjected to TUNEL staining to assess cell apoptosis. Scale bar, 50 μm. Quantitative analyses are shown in panel (m). All data are shown as mean ± SEM using one-way ANOVA. Multiple comparison corrections were applied via Dunnett’s multiple comparisons test. ***P < 0.001; **P < 0.01; *P < 0.05; ns, not significant
Fig. 5
Fig. 5
ACSL1 has increased binding affinity for inactive TBK1 in microglia. a, Identification of TBK1 sequences in BV-2 cells immunoprecipitated with an anti-Flag antibody using mass spectrometry analysis. b, IP analysis of endogenous ACSL1 in BV-2 cells. c, IP analysis of endogenous TBK1 in BV-2 cells treated with or without LPS for 18 h. d, Representative immunofluorescence images showing the colocalization of ACSL1 and TBK1 in BV-2 cells treated with or without LPS. Scale bar, 10 μm. Right, Statistical analysis of the colocalization of ACSL1 and TBK1 in BV-2 cells. e, Molecular docking simulation of ACSL1 and TBK1. f-g, IP analysis with ACSL1-overexpressing and TBK1-WT or TBK1-truncated constructs in the HEK293T cell line. Schematic representation of TBK1 WT or TBK1 truncated constructs. (f) Co-IP assay (g). h, IP analysis of HEK293T cells overexpressing ACSL1 (WT or MN) and TBK1 in HEK293T cell line. i, IP analysis of TBK1 WT or TBK1 K38 A overexpression and endogenous ACSL1 expression in BV-2 cells. j, IP analysis of ACSL1 and TBK1 overexpression (WT, K38 A, S172A) in the HEK293T cell line. ***P < 0.001; **P < 0.01; *P < 0.05; ns, not significant
Fig. 6
Fig. 6
Inhibition of TBK1 suppresses ACSL1-induced lipid droplet accumulation. a, Schematic representation of the interaction between TBK1 and ACSL1, which results in the enrichment of ACSL1 in different cellular compartments, thereby influencing lipid droplet homeostasis in microglia. Upper panel, resting microglia. Lower panel, activated microglia. b-c, Western blot analysis and quantification of BV-2 cells treated with PBS or LPS (1 µg/ml) for 12 h, with or without cotreatment with GSK8612 (5 μm) for 6 h, to assess the expression levels of p-TBK1S172 and TBK1. d-e, Western blot analysis and quantification of BV-2 cells treated with LPS with or without GSK8612 to assess the expression levels of ACSL1 in the mitochondrial and cytosolic fractions. Tomm20 was used as a mitochondrial fraction marker. f-g, Representative micrographs of BODIPY-stained BV-2 cells (f) and quantification of the number of BODIPY-treated BV-2 cells (g) treated with or without GSK8612. P values were calculated via an unpaired, two-tailed Student’s t test. h, Consensus clustering showing that activation of TBK1 was associated with increased ACSL1 expression and lipid droplet metabolism in PD microglia. i-j, Representative micrographs of BODIPY-stained cells (i) and quantification of BODIPY fluorescence per cell (j) after LPS treatment of ACSL1-WT-transfected BV-2 cells treated with or without GSK8612. P values were calculated by one-way ANOVA with Dunnett’s adjustment. k‒l, Western blot analysis and quantification of the expression levels of iNOS, COX2, p-TBK1S172, TBK1, p-p65S536 and p65 in BV-2 cells. m, Relative mRNA levels of the proinflammatory cytokines IL-6, IL-1β and TNFα after LPS treatment of ACSL1-WT-transfected BV-2 cells treated with or without GSK8612. P values were calculated by one-way ANOVA with Dunnett’s adjustment. The data are shown as the mean ± SEM from three independent experiments. ***P < 0.001; **P < 0.01; *P < 0.05; ns, not significant
Fig. 7
Fig. 7
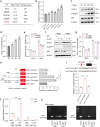
p65/RELA occupies the ACSL1 promoter. a, Transcription factor enrichment analysis of ChEA3 for significant DEGs (P value < 0.05) in ACSL1high versus ACSL1low microglia. b, The expression of ACSL1 was determined by RT‒qPCR. BV-2 cells were cultured with TNFα (20 ng/ml). c-d, Western blot analysis and quantification of BV-2 cells treated with TNFα (20 ng/ml). e, RT‒qPCR analyses of TNFα-treated NC- or si-p65-transfected BV-2 cells. f-g, Western blot analysis and quantification of TNFα-treated NC- or si-p65-transfected BV-2 cells. h, Luciferase activity of the ACSL1 promoter fragment fused to a luciferase reporter gene overexpressing p65 in the HEK293T cell line. i, p65 binding site mutations in the ACSL1 promoter were constructed. Luciferase activity of the WT or mutated ACSL1 constructs overexpressing p65 in the HEK293T cell line. j-k, Chromatin was immunoprecipitated from BV-2 cells and stimulated with LPS (100 ng/mL) for 3 h using an antibody against p65/RELA along with an isotype-matched IgG control. The percentage of precipitated DNA relative to total input DNA is shown (j), and the agarose gel electrophoresis results are shown (k). All data are shown as mean ± SEM using one-way ANOVA. Multiple comparison corrections were applied via Dunnett’s multiple comparisons test. ***P < 0.001; **P < 0.01; *P < 0.05; ns, not significant
Fig. 8
Fig. 8
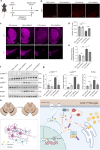
Effects of targeting TBK1 on restraining PD neuroinflammation progression. a, A schematic diagram showing the animal experimental procedure. b, Representative images of IBA1+ cells in the SNpc region of the mice in the PBS + Vehicle (n = 5), LPS + Vehicle (n = 5), PBS + GSK8612 (n = 5) and LPS + GSK8612 (n = 5) groups. Scale bar, 200 μm. c-d, Representative images (c) and quantification (d) of TH+ cells in the striatum and SNpc regions of the mice in the PBS + Vehicle (n = 5), LPS + Vehicle (n = 5), PBS + GSK8612 (n = 5) and LPS + GSK8612 (n = 5) groups. Scale bar, 200 μm. e, The quantification of ER-ACSL1 protein of SNpc region microglia in the PBS + Vehicle (n = 3), LPS + Vehicle (n = 3), PBS + GSK8612 (n = 3) and LPS + GSK8612 (n = 3) groups. f-g, Western blot analysis of the SNpc region of the mice in the PBS + Vehicle (n = 3), LPS + Vehicle (n = 3), PBS + GSK8612 (n = 3) and LPS + GSK8612 (n = 3) groups. The expression (g) and quantification (h) of p-TBK1S172, TBK1, p-p65S536, p65 and PLIN3. h, A schematic diagram showing the mechanism of ACSL1 promotes lipid droplet accumulation to exacerbate neuroinflammation in PD. All data are shown as mean ± SEM using one-way ANOVA. Multiple comparison corrections were applied via Dunnett’s multiple comparisons test. ***P < 0.001; **P < 0.01; *P < 0.05; ns, not significant

References

    1. Bloem BR, Okun MS, Klein C. Parkinson’s disease. Lancet. 2021;397:2284–303. - PubMed
    1. Ransohoff RM. How neuroinflammation contributes to neurodegeneration. Science. 2016;353:777–83. - PubMed
    1. Zhu B, Yin D, Zhao H, Zhang L. The immunology of parkinson’s disease. Semin Immunopathol. 2022;44:659–72. - PMC - PubMed
    1. Stefanova N. Microglia in parkinson’s disease. J Parkinsons Dis. 2022;12:S105–12. - PMC - PubMed
    1. Gao C, Jiang J, Tan Y, Chen S. Microglia in neurodegenerative diseases: mechanism and potential therapeutic targets. Signal Transduct Target Ther. 2023;8:359. - PMC - PubMed

LinkOut - more resources