. 2025 Aug 26;44(8):115927.
doi: 10.1016/j.celrep.2025.115927. Epub 2025 Jul 19.

The antigen presentation landscape of cytokine-stressed human pancreatic islets

Affiliations

The antigen presentation landscape of cytokine-stressed human pancreatic islets

Padma P Nanaware et al. Cell Rep. .

Abstract

Type 1 diabetes (T1D) arises from T cell-mediated destruction of insulin-secreting pancreatic β cells. Inflammatory triggers have been hypothesized to induce presentation of new epitopes for pathogenic T cells, but the naturally processed MHC-bound peptides presented by primary human islet β cells are largely unknown. We used mass spectrometry to identify native and post-translationally modified self-peptides presented by MHC proteins from human cadaveric islet samples treated in vitro with cytokines to identify epitopes in an inflamed pancreas. Of >4,300 islet peptides presented by 60 different MHC molecules, we identified 28 autoimmune epitopes targeted by T cells from patients with T1D, 31 additional epitopes from previously identified autoantigens, and 100 additional candidate autoantigens. The epitopes derive from inflammation, unfolded protein response, and secretory hormone processing pathways. These results identify naturally processed islet peptides targeted by autoimmune T cells in T1D and provide a resource for investigating T1D etiology and progression.

Keywords: CP: Immunology; CP: Metabolism; MHC protein; T cell epitope discovery; autoimmunity; immunopeptidome; islets of Langerhans; peptide elution; type 1 diabetes.


Conflict of interest statement

Declaration of interests The authors declare no competing interests.

Figures

Figure 1.
Figure 1.. Cytokine treatment of cultured human islets upregulates MHC-I and MHC-II antigen presentation pathways
(A) UMAP analysis of cultured islet RNA-seq data from two donors (HP-20289-1 and HP-20276, Table S1) showing α, β, and δ cells with smaller amounts of islet-associated ductal, acinar, and stellate cells, and low levels of immune cells. (B) Untreated and cytokine-treated islets (from donor HP-20289-1) were surface stained for CD45 and HLA-DR and intracellularly stained for insulin (Ins) and glucagon (GCG) on day 2 of culture. (C) HLA-DR surface staining of untreated and cytokine-treated samples with Ins+, GCG++, Ins-GCG, and CD45+ populations shown along with reference human B-lymphoblastoid cell line. (D) CD45+ immune cells, Ins+ β cells, and CD45-GCG-ins populations but not GCG+ α cells increased HLA-DR expression after cytokine treatment. (E and F) Volcano plots showing transcripts differentially expressed in bulk RNA sequencing of sorted E) β (CD45, GCG, Ins+), (F) α (CD45, GCG+, Ins+−), and (G) “negative” (CD45, GCG, Ins) populations before and after cytokine treatment from donor HP-20289–01. Red, genes upregulated >2-fold (padj < 0.05) by cytokine treatment, blue, genes downregulated by the same criteria. (H) Heatmap representing differential expression of MHC-I and MHC-II pathway components.
Figure 2.
Figure 2.. MHC-I and MHC-II immunopeptidomes from human islet and spleen samples
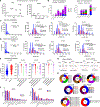
(A) Estimated amounts of HLA-DR from each donor plotted against the number of islets procured, with a similar plot for spleen samples. (B) The number of HLA-DR, DQ, DP and HLA-A, -B, -C peptides identified from the six islet and four spleen samples used for immunopepidome analyses. Two of the six islet samples were analyzed on a Thermo Q Exactive Orbitrap Mass Spectrometer, whereas the other four were analyzed on a Thermo Orbitrap Fusion Lumos Tribid Mass Spectrometer. (C and D) Length distributions for (C) islet and (D) spleen immunopeptidomes, with peptides present in nested sets for MHC-II immunopeptidome shown in red. (E) Predicted rank percentile for HLA-ABC (NetMHCpan 4.1) and HLA-DR, HLA-DQ, HLA-DP (NetMHCIIpan 4.2) peptides compared between pancreatic islets and homologous spleen samples. Horizontal lines show geometric means (**** p < 0.0001). (F) Cellular distribution of the source proteins from GO annotation., (G) Overlap MHC-I and MHC-II islet and spleen immunopeptidome for unique peptides and their source proteins. (H) Assignment of the eluted islet peptides to HLA allotypes from tissue donors. HLA alleles most strongly associated with increased risk for T1D in red, alleles associated with increased risk for T1D after accounting for linkage disequilibrium with the major DR-DQ risk haplotypes in blue, HLA molecules in the same allele family as risk alleles and cases where only low-resolution HLA typing was available in orange, and other alleles of interest in T1D research in magenta. See Table S1 legend for details.
Figure 3.
Figure 3.. Identification of post-translationally modified peptides
(A) MHC-I and MHC-II eluted immunopeptidomes from cytokine-treated human islets and matched spleen samples were analyzed for oxidative-stress-related PTMs. PTMs with A scores >13 (corresponding to statistical significance of p < 0.05 for probability of site localization) were summed for each modification based on the fraction of total intensity from peptides with modified as compared with non-modified residues. (B) PTMs identified on peptides derived from known autoantigens associated with T1D. (C) PTMs identified on peptides derived from new potential autoantigens.
Figure 4.
Figure 4.. Candidate T1D-associated epitopes and their source proteins
(A) Venn diagram showing overlap of eluted peptides deriving from proteins enriched in pancreas (red), genes upregulated >2-fold (padj < 0.05) in islet β cells from donors with T1D compared with non-diabetic controls (magenta), and genes upregulated >2-fold (padj < 0.05) in β cells from control donors after in vitro treatment with inflammatory cytokines (green). Previously characterized T1D cell epitopes (light blue) and new peptides identified from known T1D antigens (dark blue) are indicated. (B) Corresponding Venn diagram for source proteins of the eluted epitopes. (C–F) Rank distribution plots for the source proteins from HLA-ABC, HLA-DR, HLA-DQ, and HLA-DP immunopeptidomes. The precursor intensities for the peptides identified from each source proteins in ABC, or DR or DQ or DP elution were summed, ranked based on the total intensity and plotted. Known T1D antigens and the representative candidate auto-antigens are indicated for each graph.
Figure 5.
Figure 5.. Validation of T cell responses to candidate epitopes in donors with T1D and controls
(A) Response of PBMC-derived expanded CD8+ T cells for donor T1D-004 and control donor LSLP 074 to pools of candidate epitopes presented by HLA-A2 as measured by IFN-γ ELISpot. (B) Deconvolution of the response to positive pools. (C) Total response to individual peptides by expanded CD8+ T cells from five donors with T1D and two controls. (D) Summary of positive CD8 T responses observed in a total of four donors with T1D and two controls. No responses were observed for donors LSLP 074 and LSLP 095. (E) Response of PBMC-derived CD4+ T cells from donor T1D-008 and control donor LSLP 074, expanded in vitro, and tested for IFN-γ secretion in response to pools of candidate epitopes presented by HLA-DR3. (F) Deconvolution of the response to positive pools. (G) Response of same donors as € to a candidate epitope presented by HLA-DQ2.5. (H) Total response to individual peptides by expanded CD4+ T cells from five donors with T1D and two controls. (I) Summary of positive CD4 T responses observed in a total of five donors with T1D and two controls. (J) Sequence and source genes for candidate epitopes validated by PBMC responses in T1D donors. (K) Summary of validated epitopes grouped according to source protein characteristics. (A–H and I) Bars represent mean responses, and error bars the standard deviation. Peptides, PHA tested in duplicate; DMSO controls 4–10 replicates. Red asterisks and large symbols in (D and I) show statistically significant ELISpot responses at DFR2x level, blue asterisks and small symbols DFR1x. Significance of differences between T1D and control donors assessed by Student’s t test with Welch’s correction. For plots and statistical tests, wells for which no T cell response was observed were assigned an imputed minimum value equal to the assay detection limit of 0.3 spw. T cell lines were generated by a single in vitro expansion of CD4 and CD8 T cells with peptide pools.
Figure 6.
Figure 6.. T cell lines derived from islets of donors with T1D recognize peptides from the immunopeptidome of inflammatory cytokine-treated islets
A2-derived peptide pools and peptides (Table S9) recognized by islet-derived T cells lines from donor 6551 with IFN-γ, TNF-α, and IL-10 secretion are shown (A–C). A2-derived peptide pool recognized by islet-derived T cells lines from donor 6578 with IFN-γ and TNF-α secretion are shown (D and E) and in IFN-γ ELISpot; statistically significant responses are indicated by red and blue asterisks for DFR2x and DFR1x, as in Figure 5 (F). DR3-derived peptide pool and peptide recognized by islet-derived T cell lines from donor 6550 with IFN-γ and IL-10 secretion are shown (G and H). DR3 peptides and peptide pool recognized by islet-derived T cells lines from donor 6579 with IFN-γ, TNF-α, and IL-10 secretion are shown (I–K). Cytokines not detected are not shown. Sequence and source genes for candidate epitopes, modifications in red, validated by islet-derived T cell responses from donors with T1D are shown (L). Positive responses to PHA are indicated in each panel. Control peptides for A*02:01 reactivity is West Nile virus (WNV)430–439 and for DRB1*03:01 reactivity is sperm whale myoglobin (SWM)137–148, respectively, and were used as comparators in paired parametric Student’s t tests (GraphPad Prism version 10.2.1) and statistically significant responses are indicated (*p < 0.05, **p < 0.01, ***p < 0.001). Bars show mean responses and error bars show standard deviation.

References

    1. Piganelli JD, Mamula MJ, and James EA (2020). The Role of β Cell Stress and Neo-Epitopes in the Immunopathology of Type 1 Diabetes. Front. Endocrinol 11, 624590. 10.3389/fendo.2020.624590. - DOI - PMC - PubMed
    1. Rodriguez-Calvo T, Johnson JD, Overbergh L, and Dunne JL (2021). Neoepitopes in Type 1 Diabetes: Etiological Insights, Biomarkers and Therapeutic Targets. Front. Immunol 12, 667989. 10.3389/fimmu.2021.667989. - DOI - PMC - PubMed
    1. James EA, Mallone R, Kent SC, and DiLorenzo TP (2020). T-Cell Epitopes and Neo-epitopes in Type 1 Diabetes: A Comprehensive Update and Reappraisal. Diabetes 69, 1311–1335. 10.2337/dbi19-0022. - DOI - PMC - PubMed
    1. Shapiro IE, and Bassani-Sternberg M (2023). The impact of immunopeptidomics: From basic research to clinical implementation. Semin. Immunol 66, 101727. 10.1016/j.smim.2023.101727. - DOI - PubMed
    1. Stern LJ, and Santambrogio L (2016). The melting pot of the MHC II peptidome. Curr. Opin. Immunol 40, 70–77. 10.1016/j.coi.2016.03.004. - DOI - PMC - PubMed

MeSH terms

LinkOut - more resources