. 2025 Jul 21;10(1):229.
doi: 10.1038/s41392-025-02308-6.

Differential expression pattern of CC chemokine receptor 7 guides precision treatment of hepatocellular carcinoma

Affiliations

Differential expression pattern of CC chemokine receptor 7 guides precision treatment of hepatocellular carcinoma

Jie Qin et al. Signal Transduct Target Ther. .

Abstract

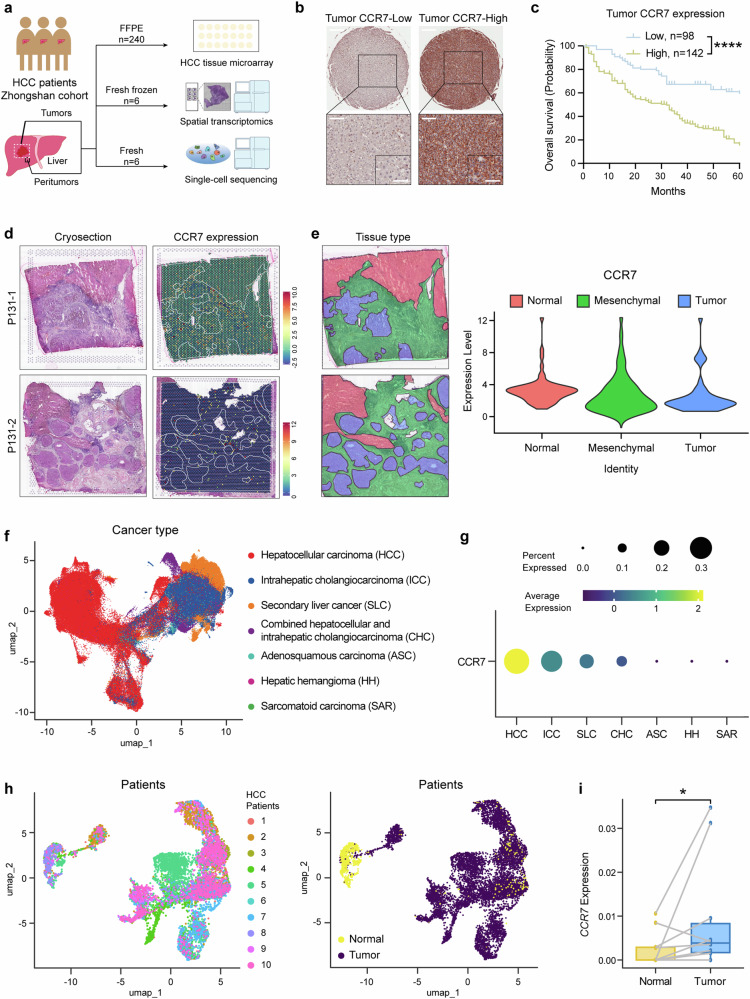
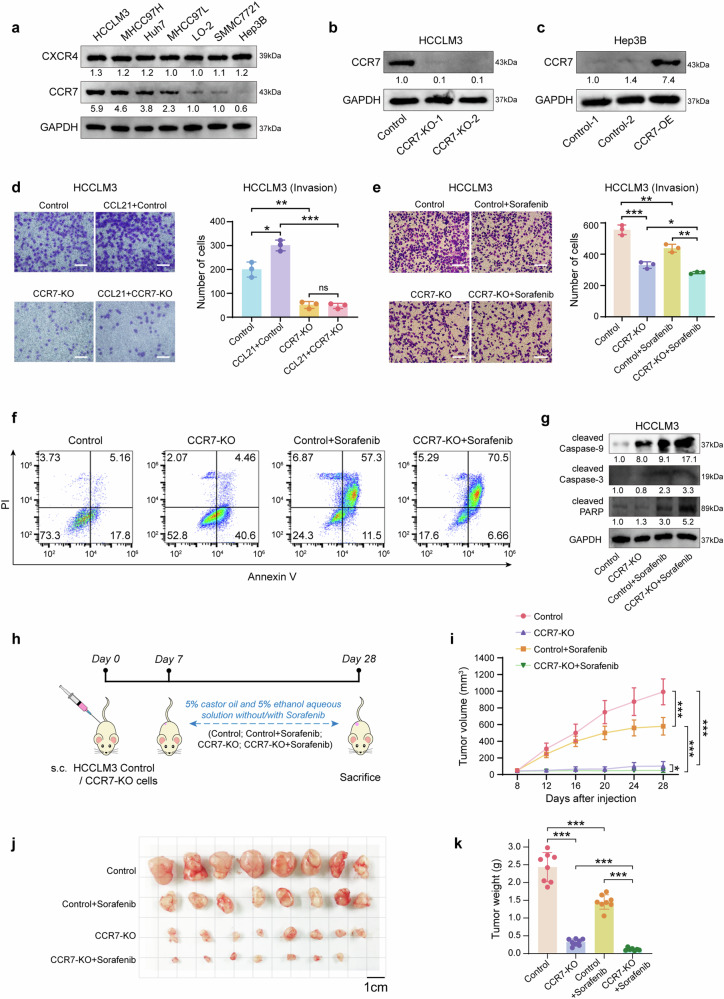
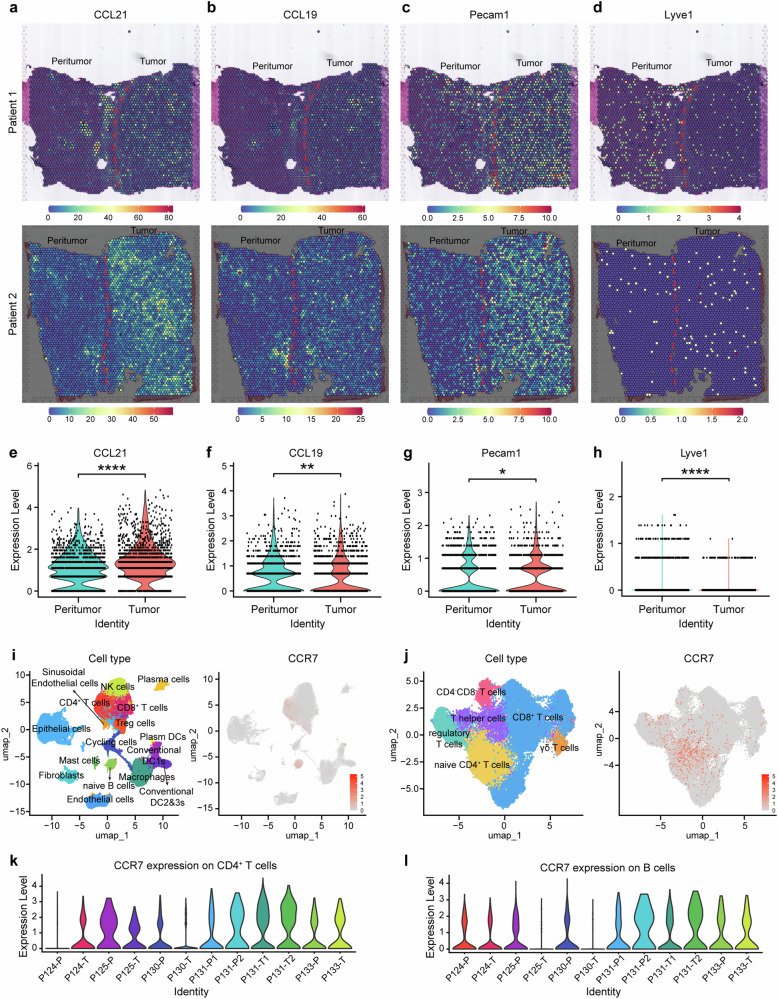
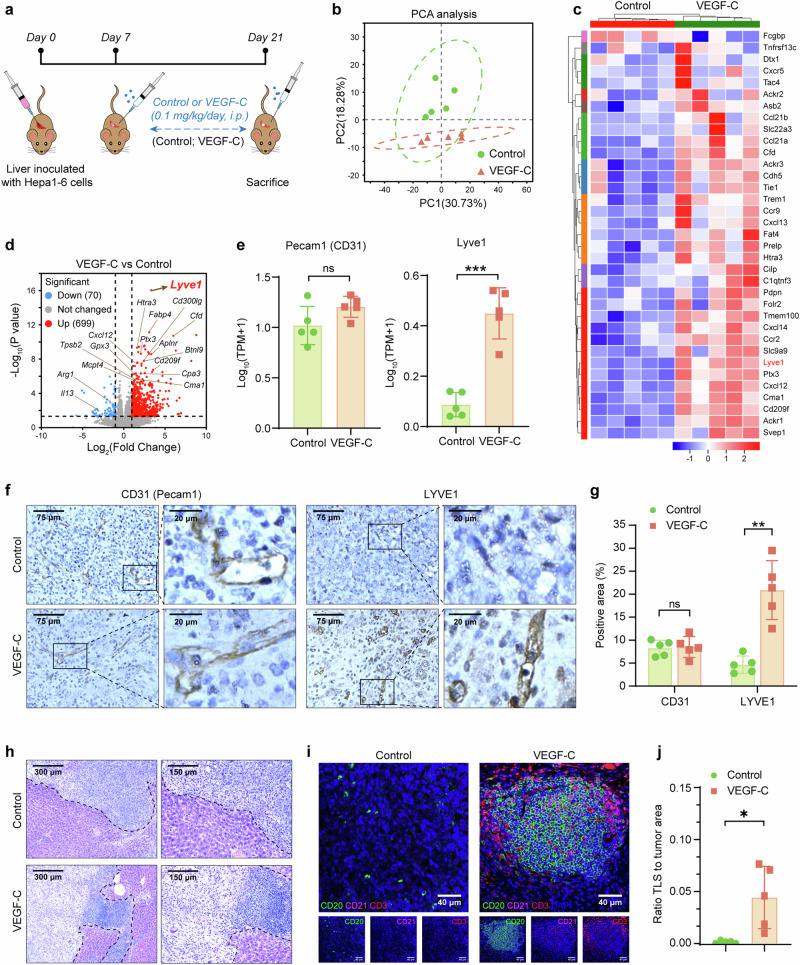
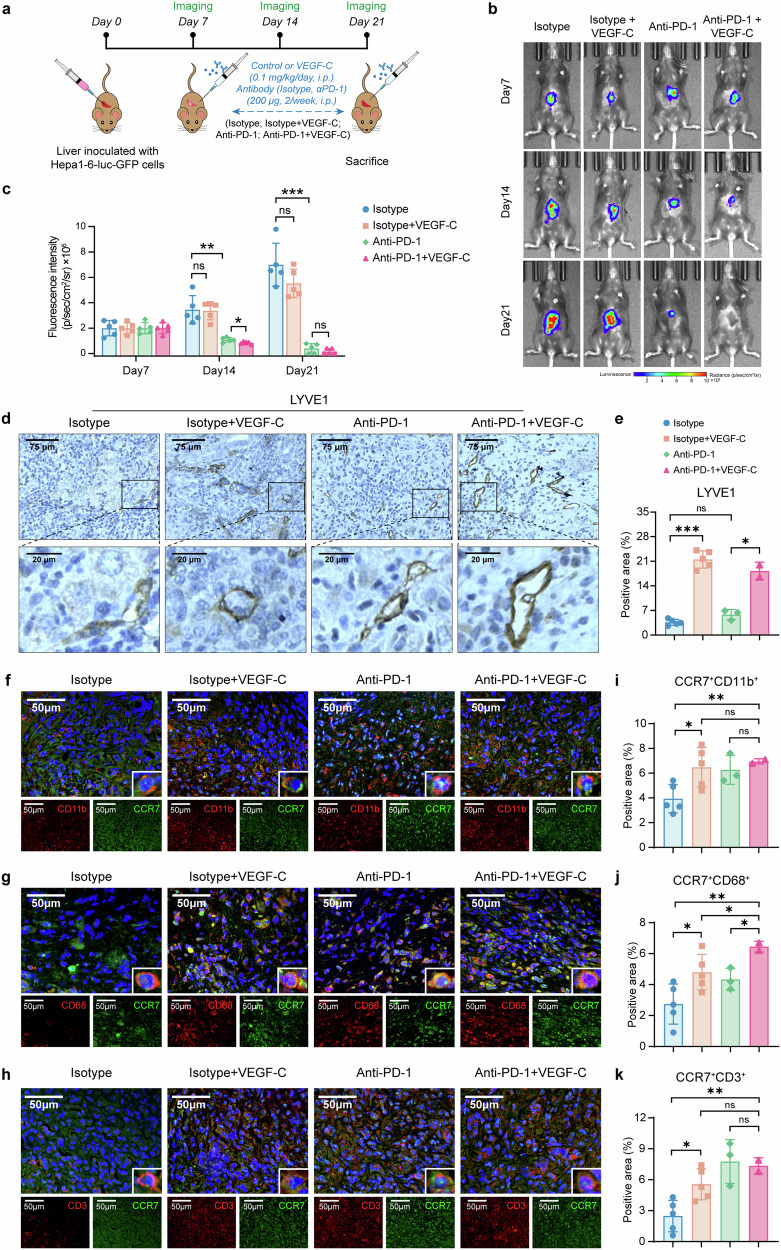
The treatment of hepatocellular carcinoma (HCC) faces challenges of low response rates to targeted drugs and immune checkpoint inhibitors, which are influenced by complicated microenvironment of HCC. In this study, the complex tumor microenvironment was identified by using tissue microarray (TMA), spatial transcriptomes and single-cell sequencing. High expression of CC chemokine receptor 7 (CCR7) in tumor cells predicted lower Overall Survival (OS). Conversely, CRISPR-Cas9-mediated knockout of CCR7 enhanced the sensitivity of HCC to sorafenib in preclinical experiments, resulting from the inhibition of epithelial-mesenchymal transition through the AKT and ERK signaling pathways. Simultaneously, we revealed CCR7 expression in stromal cells, with increased infiltration of CCR7+ immune cells into the tumor mesenchyme associated with high CCL21 expression at tumor sites. Subsequently, VEGF-C was identified as an independent predictor of higher patient OS and showed a significant positive correlation with CCR7 signaling. Interestingly, exogenous VEGF-C was found to promote the formation of tertiary lymphoid structures (TLSs) by activating lymphatic angiogenesis and the CCL21/CCR7 axis. As a result, VEGF-C treatment enhanced the efficacy of anti-PD-1 immunotherapy. This study highlights the opposing effects of tumor cell-derived versus stromal cell-derived CCR7 expression and guides the precision treatment for HCC.


Conflict of interest statement

Competing interests: The authors declare no competing interests.

Figures

Fig. 1
Fig. 1
CCR7 is highly expressed in the tumor site. a Schematic overview of experiments in this study. b The representative image of CCR7-Low or CCR7-High expression in HCC TMA by IHC staining. Scale bar (top): 500 μm. Scale bar (bottom-left): 100 μm. Scale bar (bottom-right): 50 μm. c The survival curves of HCC patients with low or high tumor CCR7 expression identified by TMA, n = 240. d Two cryosections were applied for spatial transcriptomics (left). The expression of CCR7 in HCC tissues (right). e The sections were divided into different areas according to the results of dimensionality reduction clustering and pathological diagnosis (left). The distribution of CCR7 in HCC tissues (right). f The uniform manifold approximation and projection (UMAP) plot displaying the distribution of 192,670 epithelial cells across different liver neoplastic diseases. Cells were colored by disease categories. g The mean level of CCR7 gene expression and the percentage of CCR7+ cells determined by scRNA-seq across different liver neoplastic diseases contexts. h UMAP plots showing the identities of 9,315 epithelial cells derived from HCC patients with paired normal and tumor samples. Cells were colored by patient (left) and by tissue type (right). i The average single-cell expression of CCR7 in epithelial cells from paired normal and HCC tumor samples. p value by two-sided log-rank test. *p < 0.05, **p < 0.01, ***p < 0.001, ****p < 0.0001 is considered statistically significant. Data are represented as mean ± SD
Fig. 2
Fig. 2
Blocking CCR7 signal enhances the sensibility of sorafenib. a The expression of CCR7 in human HCC cell lines was detected by Western Blot. b, c CCR7 expression after gene knockout (KO) on HCCLM3 (b) and overexpression (OE) on Hep3B (c). d The invasion ability of HCCLM3 was detected by trans-well assay after CCL21 stimulation (left). Quantitative analysis by using Image J (right). e The invasion ability of HCCLM3 was detected after the treatment of sorafenib (left). Quantitative analysis by using Image J (right). f The cell apoptosis was detected by flow cytometry. g The apoptosis-related proteins (cleaved Caspase-9, cleaved Caspase-3 and cleaved PARP) were detected by Western Blot. h The schedule of treatment in mice. i The tumor volume was monitored every four days in all groups. j The image of subcutaneous tumors on HCC mouse models was shown. k The tumor weight was presented. Data in (hk) were conducted in the same batch, n = 8. ns > 0.05, *p < 0.05, **p < 0.01, ***p < 0.001 by unpaired two-tailed Student’s t test. Data are represented as mean ± SD
Fig. 3
Fig. 3
Spatial transcriptomics and single-cell sequencing reveal infiltration of CCR7+ immune cells in tumor. ah The distribution of CCL21 (a), CCL19 (b), Pecam1 (c) and Lyve1 (d) in HCC tissues by spatial sequencing. Quantitative analysis of CCL21 (e), CCL19 (f), Pecam1 (g) and Lyve1 (h). i Single-cell sequencing was sorted from 6 tumors of HCC patients. UMAP visualization of single-cell sequencing data of non-tumor cells (left). CCR7 expression within non-tumor cells (right). j UMAP visualization of single-cell sequencing data of T cells (left). CCR7 expression within T cells (right). k, l CCR7 expression in CD4+ T cells (k) and B cells (l) between the tumor (-T) and corresponding peritumor tissues (-P). *p < 0.05, **p < 0.01, ***p < 0.001, ****p < 0.0001 by unpaired two-tailed Student’s t test. Data are represented as mean ± SD
Fig. 4
Fig. 4
VEGF-C is positively related with CCR7 expression in mesenchymal sites and identified as an independent predictor for OS of HCC patients. a Schematic overview of HCC TMA collection and analysis (n = 382). b The representative images of VEGF-C expression in peritumor and tumor sites in TMA. Scale bar (left):500μm. Scale bar (right):50μm. c The intensity distribution of VEGF-C expression in peritumor and tumor sites from HCC TMA. d The representative image of VEGF-C-Low or VEGF-C-High expression in peritumor sites from HCC TMA (n = 382). Scale bar (left):500μm. Scale bar (right):50μm. e The correlation between VEGF-C and CCR7 expression in the mesenchymal sites in HCC TMA. f Kaplan–Meier analyses of OS based on CCR7 in mesenchymal sites and VEGF-C in peritumor sites from HCC TMA. g Correlations between VEGF-C expression in peritumor sites and clinical characteristics of patients with HCC from TMA. h Univariate analysis of factors associated with OS of HCC patients from TMA. i Multivariate analysis of factors associated with OS of HCC patients from TMA. Data in (ai) were conducted in the same batch, n = 382. p value by two-sided log-rank test. ns > 0.05, *p < 0.05, **p < 0.01, ***p < 0.001 were considered statistically significant
Fig. 5
Fig. 5
CCL21/CCR7 signal is activated by VEGF-C administration, which promotes the TLSs formation by lymphatic angiogenesis. a The schedule of treatments in the orthotopic HCC mouse model. b The PCA analysis of transcriptome sequencing of tumor tissues from the orthotopic HCC mouse model. c, d The heatmap (c) and volcano plots (d) of differential expression genes from transcriptome sequencing. e The expression of Pecam1 (left) and Lyve1 (right) genes in tumor from transcriptome sequencing. f The representative images of CD31 and LYVE1 in tumor by IHC staining. g Quantitative analysis of (f) by using Image J. h The tumor and peritumor samples from orthotopic HCC mouse tumors were observed by H&E staining. i Multiplex immunofluorescence assay of TLSs was performed in the orthotopic HCC mouse model. j The ratio of tumor area occupied by TLSs was quantitatively analyzed using Image J. Data in (aj) were conducted in the same batch, n = 5. ns > 0.05, *p < 0.05, **p < 0.01, ***p < 0.001 by unpaired two-tailed Student’s t test. Data are represented as mean ± SD
Fig. 6
Fig. 6
VEGF-C increases the efficacy of Anti-PD-1 immunotherapy for HCC. a The schedule of imaging and treatments. b The representative images of luciferase signal in vivo. c The luciferase signal was monitored by in vivo imaging system once a week. n = 5. d The representative images of LYVE1 in tumor by immunohistochemical staining. e Quantitative analysis of (d) by Image J. fk The representative images of CCR7+CD11b+ cells (f), CCR7+CD68+ cells (g), CCR7+CD3+ cells (h) in tumor by immunofluorescence staining. Quantitative analysis of CCR7+CD11b+ cells (i), CCR7+CD68+ cells (j), CCR7+CD3+ cells (k) by Image J. Data in (ak) were conducted in the same batch, n = 5. ns > 0.05, *p < 0.05, ***p < 0.001 by unpaired two-tailed Student’s t test. Data are represented as mean ± SD
Fig. 7
Fig. 7
The graphical abstract of the study. CCR7 higher expression in tumor cells predicts lower Overall Survival (OS) of HCC patients, whereas knocking out CCR7 by CRISPR-cas9 enhances the sensitivity of tumor cells to sorafenib by inhibiting epithelial–mesenchymal transition (EMT) through the AKT and ERK signaling pathways. CCR7 is also expressed in stromal cells with the increased infiltration of CCR7+ immune cells into the tumor mesenchyme, which is enhanced by VEGF-C treatment by activating lymphatic angiogenesis and CCL21/CCR7 axis. High expression of VEGF-C in peritumor is identified as an independent predictor for higher OS of HCC patients, which is harnessed to increase the efficacy of anti-PD-1 immunotherapy by activating lymphatic angiogenesis and CCL21/CCR7 axis, and promoting the formation of tertiary lymphoid structures (TLSs). This figure was created using the online tools of SMART and Adobe Illustrator software

References

    1. Sung, H. et al. Global Cancer Statistics 2020: GLOBOCAN Estimates of Incidence and Mortality Worldwide for 36 Cancers in 185 Countries. CA Cancer J. Clin.71, 209–249 (2021). - PubMed
    1. Yang, C. et al. Evolving therapeutic landscape of advanced hepatocellular carcinoma. Nat. Rev. Gastroenterol. Hepatol.20, 203–222 (2023). - PubMed
    1. Pinter, M., Scheiner, B. & Pinato, D. J. Immune checkpoint inhibitors in hepatocellular carcinoma: emerging challenges in clinical practice. Lancet Gastroenterol. Hepatol.8, 760–770 (2023). - PubMed
    1. Cheng, A. L. et al. Efficacy and safety of sorafenib in patients in the Asia-Pacific region with advanced hepatocellular carcinoma: a phase III randomised, double-blind, placebo-controlled trial. Lancet Oncol.10, 25–34 (2009). - PubMed
    1. Li, Z. J. et al. Artesunate synergizes with sorafenib to induce ferroptosis in hepatocellular carcinoma. Acta Pharmacol. Sin.42, 301–310 (2021). - PMC - PubMed

MeSH terms