. 2025 Dec;17(1):2530157.
doi: 10.1080/19490976.2025.2530157. Epub 2025 Jul 20.

Blood-borne immune cells carry low biomass DNA remnants of microbes in patients with colorectal cancer or inflammatory bowel disease

Affiliations

Blood-borne immune cells carry low biomass DNA remnants of microbes in patients with colorectal cancer or inflammatory bowel disease

Yasser Morsy et al. Gut Microbes. 2025 Dec.

Abstract

The involvement of the intestinal microbiome in the pathogenesis of inflammatory bowel disease (IBD) and colorectal cancer (CRC), is well-established. Bacteria interact with immune cells at sites of intestinal inflammation, but also in the CRC tumor microenvironment. We hypothesized that bacterial remnants translocate within peripheral blood mononuclear cells (PBMCs) into the circulation and thus explored the composition of the detectable microbiome in PBMCs of patients with CRC or IBD compared to healthy controls. The PBMC microbiome profiles partially align with the tumor-derived or intestinal tissue-derived microbiome signatures obtained from the same patients with CRC or IBD, respectively. Our metagenomics data, supported by 16S-rRNA-FISH-Flow, imaging flow cytometry and species-specific qPCR, revealed the presence of translocated bacterial genetic sequences in the patients with CRC and IBD. Thus, our data suggest that in patients with intestinal barrier leakage, there is the potential for the translocation of bacterial remnants into the circulation via PBMCs.

Keywords: Microbiome; cancer and microbiome; colorectal cancer metastasis; inflammatory bowel disease pathogenesis; intestinal epithelial barrier defect; microbiome host interaction; peripheral blood mononuclear cells.


Conflict of interest statement

MS has shares and is co-founder of Recolony AG, Zurich, CH and has shares in PharmaBiome AG, Zurich, CH. MS served as Advisor for Abbvie, Gilead, Fresenius, Topadur, Takeda, Roche, Astra Zeneca and Celltrion. MS received speaker’s honoraria from Janssen, Falk Pharma, Vifor Pharma, Pileje and Bromatech. MS received research grants from Abbvie, Takeda, Gilead, Gnubiotics, Roche, Axalbion, Pharmabiome, Topadur, Basilea, MBiomics, Storm Therapeutics, LimmatTech, Zealand Pharma, NodThera, Calypso Biotech, Menarini. Pileje, Herbodee, Vifor. GR has shares and is cofounder and head of the scientific advisory board of PharmaBiome. GR has consulted to Abbvie, Arena, Augurix, BMS, Boehringer, Calypso, Celgene, FALK, Ferring, Fisher, Genentech, Gilead, Janssen, Lilly, MSD, Novartis, Pfizer, Phadia, Roche, UCB, Takeda, Tillots, Vifor, Vital Solutions and Zeller. GR received speaker’s honoraria from Abbvie, Astra Zeneca, BMS, Celgene, FALK, Janssen, MSD, Pfizer, Phadia, Takeda, Tillots, UCB, Vifor and Zeller. GR received educational grants and research grants from Abbvie, Ardeypharm, Augurix, Calypso, FALK, Flamentera, MSD, Novartis, Pfizer, Roche, Takeda, Tillots, UCB and Zeller. MT served as advisor for Topadur and Takeda. MT received speaker’s honoraria from Janssen, Takeda and Intuitive Surgical. RF has served as an Advisor or speaker for Roche, Pierre Fabre Pharma, Servier, Bristol Myers Squibb, Merck Sharp&Dome, Astra Zeneca. LB has served as advisor for Abbvie, Amgen, BMS, Falk, Janssen, Pfizer, Lilly, Takeda, Sanofi, Esocap, Aquilion and received speaker fees from Takeda, Sanofi, Abbvie, Janssen, Lilly, Falk, BMS, Pfizer. The additional authors declare that they have no competing interests relevant to this work.

Figures
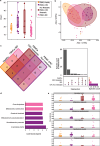
Figure 1.
Figure 1.
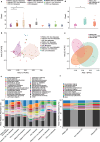
The bacterial profile of PBMCs in patients with CRC, IBD, and healthy controls. Specific samples were removed due to rarefaction, which was conducted to normalize the results. (a) Chao1 alpha diversity index diversity measurements of bacterial taxa were detected inPBMCs from patients with IBD (n=37), CRC non metastatic (n = 19), metastatic CRC (n = 9), as well as in healthy controls (n = 6). Specific samples were removed due to rarefaction normalization. (b) Beta diversity analysis based on Bray-Curtis presented by Principal coordinates analysis (PCoA) showed differences between PBMCs from healthy individuals and PBMCs from patients with CRC and IBD. (c) a Venn diagram and an upset plot show the number of common bacterial species in different diseases. (d) Effect size analysis (LDA score, log10) shows different taxa detected in PBMCs from each group, as in A, with an LDA score of more than 3. (e) Relative abundance (normalized to a total of 1) of the six species with LDA score above 3.
Figure 2.
Figure 2.
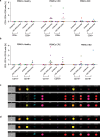
Detection of 16S rRNA-positive cells within total PBMCs from patients with CRC or IBD. PBMCs from healthy controls, n = 9, CRC patients, n = 10 and IBD patients, n = 9 were stained for surface markers CD3, CD4, CD8, CD14 and CD19, and 16S rRNA probe and complementary antisense as a control. These patients had not been previously analyzed by metagenomic sequencing but were included here as an additional validation cohort. (a) Detection of 16S rRNA probe in CD3+CD4+ T cells and CD3+CD8+ T cells in comparison to antisense probe. (b) Detection of 16S rRNA probe in CD3CD14+ monocytes and CD3CD19+ B cells in comparison to antisense probe. Each symbol represents one donor. (c) Representative pictures of PBMCs from CRC donor positive for 16S rRNA probe together with CD3, CD4, CD8 and CD14 cell markers visualized by imaging flow cytometry. (d) Representative pictures of PBMCs from IBD donor positive for 16S rRNA probe together with CD3, CD4, CD8 and CD14 cell markers visualized by imaging flow cytometry. Data is shown as means ± SD, Two-way ANOVA test followed by Bonferroni’s multiple comparison test was performed.
Figure 3a.
Figure 3a.
Bacterial profiles of PBMCs and corresponding tissue samples from the same patients from a cohort of patients with CRC or IBD. Specific samples were removed due to rarefaction, which was conducted to normalize the results. (a) Chao1 diversity index analysis between PBMCs (n = 20 and 8 samples excluded), corresponding adjacent colon tissue and CRC tissue from the same patients (n = 20 and 5 samples excluded), PBMCs from patients with metastatic CRC (n = 4 and one sample excluded), and PBMCs from patients with CRC liver metastasis, corresponding adjacent liver tissue and CRC liver metastatic lesion from matched patients (n = 5 and 3 samples excluded). (b) Beta diversity as assessed by Bray Curtis analysis. (c) Mean relative abundance of most abundant bacterial species pattern across PBMCs and different CRC tissue. (D) Chao1 diversity index analysis between PBMCs (n = 11 and 3 samples excluded), corresponding non-inflamed colon tissue, and inflamed tissue from the same patients (n = 11 and one sample excluded). (e) Beta diversity assessed using the Bray Curtis analysis. (f) Relative abundance of most abundant bacterial species pattern across PBMCs and different colon tissue from patients with IBD. (g) Detection of Anaerostipes hadrus, Bifidobacterium adolescentis, Collinsella aerofaciens and Faecalibacterium prausnitzii with qPCR on whole DNA isolates from PBMCs from CRC patients (n = 7, in at least 4/7 patients, DNA was detectable, except for Bifidobacterium adolescentis), adjacent CRC (n = 13, in least 6/13 patients, DNA was detectable, except for Bifidobacterium adolescentis), tumor tissue from CRC patients (n = 10, in at least 4/10 patients, DNA was detectable, except for Bifidobacterium adolescentis), PBMCs from patients with CRC liver metastasis (n = 4, in at least 1/4 patients, DNA was detectable, except for Bifidobacterium adolescentis), adjacent liver tissue from patients with CRC liver metastasis (n = 4, in at least 1/4 patients, DNA was detectable, except for Anaerostipes hadrus), liver metastasis tissue from patients with CRC liver metastasis (n = 4, in all 4 patients, DNA was n.D.), PBMCs from IBD patients (n = 8, in at least 3/8 patients, DNA was detectable, except for Faecalibacterium prausnitzii), non-inflamed IBD colon tissue (n = 8, in at least 2/8 patients DNA was detectable) and inflamed IBD colon tissue (n = 9, in at least 3/9 patients, DNA was detectable) and PBMCs from healthy controls (n = 4, in all 4 patients, DNA was n.D.). In G PBMCs and tissues samples were not derived from the same patients. Data are presented as log10 transformed predicted bacterial DNA concentrations in ng, based on standard curve values generated from pure bacterial DNA of the respective species (Figure S10). n.D. = not detectable.
Figure 3b.
Figure 3b.
(Continued).
Figure 4.
Figure 4.
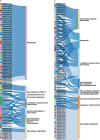
Comparison of bacterial species detected in patients with CRC or IBD in contrast to PBMCs from healthy controls. (a) Histograms show the relative abundance (%) of bacterial species categorized as high tissue abundant ( > 0.02%), low tissue abundant ( < 0.02%), metastatic abundant ( > 0.02%), and most abundant ( > 0.02% in both tissue and PBMC samples), with each bar representing the mean relative abundance for each species across different sample types. (B) correlation heatmap of bacterial species represented in Figure 4(a) between samples from CRC metastatic tissue and PMBCs. Only significant correlations with p-values less than 0.05 and Spearman correlation above 0.5 are represented by a pie diagram, and blank squares are insignificant.
Figure 5a.
Figure 5a.
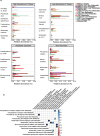
The serum metabolite profile of a cohort of patients with CRC or IBD and in healthy controls. (a) Principal component analysis (PCA) of serum metabolites in patients with CRC (n = 28), IBD (n = 12), and healthy controls (n = 10). Each dot represents one patient. (b) Metabolites set enrichment analysis of 524 common altered metabolites compared to healthy. (c) Pathway analysis of the detected metabolites. (d) Correlation network between metabolites detected in serum samples from patients with CRC non-metastatic and altered pathways from metagenomics functional analysis of PBMC samples from patients with CRC non-metastatic. (e) Correlation network between metabolites detected in serum samples and altered pathways resulted from metagenomics functional analysis of PBMC samples from patients with IBD. Only significant correlations with p-values less than 0.05 and Spearman correlation above 0.5 are represented by dark blue lines and less than − 0.5 by light blue lines.
Figure 5b.
Figure 5b.
(Continued).

References

    1. Hou K, Wu Z X, Chen X Y, Wang J Q, Zhang D, Xiao C, Zhu D, Koya JB, Wei L, Li J, et al. Microbiota in health and diseases. Signal Transduct Targeted Ther. 2022;7(1):135. doi: 10.1038/s41392-022-00974-4. - DOI - PMC - PubMed
    1. Zhang Y, Zhang L, Zheng S, Li M, Xu C, Jia D, Qi Y, Hou T, Wang L, Wang B, et al. Fusobacterium nucleatum promotes colorectal cancer cells adhesion to endothelial cells and facilitates extravasation and metastasis by inducing ALPK1/NF-kappaB/ICAM1 axis. Gut Microbes. 2022;14(1):2038852. doi: 10.1080/19490976.2022.2038852. - DOI - PMC - PubMed
    1. Pleguezuelos-Manzano C, Puschhof J, Rosendahl Huber A, van Hoeck A, Wood HM, Nomburg J, Gurjao C, Manders F, Dalmasso G, Stege PB, et al. Mutational signature in colorectal cancer caused by genotoxic pks(+) E. coli. Nature. 2020;580(7802):269–23. doi: 10.1038/s41586-020-2080-8. - DOI - PMC - PubMed
    1. Galeano Nino JL, Wu H, LaCourse KD, Kempchinsky AG, Baryiames A, Barber B, Futran N, Houlton J, Sather C, Sicinska E, et al. Effect of the intratumoral microbiota on spatial and cellular heterogeneity in cancer. Nature. 2022;611(7937):810–817. doi: 10.1038/s41586-022-05435-0. - DOI - PMC - PubMed
    1. Zheng D, Liwinski T, Elinav E.. Interaction between microbiota and immunity in health and disease. Cell Res. 2020;30(6):492–506. doi: 10.1038/s41422-020-0332-7. - DOI - PMC - PubMed

MeSH terms

LinkOut - more resources