. 2025 Oct;12(38):e08503.
doi: 10.1002/advs.202408503. Epub 2025 Jul 20.

NAD+-Boosters Improve Mitochondria Quality Control In Parkinson's Disease Models Via Mitochondrial UPR

Affiliations

NAD+-Boosters Improve Mitochondria Quality Control In Parkinson's Disease Models Via Mitochondrial UPR

Shuoting Zhou et al. Adv Sci (Weinh). 2025 Oct.

Abstract

Serving as a pivotal hub for cellular metabolism and intracellular signaling, the mitochondrion has emerged as a crucial organelle whose dysfunction is linked to many human diseases, including neurodegenerative disorders, particularly Parkinson's disease (PD). However, whether mitochondrial quality control (MQC) can be targeted for therapeutic interventions remains uncertain. This study uses clinical samples, molecular biology techniques, pharmacological interventions, and genetic approaches to investigate the significance of NAD+ levels in cross-species models of PD. These results reveal that treatment of rotenone-incubated cells with NAD+ boosters (such as NMN, siCD38, and NAT) increases UPRmt/mitophagy-related MQC, reduces pro-inflammatory cytokine expression, inhibits apoptosis, and strengthen redox reactions. In vivo, NMN supplementation inhibits motor deficit and forestalls the neuropathological phenotypes of MPTP-induced PD mice, which are required for the atf4-related mitochondrial UPR pathway. Notably, bulk omics signatures and metabolomic profiling analyses of the striatum reveal NMN-induced transcriptional changes in genes and proteins involved in mitochondrial homeostasis. Thus, these findings demonstrate that the accelerated pathology in PD models is probably mediated by impaired MQC and that bolstering cellular NAD+ levels alleviates mitochondrial proteotoxic stress and mitigate PD phenotypes.

Keywords: NAD+‐boosters; Parkinson's disease; mitochondria quality control; mitochondrial unfolded protein response; nicotinamide mononucleotide.


Conflict of interest statement

The authors declare no conflict of interest.

Figures

Figure 1
Figure 1
NAD+ boosters are beneficial for PD‐related cell models: a) Relative NAD+ and NADH levels in SH‐SY5Y cells (n = 3 independent samples; One‐way ANOVA). b) SH‐SY5Y cells’ survival rate was determined by CCK8 assay (n = 3; n = 6; n = 3; n = 6 independent samples; One‐way ANOVA). c) Western blot data showing changes of expression of TH when SH‐SY5Y cells were in an undifferentiated state (n = 3 independent samples; One‐way ANOVA). β‐actin and GAPDH was used as loading control for TH. d,e) Changes of α‐syn signals in different subgroups (n = 3 independent samples; One‐way ANOVA). For (d,e), scale bars, 15 µm. f) Flow cytometry analysis of mitochondrial membrane potential (ΔΨm) using JC‐1. The boxed percentage represents the proportion of cells with JC‐1 monomers in the total population. g,h) Quantification of changed percentages of green JC‐1 monomers in each group of cells, which is an indicator of low membrane potential. (n = 3 independent samples; One‐way ANOVA). i–k) Changes in intracellular ATP levels in each group (n = 3 independent samples; One‐way ANOVA). l,m) Western blot data showing changes of expression of Citrate synthase (n = 3 independent samples; One‐way ANOVA). n,o) Quantification of changes in Citrate synthase for each group of cells (n = 3 independent samples; One‐way ANOVA). GAPDH was used as loading control for CS. p) Changes of Citrate synthase signals in different subgroups. For (p), scale bars, 15 µm. q) Quantification of changes in Citrate synthase for each group of cells (n = 3 independent samples; One‐way ANOVA). Data are shown as mean ± SEM. The p values are indicated on the graphs. NS, not significant.
Figure 2
Figure 2
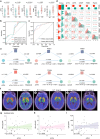
Disturbed plasma UPRmt‐mitophagy pathways in idiopathic PD subjects: a) Plasma levels of UPRmt (ATF4, ATF5, CHOP) and mitophagy (PINK1, Parkin) biomarkers in patients with PD and matched healthy controls (HC) in cohorts a and b, respectively. Cohort a (HC = 76, PD = 78); cohort b (HC = 46, PD = 50). b) Corresponding receiver operating characteristic (ROC) curves for the UPRmt biomarkers ATF4, ATF5, and CHOP. c) Corresponding ROC curves for the PD patients and healthy control's mitophagy (PINK1, Parkin) biomarkers. d) Multi‐group correlation analysis of the UPRmt biomarkers in cohort b with the mitophagy biomarkers. e) Mediation analysis demonstrating the relationship between the UPRmt, the mitophagy, and the AD diagnosis. f) Representative 18F‐FP‐CIT DAT‐PET images of ipsilateral and contralateral sides of the PD and HC participants in different brain regions in Cohort c. Caudate nucleus, CN; Anterior putamen, AP; Posterior putamen, PP; Hoehn‐Yahr: H‐Y. g–i) Associations between of plasma ATF4 levels with 18F‐FP‐CIT DAT‐PET SUVR value in the PP (g), AP (h), and CN (i) regions of PD participants. P values and R coefficients are derived from Spearman correlations. Data are shown as mean ± SEM. The P values are indicated on the graphs. NS, not significant.
Figure 3
Figure 3
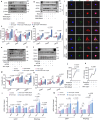
NAD+ boosters reinforce UPRmt/mitophagy‐related mitochondrial quality control in PD cells: a,b) Western blot data showing expression of mitophagy and UPRmt‐related proteins in SH‐SY5Y cells under different doses of NMN. c,d) Quantification of changes in the proteins shown in a, b (n = 3 independent samples; One‐way ANOVA). β‐actin was used as loading control for ATF4, ATF5 and LONP1. GAPDH was used as loading control for PINK1, OPTN and Parkin. e,f) Western blot data showing mitophagy and UPRmt‐related protein expressions in SH‐SY5Y cells under different elevated NAD+ pathways. g,h) Quantification of changes in the proteins shown in e, f (n = 4 independent samples; One‐way ANOVA). β‐actin was used as loading control for ATF4, ATF5 and LONP1. GAPDH was used as loading control for PINK1, OPTN and Parkin. i–k) Expression level of intracellular ATF4 under different treatments. For (i), scale bars, 15 µm (n = 3 independent samples; One‐way ANOVA). l,m) Real‐time PCR showing transcript levels of intracellular UPRmt and mitophagy indicators under different treatments (n = 3 independent samples; One‐way ANOVA). Data are shown as mean ± SEM. The p values are indicated on the graphs. NS, not significant.
Figure 4
Figure 4
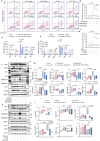
Restoration of NAD+ increases redox reactions and decreases apoptosis: a–c) Apoptosis in different groups of cells by detecting Annexin V/PI in flow cytometry (n = 3 independent samples; One‐way ANOVA). d, e) Real‐time PCR showing transcript levels of intracellular inflammatory and apoptosis indicators under different treatments (n = 3 independent samples; One‐way ANOVA). f–i) Western blot data showing changes of expression of inflammatory‐ and apoptosis‐related proteins under NMN supplemention and si‐CD31 or NAT treatment (n = 3 independent samples; One‐way ANOVA). GAPDH was used as loading control for RIPK1, RIPK3, Bcl‐2, Caspase‐3, BAX, SOD1, SOD2 and Caspase‐9 in (g). β‐actin was used as loading control for SOD1and SOD2 in (i). GAPDH was used as loading control for Bcl‐2, Caspase‐3, BAX, and Caspase‐9 in (i). Data are shown as mean ± SEM. The P values are indicated on the graphs. NS, not significant.
Figure 5
Figure 5
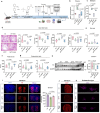
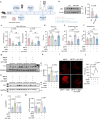
NAD+ booster NMN supplementation inhibits motor deficit and forestalls neuropathology phenotypes in MPTP‐induced mice: a) Flowchart of NMN intraperitoneal injection for treating MPTP‐induced mice model of PD. b) Plasma levels of NAD+ in different groups of mice after NMN treatment (n = 4 independent samples; One‐way ANOVA). c) Striatum levels of NAD+ in different groups of mice after NMN treatment (n = 4 independent samples; One‐way ANOVA). d–g) Bar plots of performance in the behavioral tests, including the open field test, pole test, rotarod test, and Suspension tests. (n = 4 independent samples; One‐way ANOVA). h,i) Levels of TH in the striatum of mice under NMN treatment by Western blot and IFC. For (h), scale bars, 2 mm (n = 4 independent samples; One‐way ANOVA). GAPDH was used as loading control for TH. j,k) Dopamine transporter levels in mice striatum and substantia nigra (n = 4). Data are shown as mean ± SEM. The P values are indicated on the graphs.
Figure 6
Figure 6
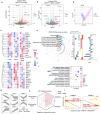
Omics signatures of the striatum with NMN in MPTP‐induced PD mice: a,b) differential genes for the MPTP and Control groups are shown in the volcano plots based on ‐log10 (P value) and log2FC, whereas MPTP+NMN and MPTP groups are displayed in b in the same way. c) Heatmap of differential genes in Control, MPTP, and MPTP+NMN groups. d) PCA analysis of Control, MPTP, and MPTP+NMN groups (n = 3). e) KEGG analysis of differential genes for the MPTP versus control group, and the MPTP + NMN versus MPTP group, and co‐enrichment of the pathways based on ‐log10(P value) and log2FC of related genes within the crucial KEGG pathways are shown in bar graphs. f) GO enrichment analysis of differential genes in the MPTP versus Control group, and MPTP + NMN versus MPTP group, and the core pathways are shown based on up‐ and down‐regulated normalized values and ‐log10(P value). g–i) Mfuzz trend analysis of Control, MPTP, and MPTP + NMN groups, and their expression trends were visualized in g, and all genes in different groups were plotted as scatter plots in i based on their MPTP + NMN/MPTP expression ratios and expression ratios with the control group for trends 2 and 5. h) The GSEA enrichment results of MPTP and MPTP + NMN groups according to mitochondria‐related pathways, and energy metabolism‐related pathways were visualized in radar plots. P values and R coefficients are derived from Spearman correlations. Data are shown as mean ± SEM. The P values are indicated on the graphs.
Figure 7
Figure 7
Mitochondrial quality control signature can be improved by increased NAD+ biosynthesis in mice: a) Immunofluorescence staining of Citrate synthase in the striatum of PD mice. For (c), scale bars, 15 µm (n = 3 independent samples; One‐way ANOVA). b,c) Effects of NMN on the expression level of Citrate synthase (n = 6 independent samples; One‐way ANOVA). d) Changes in intracellular ATP levels in each group (n = 4 independent samples; One‐way ANOVA). e–p) Effects of NMN on the expression levels of different proteins (n = 3 independent samples; One‐way ANOVA). β‐actin was used as loading control for ATF4, ATF5, LONP1, Bcl2, Bax, SOD1, SOD2 and NLRP3. GAPDH was used as loading control for PINK1 and Parkin. Data are shown as mean ± SEM. The P values are indicated on the graphs. NS, not significant.
Figure 8
Figure 8
MPTP‐induced reactive gliosis and synaptic disruption were attenuated by NMN treatment: a) RT‐qPCR analysis revealed that the expression of genes such as Il‐1β, II‐6, Tnf, Nos2, Ccl2, and Ccl2 (n = 3 independent samples; One‐way ANOVA). b–f) Effects of NMN on the expression level of IBA1 and GFAP (n = 3 independent samples; One‐way ANOVA). β‐actin was used as loading control. g,h,j) Effects of NMN on the expression level of synaptophysin and PSD95 (n = 5 independent samples; One‐way ANOVA). β‐actin was used as loading control. i,k) Effects of NMN on the expression level of NeuN (n = 6 independent samples; One‐way ANOVA). Data are shown as mean ± s.e.m. The P values are indicated on the graphs. NS, not significant.
Figure 9
Figure 9
NMN attenuates PD‐related phenotypes through the ATF4 pathway: a) Experimental design to study the effect of Atf4 knockdown in the striatum of NMN‐treated PD mice. b) ATF4 knockdown efficacy test in the striatum (n = 6 independent samples; One‐way ANOVA). β‐actin was used as loading control. c–f) Bar plots of performance in the behavioral tests, including the open field test, pole test, rotarod test and suspension tests (n = 4 independent samples; One‐way ANOVA). g–j) TH levels in the mice striatum. For (i), scale bars, 2 mm (n = 3 independent samples; One‐way ANOVA). GAPDH was used as loading control. k,l) Effects of NMN and Atf4 knockdown on the expression level of CS in the striatum (n = 4 independent samples; One‐way ANOVA). GAPDH was used as loading control. m) Changes in intracellular ATP levels in each group (n = 6 independent samples; One‐way ANOVA). Data are shown as mean ± SEM. The P values are indicated on the graphs. NS, not significant.
Figure 10
Figure 10
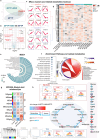
Treatment with NMN remodels metabolic pathways of the striatum in MPTP‐induced PD mice: a) OPLS‐DA analysis of Control, MPTP, and MPTP + NMN groups (n = 3). b) Metabolites for MPTP + NMN and MPTP groups based on ‐log10(P value) and log2FC are presented in the volcano plots. c,d) Mfuzz trend analysis of metabolites obtained from positive and negative ion patterns for different groups is presented in (c), and integration and visualization of critical metabolite subclusters' expression levels are plotted in the heatmap (d). e) MSEA enrichment analysis of differential metabolites in the MPTP + NMN vs MPTP group, and the pathway with the highest enrichment level was selected and visualized based on its p‐value. f) GO pathway enrichment analysis of differential metabolites in the MPTP + NMN vs MPTP group, and metabolites involved in multiple pathways were plotted as chordal plots based on their pathway interactions. g) WCGNA of control, MPTP, and MPTP + NMN groups, where the cluster dendrogram represents the metabolite groups identified by WGCNA. Meanwhile, the heatmap represents the correlation of different metabolite modules with NMN and MPTP. The critical metabolites in the Yellow, Grey, and Green modules are further analyzed in supple Figure 4. h) Combined metabolomics and transcriptomics analysis of Control, MPTP, and MPTP + NMN groups, where dots represent metabolite abundance, lines represent transcriptional expression of the enzymes, and the color differences indicate the degree of their high expression level in the MPTP or NMN groups. Then, peak plots indicate the respective degree of expression of all detected metabolites.

References

    1. Bloem B. R., Okun M. S., Klein C., Lancet 2021, 397, 2284. - PubMed
    1. Lawrence G., Holley C. L., Schroder K., Trends Immunol. 2022, 43, 877. - PubMed
    1. Schapira A. H., Cooper J. M., Dexter D., Jenner P., Clark J. B., Marsden C. D., Lancet 1989, 1, 1269. - PubMed
    1. Moehlman A. T., Youle R. J., Annu. Rev. Cell Dev. Biol. 2020, 36, 265. - PubMed
    1. Schapira A. H., Lancet Neurol. 2008, 7, 97. - PubMed

LinkOut - more resources