. 2025 Oct;12(39):e01694.
doi: 10.1002/advs.202501694. Epub 2025 Jul 21.

Extracellular LCN2 Binding to 24p3R in Astrocytes Impedes α-Synuclein Endocytosis in Parkinson's Disease

Affiliations

Extracellular LCN2 Binding to 24p3R in Astrocytes Impedes α-Synuclein Endocytosis in Parkinson's Disease

Ying-Ying Jiao et al. Adv Sci (Weinh). 2025 Oct.

Abstract

The spread or transmission of pathologic α-synuclein (α-Syn) is emerging as potentially important driver of Parkinson's disease (PD) pathogenesis. Emerging evidence suggests that astrocytes play an important role in uptake/clearance of extracellular α-Syn. However, underlying mechanisms and molecular entities responsible for uptake/clearance of extracellular α-Syn by astrocytes are not known. Here, it is shown that lipocalin-2 (LCN2) is upregulated in astrocytes of MPTP-treated mice by RNA-Seq analysis and positively correlates with pathologic α-Syn level in α-Syn PFF model. Strikingly, deletion of astrocytic LCN2 significantly prevents the pathologic α-Syn accumulation and neurodegeneration. Moreover, 24p3R as a crucial receptor of α-Syn uptake by astrocytes is identified, as well as an important mediator of α-Syn spread in the brain. 24p3R specifically binds to α-Syn and then mediates α-Syn uptake. LCN2 prevents astrocytic uptake of α-Syn by impeding the binding of 24p3R and α-Syn. The identification of LCN2/24p3R as a key regulator of α-Syn by astrocytes provides a new target for the treatment of PD and related α-synucleinopathies.

Keywords: 24p3R; Parkinson's disease; astrocytes; lipocalin‐2; α‐synuclein.


Conflict of interest statement

The authors declare no conflict of interest.

Figures

Figure 1
Figure 1
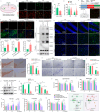
LCN2 is increased in astrocytes of MPTP model and α‐Syn PFF model. A) Volcano plot of downregulated (down) or upregulated (up) genes in the SNpc of MPTP‐treated mice compared to control mice by RNA‐seq analysis (n = 3 animals for each group). B) Heatmap of top 10 upregulated and 10 downregulated genes as indicated by RNA‐seq analysis. C) qPCR analysis measuring the mRNA levels of top 20 genes as indicated in the SNpc of MPTP‐treated mice (n = 6 animals for each group). D‐E) Representative immunoblots of relative expression of LCN2 in the SNpc of MPTP‐treated mice (D, n = 6 animals for each group) and α‐Syn PFF‐treated mice (E, n = 6 animals for each group). F) The LCN2 level is negatively correlated with the latency time on the rotarod test in α‐Syn PFF‐treated mice. G) The LCN2 expression is positively correlated with pathologic p‐α‐Syn level in the SNpc of α‐Syn PFF‐treated mice. H) LCN2 immunohistochemical signal in astrocytes and microglia from the SNpc of α‐Syn PFF‐treated mice after tyramide signal amplification. I) Quantification of the LCN2 level in TH /GFAP /Iba1 positive cells in α‐Syn PFF‐treated mice (n = 4–7 animals for each group). J‐K) Representative immunoblots of relative expression of LCN2 in astrocytes treated with MPP+ (J, six independent experiments) or α‐Syn PFF (K, four independent experiments) for 48 h. The data shown are the mean ± SEM. Unpaired t test was used (C–E, I–K) and correlation was analyzed by Pearson's correlation coefficient (F‐G). *p < 0.05, **p < 0.01, ***p < 0.001.
Figure 2
Figure 2
Astrocytic LCN2 overexpression aggravates PD‐like pathology and α‐Syn accumulation in mice. A) Diagram of the experimental design. IHC results confirm that AAV‐Lcn2 (mCherry) is expressed, mainly in GFAP+ astrocytes (green). B) The time taken to descend a pole (Time‐total) was recorded in pole test in MPTP model (n = 14 animals for each group). C) Time on the rod was measured by the rotarod test in MPTP model (n = 12 animals for each group). D) Movement distance within 5 min was recorded in open field test in MPTP model (n = 9 animals for each group). E,F) Microphotographs and stereological counts of TH‐positive neurons in the SNpc in MPTP model (n = 6 animals for each group). G,H) Representative immunoblots and quantification of relative expression of TH in the SNpc in MPTP model (n = 6 animals for each group). I) Immunohistochemical staining and quantification of Nissl‐positive cells in the SNpc in MPTP model. J) Microphotographs and quantification of GFAP‐positive astrocytes and Iba1‐positive microglia in the SNpc in MPTP model (n = 6 animals for each group). K) Movement distance within 5 min was recorded in AAV‐control or AAV‐LCN2‐injected mice in α‐Syn PFF model (n = 16 animals for each group). L) The time taken to descend a pole (Time‐total) was recorded in pole test in α‐Syn PFF model (n = 16 animals for each group). M) Time on the rod was measured by the rotarod test in α‐Syn PFF model (n = 16 animals for each group). N) Immunohistochemical staining and quantification of TH‐positive cells in the SNpc in α‐Syn PFF model (n = 5 animals for each group). O) Immunohistochemical staining and quantification of Nissl‐positive cells in the SNpc in α‐Syn PFF model (n = 5 animals for each group). P–R) Representative immunoblots (P) and quantification of relative expression of TH (Q) and LCN2 (R) in the SNpc in α‐Syn PFF model (n = 5 animals for each group). S–U) Representative immunoblots and quantification of relative expression of TX‐insoluble and TX‐soluble α‐Syn and p‐α‐Syn in the SNpc in α‐Syn PFF model (n = 4‐5 animals for each group). V) Representative double immunostaining for p‐Syn (red) and TH (green) in the SNpc in α‐Syn PFF model (n = 5 animals for each group). The data shown are the mean ± SEM. Two‐way ANOVA with Tukey's post‐hoc test was used (B–D, F, H–J) and Unpaired t test was used (K‐O, Q‐R, T‐V). *p < 0.05, **p < 0.01, ***p < 0.001.
Figure 3
Figure 3
Astrocytic LCN2 ablation alleviates α‐Syn pathology. A) Diagram of the experimental design. IHC results confirm that AAV‐LCN2 shRNA (EGFP) is expressed, mainly in GFAP+ astrocytes (red) in α‐Syn PFF model. B,C) Movement distance within 5 min was recorded in open field test (n = 11‐13 animals for each group). D) Time on the rod was measured by the rotarod test (n = 11‐12 animals for each group). E‐F) the time taken to turn around (Time‐turn) and descend a pole (Time‐total) was recorded in pole test (n = 10‐12 animals for each group). G‐H) Microphotographs and stereological counts of TH‐positive neurons in the SNpc (n = 6‐7 animals for each group). I,J) Representative immunoblots and quantification of relative expression of TH in the SNpc (n = 6 animals for each group). K,L) Immunohistochemical staining and quantification of Nissl‐positive cells in the SNpc. M) Microphotographs of GFAP‐positive astrocytes and Iba1‐positive microglia in the SNpc. N,O) Stereological counts of GFAP‐positive astrocytes (N) and Iba1‐positive microglia (O) in the SNpc (n = 6 animals for each group). P) Representative double immunostaining for p‐Syn (red) and TH (green) in the SNpc. Q) Quantification of p‐Syn fluorescence intensity in P (n = 4‐5 animals for each group). DAPI stains nucleus (blue). R–T) Representative immunoblots and quantification of relative expression of TX‐insoluble and TX‐soluble α‐Syn and p‐α‐Syn in the SNpc (n = 5‐6 animals for each group). The data shown are the mean ± SEM. Two‐way ANOVA with Tukey's post‐hoc test was used (C‐F, H, J, L, N‐O) and Unpaired t test was used (Q‐S). *p < 0.05, **p < 0.01, ***p < 0.001.
Figure 4
Figure 4
LCN2 limits α‐Syn PFF uptake by astrocytes in an autocrine manner. A) Top 10 GO enrichment analysis of biological processes for LCN2 by MS. B) Astrocytes were transfected with empty vector (Vector) or LCN2 plasmids for 48 h and were then stimulated with α‐Syn PFF (PFF, 1 µg mL−1) for 0.5, 2 or 12 h. Western blot analysis of α‐Syn in the supernatants and in the lysates (cytoplasm) of astrocytes. C) Quantification of relative level of α‐Syn in the lysates of astrocytes in B (Three independent experiments). D) Astrocytes were transfected with empty vector (Vector) or LCN2 plasmids for 48 h and then stimulated with Atto 488‐labeled α‐Syn PFF (1 µg mL−1) for 2 h. Representative image analysis of the endocytosis of α‐Syn‐488 PFF by astrocytes. E‐F) α‐Syn 488 PFF uptake in vector or LCN2‐expressed astrocytes was measured by flow cytometry (1 µg mL−1, 2 h of treatment, three or four independent experiments). G) Astrocytes were pretreated recombinant LCN2 protein (Re‐LCN2, 1, 10, 100, 1000 ng mL−1) for 30 min and were then stimulated with α‐Syn PFF (1 µg mL−1) for 2 h. Western blot analysis of α‐Syn in the supernatants and in the lysates (cytoplasm) of astrocytes. H) Quantification of relative level of α‐Syn in the lysates of astrocytes in G (Three independent experiments). I,J) α‐Syn 488 PFF uptake in mock or recombinant LCN2 protein (Re‐LCN2, 100 ng mL−1)‐pretreated astrocytes measured by flow cytometry (1 µg mL−1, 2 h of treatment, three independent experiments). The data shown are the mean ± SEM. Two‐way ANOVA with Tukey's post‐hoc test was used (C, F) and One‐way ANOVA with Tukey's post‐hoc test was used (H, J). *p < 0.05, **p < 0.01, ***p < 0.001.
Figure 5
Figure 5
LCN2 receptor (24p3R) is an astrocytic receptor for α‐syn PFF uptake. A) Astrocytes were transfected with control siRNA (si‐control) or 24p3R siRNA (si‐24p3R) for 48 h and then treated with α‐Syn PFF (PFF, 1 µg mL−1) for 2 h. Western blot analysis of α‐Syn in the supernatants and in the lysates (cytoplasm) of astrocytes. B) Quantification of relative level of α‐Syn in the lysates of astrocytes in A (Five independent experiments). C,D) Astrocytes were transfected with control siRNA (si‐control) or 24p3R siRNA (si‐24p3R) for 48 h and were then stimulated with Atto 488‐labeled α‐Syn PFF (1 µg mL−1) for 2 h. α‐Syn 488 PFF uptake was measured by flow cytometry (1 µg mL−1, 2 h of treatment, three or four independent experiments). E,F) Representative image analysis of the endocytosis of α‐Syn‐488 PFF in control siRNA (si‐control) or 24p3R siRNA (si‐24p3R) transfected astrocytes (Five independent experiments). G) Astrocytes were transfected with empty vector (Vector) or 24p3R plasmids for 48 h and were then stimulated with α‐Syn PFF (1 µg mL−1) for 2 h. Western blot analysis of α‐Syn in the supernatants and in the lysates (cytoplasm) of astrocytes. H) Quantification of relative level of α‐Syn in the lysates of astrocytes in G (Three independent experiments). I,J) α‐Syn 488 PFF uptake in vector or 24p3R‐expressed astrocytes was measured by flow cytometry (1 µg mL−1, 2 h of treatment, three independent experiments). K,L) 24p3R siRNA‐transfected astrocytes were pretreated with MG‐132 (5 µM) or 3‐MA (10 mM) for 30 min and then treated with α‐Syn PFF (1 µg mL−1). Western blot analysis of α‐Syn in the lysates of astrocytes (Three independent experiments). M) Astrocytes were transfected with 24p3R plasmids or 24p3R siRNA (si‐24p3R) for 48 h and were then stimulated with Atto 488‐labeled α‐Syn PFF (1 µg mL−1) for 2 h. Internalized α‐syn‐488 PFF (green), 24p3R (red) co‐localized with EAA1 (blue) was assessed by confocal microscopy. N,O) Quantification of co‐localized α‐Syn 488 PFF with EAA1 in M (Three independent experiments). P,Q) 24p3R‐overexpressed astrocytes were pretreated with Dynasore (Dyn, 80 µM) for 30 min and then treated with Atto 488‐labeled α‐Syn PFF (1 µg mL−1) for 2 h. α‐Syn 488 PFF uptake in astrocytes was measured by flow cytometry (three independent experiments). R,S) Image and quantification of internalized α‐syn‐488 PFF (green), 24p3R (red) co‐localized with EAA1 (blue) in 24p3R‐overexpressed astrocytes treated with Dynasore (Dyn, 80 µM). The data shown are the mean ± SEM. Two‐way ANOVA with Tukey's post‐hoc test was used (B‐C, H‐I, L, Q‐R) and Unpaired t test was used (F, N‐O). **p < 0.01, ***p < 0.001, NS: no significant.
Figure 6
Figure 6
24p3R specifically binds to α‐Syn PFF in astrocytes. A) Astrocytes were transfected with empty vector (Vector) or LCN2 plasmids for 48 h and were then stimulated with α‐Syn PFF (PFF, 1 µg mL−1) for 2 h. Immunoprecipitation and immunoblot analysis of the interaction of 24p3R with α‐Syn in astrocytes. B) Quantification of 24p3R‐α‐Syn interaction in vector or LCN2 plasmids transfected astrocytes (Three independent experiments). C,D) Immunoprecipitation and immunoblot analysis of the interaction of 24p3R with α‐Syn in control siRNA (si‐control) or 24p3R siRNA (si‐24p3R) transfected astrocytes (Three independent experiments). E) 24p3R and α‐Syn proximity ligation signals in vector or LCN2 plasmids transfected astrocytes. F) SPR assay to evaluate the affinity between α‐Syn and purified mouse 24p3R protein. G) SPR assay to evaluate the affinity between α‐Syn and purified mouse 24p3R protein in absence or presence of LCN2. H) Astrocytes were treated with α‐Syn PFF (PFF, 1 µg mL−1) or amyloid‐beta (Aβ1‐42 fibrils, 1 µg mL−1) for 2 h. Immunoprecipitation and immunoblot analysis of the interaction of 24p3R with α‐Syn or Aβ in astrocytes. I) Schematic diagram of mouse 24p3R domains and deletions mutants. J) HEK293T cells were transfected with empty vector (EV) or expression plasmids directing the expression of each of the indicated 24p3R deletion mutants. Transfected cells were assessed for binding of α‐Syn. K) 24p3R deficient astrocytes were transfected with 24p3R plasmids or 24p3R D4 deletion mutant (D4‐DM) for 48 h and then treated with α‐Syn PFF (1 µg mL−1) for 2 h. Western blot analysis of α‐Syn in the supernatants and in the lysates (cytoplasm) of astrocytes. L) Quantification of relative level of α‐Syn in the lysates of astrocytes in K (Four independent experiments). M,N) α‐Syn 488 PFF uptake in 24p3R deficient astrocytes transfected with 24p3R plasmids or 24p3R D4 deletion mutants (D4‐DM) was measured by flow cytometry (1 µg mL−1, 2 h of treatment, three independent experiments). The data shown are the mean ± SEM. Unpaired t test was used (B, D) and two‐way ANOVA with Tukey's post‐hoc test was used (L, N). *p < 0.05, **p < 0.01.
Figure 7
Figure 7
Astrocytic 24p3R deletion promotes α‐Syn spread and toxicity in α‐Syn PFF model. A) Schematic representation of the chambers in which neurons were co‐cultured with vector or 24p3R‐overexpressed astrocytes. α‐Syn PFF (1 µg mL−1) was added to chambers for 10 days. B) Representative double‐immunostaining for p‐α‐Syn (green) and MAP2 (red) when neurons were co‐cultured with vector or 24p3R‐overexpressed astrocytes after α‐Syn PFF (1 µg mL−1) treatment for10 days. C,D) Quantification of p‐α‐Syn in neuron and mean total neurites length in B (Six independent experiments). E) Diagram of the experimental design. IHC results confirm that AAV‐24p3R shRNA (EGFP) is expressed, mainly in GFAP+ astrocytes (red) in α‐Syn PFF model. F) Representative double immunostaining for p‐Syn (red) and TH (green) in the SNpc. G) Quantification of p‐Syn fluorescence intensity in F (n = 6 animals for each group). DAPI stains nucleus (blue). H–J) Representative immunoblots and quantification of relative expression of TX‐insoluble and TX‐soluble α‐Syn and p‐α‐Syn in the SNpc (n = 5‐6 animals for each group). K) Representative images showing α‐Syn signals in the hippocampus, prefrontal cortex and striatum region from AAV‐control and AAV‐24p3R shRNA mice. L,M) Microphotographs and stereological counts of TH‐positive neurons in the SNpc (n = 6 animals for each group). N,O) Immunohistochemical staining and quantification of Nissl‐positive cells in the SNpc (n = 5 animals for each group). P‐R) Representative immunoblots (P) and quantification of relative expression of TH (Q) and LCN2 (R) in the SNpc (n = 3 animals for each group). S) Movement distance within 5 min was recorded in open field test (n = 8 animals for each group). T) Time on the rod was measured by the rotarod test (n = 8‐10 animals for each group). U) The time taken to descend a pole (Time‐total) was recorded in pole test (n = 8 animals for each group). V,W) The percentage of time spent in the novel arm and the number of entries into novel arm were recorded in Y maze test (n = 8‐10 animals for each group). X) Proposed model for how LCN2 impedes the α‐Syn uptake by astrocytes in PD. The data shown are the mean ± SEM. Unpaired t test was used (C, G‐I) and two‐way ANOVA with Tukey's post‐hoc test was used (D, M, O, Q‐W). *p < 0.05, **p < 0.01, ***p < 0.001.

References

    1. Jiang S. Y., Tian T., Yao H., Xia X. M., Wang C., Cao L., Hu G., Du R. H., Lu M., Cell Death Differ. 2023, 30, 2280. - PMC - PubMed
    1. a) Mao X., Ou M. T., Karuppagounder S. S., Kam T. I., Yin X., Xiong Y., Ge P., Umanah G. E., Brahmachari S., Shin J. H., Kang H. C., Zhang J., Xu J., Chen R., Park H., Andrabi S. A., Kang S. U., Goncalves R. A., Liang Y., Zhang S., Qi C., Lam S., Keiler J. A., Tyson J., Kim D., Panicker N., Yun S. P., Workman C. J., Vignali D. A., Dawson V. L., et al., Science 2016, 353, aah3374; - PMC - PubMed
    2. b) Chavarria C., Ivagnes R., Souza J. M., Biomolecules 2022, 12, 655. - PMC - PubMed
    1. a) Chen K., Martens Y. A., Meneses A., Ryu D. H., Lu W., Raulin A. C., Li F., Zhao J., Chen Y., Jin Y., Linares C., Goodwin M., Li Y., Liu C. C., Kanekiyo T., Holtzman D. M., Golde T. E., Bu G., Zhao N., Mol. Neurodegener. 2022, 17, 57; - PMC - PubMed
    2. b) Neupane S., De Cecco E., Aguzzi A., J. Mol. Biol. 2023, 435, 167930. - PubMed
    1. a) Dutta D., Jana M., Majumder M., Mondal S., Roy A., Pahan K., Nat. Commun. 2021, 12, 5382; - PMC - PubMed
    2. b) Filippini A., Mutti V., Faustini G., Longhena F., Ramazzina I., Rizzi F., Kaganovich A., Roosen D. A., Landeck N., Duffy M., Tessari I., Bono F., Fiorentini C., Greggio E., Bubacco L., Bellucci A., Missale M., Cookson M. R., Gennarelli M., Russo I., Glia 2021, 69, 681. - PMC - PubMed
    1. a) Yuan J., Liu H., Zhang H., Wang T., Zheng Q., Li Z., Adv. Mater. 2022, 34, 2108435; - PubMed
    2. b) Scheiblich H., Dansokho C., Mercan D., Schmidt S. V., Bousset L., Wischhof L., Eikens F., Odainic A., Spitzer J., Griep A., Schwartz S., Bano D., Latz E., Melki R., Heneka M. T., Cell 2021, 184, 5089. - PMC - PubMed

LinkOut - more resources