. 2025 Oct;12(38):e04028.
doi: 10.1002/advs.202504028. Epub 2025 Jul 21.

Sleep Deprivation Activates a Conserved Lactate-H3K18la-RORα Axis Driving Neutrophilic Inflammation Across Species

Affiliations

Sleep Deprivation Activates a Conserved Lactate-H3K18la-RORα Axis Driving Neutrophilic Inflammation Across Species

Ren Zhou et al. Adv Sci (Weinh). 2025 Oct.

Erratum in

Abstract

Sleep deprivation critically disrupts physiological homeostasis, impairing development, metabolic balance, and immune regulation, with excessive neutrophil activation being a hallmark consequence. However, the molecular mechanisms underlying sleep deprivation-induced neutrophilic inflammation remain elusive. Here, it is shown that acute sleep deprivation in mice triggers neutrophil hyperactivation, resulting in aberrant peripheral accumulation and a systemic cytokine storm. Mechanistically, this pathology is driven by metabolic dysregulation, specifically, increased glycolytic flux, which elevates tissue lactate levels and enhances histone H3K18 lactylation. Through H3K18 lactylation-specific CUT&Tag profiling, pronounced lactylation enrichment is identified at the promoter of the Rorα gene, directly activating its transcription. Genetic ablation of Rorα or pharmacological inhibition of glycolysis attenuate neutrophil recruitment and mitigated inflammation in sleep-deprived zebrafish. Strikingly, this metabolic‒epigenetic axis is evolutionarily conserved, as demonstrated by the recapitulation of key findings in diurnal zebrafish and pigs. The study reveals a lactate-H3K18 lactylation-Rorα signaling cascade that links sleep deprivation to immune dysregulation, suggesting actionable targets for combating sleep-related inflammatory disorders.

Keywords: Rorα; inflammation; lactylation; neutrophil; sleep deprivation.


Conflict of interest statement

The authors declare no conflict of interest.

Figures
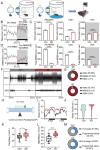
Figure 1
Figure 1
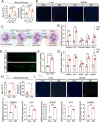
Sleep deprivation models in mice and zebrafish. A) Schematic diagram of the sleep deprivation paradigm in mice. The mice were either maintained under normal conditions or subjected to 24‐h sleep deprivation via the CPW method. B) Distribution of wake time across a 24‐h period in control and sleep‐deprived mice (n = 3). The data represent the time spent in the wake state throughout the light/dark cycle. C) Total wake time in 24 h, separated by light and dark phases, showing the impact of sleep deprivation on wakefulness in mice. D) Distribution of NREM sleep time across a 24‐h period for Con and SD mice, illustrating changes in sleep patterns due to SD. E) Total NREM sleep duration in the 24‐h, light, and dark phases, demonstrating a reduction in NREM sleep following sleep deprivation. F) Representative EEG and EMG traces of both Con and SD mice. The traces illustrate the typical patterns of brain and muscle activity during sleep. G) Percentages of time spent in the awake, NREM, and REM states in Con and SD mice over a 24‐h period. The data reveal the shift in sleep architecture due to SD. H) Schematic diagram of the CSP used to induce sleep deprivation in zebrafish. Zebrafish were subjected to continuous swimming conditions to simulate sleep disruption. I) Sleep distribution over 24 h following sleep deprivation in zebrafish (n = 24). The plot shows a distinct alteration in sleep patterns compared with those of the control group, indicating the effects of prior 24‐h SD exposure. J) Violin plot comparing sleep duration within a 30‐min interval between Con and SD zebrafish, highlighting the reduction in sleep efficiency after SD. K) Total day sleep duration in Con and SD zebrafish, showing the effect of SD on daytime sleep in zebrafish. L) Total night sleep duration in Con and SD zebrafish. M) The percentage of full sleep and fragmented sleep episodes in Con and SD zebrafish, emphasizing the increase in fragmented sleep in SD zebrafish. Statistical significance was analyzed at each time point via t tests, with significance levels denoted as follows: ns, p > 0.05; *, p < 0.05; **, p < 0.01; ***, p < 0.001; ****, p < 0.0001.
Figure 2
Figure 2
Single‐cell RNA sequencing analysis of immune cells following sleep deprivation. A) t‐SNE plot displaying the clustering of immune cells identified in the dataset, with clusters colored by cell type. Each cluster represents a different immune cell population, and the plot shows how the cells are grouped on the basis of their gene expression profiles. B) Dot plot showing cluster‐specific marker genes for the identified cell types, with each dot representing a marker gene. The color scale indicates the average expression level of the gene, while the size of the dot corresponds to the percentage of cells expressing each marker gene. C–H) Feature plots depicting the expression of specific marker genes for various immune cell types: C) Cd3d (T cells), D) Cd79a (B cells), E) Csf3r (neutrophils), F) Cd68 (monocytes/macrophages, MPS), G) Hbb‐bt (erythroid cells), and H) S100a9 (neutrophils). Each feature plot shows the expression intensity of the respective marker gene across the t‐SNE plot, with colors representing the level of expression. I) t‐SNE plots comparing the distributions of different immune cell types in control (Con) and sleep‐deprived (SD) conditions, with data collected at 24 and 48 h post‐SD. J) Bar plot quantifying the proportions of major immune cell populations (B cells, neutrophils, T/NK cells, MPS, and erythroid cells) under both control and SD conditions. Statistical analysis revealed significant differences in the cell populations between the groups. K) Annotated t‐SNE plot highlighting the major cell types (neutrophils, monocytes/macrophages, B cells, T/NK cells, and erythroid cells) for better visualization and understanding of the cell type composition in the dataset. L) Volcano plot showing differentially expressed genes (DEGs) between the SD and control conditions. Genes whose expression was significantly upregulated are shown in red, those whose expression was downregulated are shown in blue, and genes whose expression was not significantly upregulated are shown in gray. The plot provides an overview of the transcriptional changes in immune cells following sleep deprivation.
Figure 3
Figure 3
Sleep deprivation increases the number of neutrophils in mice, zebrafish, and pigs. A) Quantification of neutrophil counts and percentages in the peripheral blood of control and sleep‐deprived mice at 24 and 48 h postSD (n = 6/group). B) Immunofluorescence analysis showing the distribution of neutrophils (Ly6g+ and MPO+ cells) in the liver and spleen tissues of Con and SD mice at 48 h. Scale bar = 20 µm. Increased neutrophil infiltration was observed in the SD group (n = 3/group). C) Schematic representation of neutrophil maturation and differentiation from BW to peripheral circulation, highlighting key transcription factors such as the C/EBP family and PU.1. D) mRNA expression levels of neutrophil‐associated transcription factors (Cebpa, Pu.1, Cebpe, Cebpb, and Gfi1) in neutrophils isolated from the peripheral blood of Con and SD 48 h‐old mice (n = 3/group). E) Zebrafish larvae at 4 days postfertilization (dpf) were subjected to sleep deprivation for 24 h. The total number of fluorescently labeled neutrophils in the larvae was assessed under control and SD conditions. Representative fluorescence images show the neutrophil distribution in the larvae. Images were acquired via a fluorescence microscope, and the fluorescence intensity was quantified via ImageJ software (n = 6/group). Scale bar: 100 µm. F) Quantification of the fluorescence intensity for neutrophil recruitment in zebrafish, which revealed significantly greater recruitment under SD conditions. G) mRNA expression levels of neutrophil‐related genes in 5 dpf zebrafish larvae under Con and SD conditions. (n = 3/group) H) Quantification of neutrophil counts and percentages in the peripheral blood of pigs under Con and SD conditions for 96 h (n = 6/group). SD significantly increased neutrophil counts. I) Immunofluorescence analysis of neutrophil distribution (Ly6g+ and MPO+ cells) in liver and spleen tissues of Con and SD 96 h pigs (n = 3/group). Increased neutrophil presence was observed in both liver and spleen tissues under SD conditions. Scale bar = 20 µm. J) mRNA expression levels of neutrophil‐associated transcription factors (CEBPA, PU.1, CEBPE, CEBPB, and GFI1) in neutrophils isolated from the peripheral blood of Con and SD 96 h pigs (n = 3/group). Statistical significance was analyzed with unpaired t tests, with significance levels denoted as follows: ns, p > 0.05; *, p < 0.05; **, p < 0.01; ***, p < 0.001; ****, p < 0.0001.
Figure 4
Figure 4
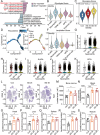
Sleep deprivation induces glycolysis and lactylation in neutrophils. A) KEGG pathway enrichment analysis showing the upregulated and downregulated pathways under SD conditions. The upregulated pathways, including glycolysis/gluconeogenesis and IL‐17 signaling, are highlighted in red, whereas the downregulated pathways are highlighted in blue. B) Glycolysis scores for various immune cell populations, showing the highest glycolysis activity in neutrophils under SD conditions. The data were analyzed via the Kruskal–Wallis test. C) Glycolysis scores specifically for neutrophils under control (Con), SD 24 h, and SD 48 h conditions, with significant differences observed between the groups. Statistical significance was determined via the Kruskal–Wallis test. D,E) Pseudotime analysis illustrating changes in neutrophil transcription over time under SD conditions. Panel D shows the trajectory of neutrophil differentiation, while Panel E compares the transcriptional profiles between the Con, SD 24 h, and SD 48 h groups. The numbers “1” and “2” represent distinct branch points or cell state transitions identified within this inferred trajectory. Branch Points 1 (pseudotime ≈8) and 2 (pseudotime ≈12–16) demarcate key lineage‐splitting events. Early divergence (Branch 1) correlates with treatment conditions (Con/SD 24), whereas late specialization (Branch 2) aligns with prolonged exposure (SD 48). F) Lactylation scores across different immune cell populations, highlighting that neutrophils have the highest level of lactylation. The data were analyzed via the Kruskal‒Wallis test. G–K) Expression levels of glycolysis‐ and lactylation‐associated genes in neutrophils: G) Fabp5, H) Tkt, I) Arid3a, J) Ldha, and K) Hif1a, showing significant upregulation of these genes in neutrophils following SD at both 24 and 48 h. L) t‐SNE plots showing Ldha expression in neutrophils from the Con, SD 24 h, and SD 48 h groups, indicating a shift in Ldha expression with increasing SD. M,N) Lactate levels in neutrophils from BW (M) and blood (N) under Con, SD 24 h, and SD 48 h conditions, showing significant increases in lactate levels in the SD groups. Statistical significance was determined via one‐way ANOVA with Tukey's post hoc test (n = 6/group). O‐S) Lactate levels in various tissues (heart, liver, spleen, lung, and muscle) in the Con, SD 24 h, and SD 48 h groups. Significant increases in lactate levels were observed in liver, spleen, and lung tissues following SD, as analyzed by one‐way ANOVA with Tukey's post hoc test (n = 6/group).
Figure 5
Figure 5
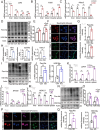
Sleep deprivation (SD) increases lactylation levels in mouse tissues, zebrafish larvae, and pig tissues. A‐C) mRNA expression of Ldha, P300, and Hdac3 in various mouse tissues (liver, blood, muscle, and spleen) under control and sleep‐deprived conditions. (n = 3/group). D) Western blot analysis of total lactylation (Pan‐Kla) and histone H3K18 lactylation (H3K18la) in mouse blood neutrophils under Con and SD conditions (n = 3/group). Representative bands are shown, with quantification provided in panel E. E) Quantification of Pan‐Kla and H3K18la protein expression levels in mouse blood neutrophils. F) Immunofluorescence images showing Pan‐Kla and H3K18la expression in mouse neutrophils. Scale bar = 20 µm. G) Relative fluorescence intensity of Pan‐Kla and H3K18la in mouse neutrophils, as measured by fluorescence microscopy. H) mRNA expression levels of lactylation‐related genes in zebrafish larvae under Con and SD conditions for 24 h, revealing the upregulation of genes associated with lactylation. I) Western blot analysis of Pan‐Kla and H3K18la in zebrafish, which revealed increased lactylation in response to SDs. J) Quantification of Pan‐Kla and H3K18la protein expression levels in zebrafish larvae. K‒M) mRNA expression of LDHA, EP300, and HDAC3 in pig tissues (liver, blood, muscle, and spleen) under Con and SD conditions (n = 3 per group). N) Western blot analysis of Pan‐Kla and H3K18la in pig blood neutrophils (n = 3 per group), which revealed increased lactylation in neutrophils following SD. O) Quantification of Pan‐Kla and H3K18la protein levels in pig neutrophils, with significant differences between the Con and SD groups. P) Immunofluorescence images showing Pan‐Kla and H3K18la expression in pig neutrophils. Scale bar = 20 µm. Q) Relative fluorescence intensity of Pan‐Kla and H3K18la in pig neutrophils (n = 6/group), showing a significant increase in fluorescence intensity under SD conditions. Statistical significance was analyzed with unpaired t tests, with significance levels denoted as follows: ns, p > 0.05; *, p < 0.05; **, p < 0.01; ***, p < 0.001; ****, p < 0.0001.
Figure 6
Figure 6
Lactate enhances neutrophil lactylation and gene expression levels in vivo. A) Schematic diagram illustrating the experimental procedure in which lactate (50.5 mg kg−1 body weight) was administered in PBS, followed by tissue sampling (liver, blood, and spleen) four h postinjection. B) Measurement of lactate levels in neutrophils isolated from the blood of mice treated with lactate (Lac) or PBS (Con). (n = 6/group). C) Western blot analysis of total lactylation (Pan‐Kla) and histone H3K18 lactylation (H3K18la) protein levels in blood neutrophils isolated from mice treated with either PBS (Con) or lactate (Lac). D) Quantification of Pan‐Kla and H3K18la protein expression levels in blood neutrophils. E) Immunofluorescence images showing Pan‐Kla and H3K18la expression in mouse neutrophils. Scale bar = 20 µm. F) Quantification of the relative fluorescence intensity of Pan‐Kla and H3K18la in neutrophils from the Con and Lac groups (n = 6/group). G) Neutrophil counts and percentages in blood following lactate treatment (n = 6/group). H, I) Representative immunofluorescence images of neutrophils (Ly6G+ and Mpo+) in the liver (H), scale bar = 50 µm, and spleen (I) tissue sections from Con and Lac mice (n = 3 per group), scale bar = 20 µm. J) Gene expression levels of neutrophil‐associated transcription factors (Cebpa, PU.1, Cebpe, Cebpb, Gfi1, and Rora) in blood neutrophils. K) Gene expression levels of proinflammatory cytokines (Il‐1, Il‐6, Il‐8, and Tnf‐α) in blood neutrophils. L) Western blot analysis of Pan‐Kla and H3K18la in zebrafish larvae under control (Con) and lactate (Lac) conditions (n = 3/group), revealing increased lactylation in zebrafish larvae following lactate treatment. M) Quantification of protein expression levels (Pan‐Kla and H3K18la) in zebrafish larvae. N) Zebrafish larvae at 5 days postfertilization (dpf) were treated with lactate for 4 h. The total number of fluorescently labeled neutrophils in the larvae. O) Representative fluorescence images showing the neutrophil distribution in the larvae (n = 6 per group). Scale bar: 100 µm. P) Representative images of neutrophil migration during caudal fin damage in zebrafish larvae, with increased migration observed following lactate treatment (n = 15/group). Q) Quantification of migrated neutrophils in zebrafish larvae, showing significant increases in migration following lactate treatment. R) Gene expression levels of transcription factors (Cebpa, PU.1, Cebp1, Gfi1, Cebpb, and Rora) in zebrafish larvae. Statistical significance was analyzed with unpaired t tests, with significance levels denoted as follows: ns, p > 0.05; *, p < 0.05; **, p < 0.01; ***, p < 0.001; ****, p < 0.0001.
Figure 7
Figure 7
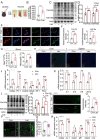
Lactylation modification and its impact on neutrophil‐related changes in mice and zebrafish following 2DG and OXA intervention. A) Schematic representation of the metabolic pathway involved in glucose metabolism, where 2DG inhibits hexokinase (HK) activity and OXA inhibits LDHA, leading to the modulation of lactate levels. B) Experimental design in which C57BL/6J mice were used to investigate the effects of SD and treatment with 2DG and OXA. The mice were injected with PBS or 2DG/OXA 3 h before the onset of sleep deprivation and again 24 h after SD initiation. Tissues were harvested for analysis after 48 h of continuous sleep deprivation. C) Lactate levels in blood neutrophils isolated from the different treatment groups (Con, SD, SD + 2DG, and SD + OXA). D) Western blot analysis showing Pan‐Kla and H3K18la expression in mouse tissues, indicating changes in lactylation following treatment (n = 3/group). E) Immunofluorescence images showing Pan‐Kla and H3K18la expression in neutrophils from each group, visualized under a fluorescence microscope. Scale bar = 20 µm. (n = 6/group). F) Quantification of peripheral blood neutrophil counts under different treatment conditions. Compared with the control, SD led to a significant increase in neutrophil counts. Although the neutrophil counts in the SD + 2‐DG and SD + OXA groups were slightly greater than those in the control group were, both treatments significantly attenuated the increase observed in the SD group (n = 6/group). G) Immunofluorescence analysis showing the distribution of neutrophils (Ly6g+ and MPO+ cells) in the liver and spleen tissues of different treatment groups (Con, SD, SD + 2DG, and SD + OXA) in mice. Scale bar = 20 µm. H) mRNA expression levels of neutrophil‐related genes (Cebpa, Pu.1, Cebpe, Gfi‐1, Cebpb, and Rora) in mouse neutrophils, revealing significant upregulation of neutrophil‐related genes in the SD and SD + 2DG/OXA groups compared with the control group. I) Western blot analysis of Pan‐Kla and H3K18la protein expression levels in zebrafish from each treatment group, showing increased lactylation modifications in response to SDs and intervention. J) Zebrafish larvae at 5 days postfertilization were subjected to sleep deprivation (SD) for 24 h, with additional treatments of 2DG and OXA. The total number of fluorescently labeled neutrophils in larvae was measured under four conditions: control (Con), sleep deprivation (SD), SD + 2DG, and SD + OXA. Representative fluorescence images show the neutrophil distribution in the larvae. Images were acquired via a fluorescence microscope, and the fluorescence intensity was quantified via ImageJ software (n = 6/group). Scale bar: 100 µm. K) mRNA expression analysis of neutrophil‐associated genes (cebpα, pu.1, cebpβ, gfi1, and rora) in zebrafish following treatment with lactate‐modifying agents (2DG/OXA). Significant changes in gene expression were observed in the treated groups compared with the control groups. The data were analyzed via one‐way ANOVA with Tukey's post hoc test, with significance levels denoted as follows: ns, p > 0.05; *, p < 0.05; **, p < 0.01; ***, p < 0.001; ****, p < 0.0001.
Figure 8
Figure 8
CUT&Tag genome‐wide analysis of the transcriptional effects of H3K18la in response to sleep deprivation. A) Schematic of the experimental design illustrating the comparison between the control and sleep deprivation conditions. Three biological replicates were performed for each group, and CUT&Tag sequencing was conducted to analyze H3K18 lactylation binding at gene promoters. B) Heatmap showing differential H3K18 lactylation binding peaks at genes in response to sleep deprivation, as assessed by CUT&Tag. The heatmap illustrates changes in lactylation modifications between the Con and SD groups. C) Volcano plot highlighting the differentially expressed genes (DEGs) between Con and SD conditions, with genes categorized on the basis of their lactylation status (gain, loss, stable). The plot shows significant changes in gene expression associated with H3K18 lactylation following sleep deprivation. D) Distribution of genomic features associated with differentially regulated promoters following sleep deprivation, indicating the genomic regions most affected by lactylation modification. E) Gene Ontology (GO) enrichment analysis of genes associated with upregulated H3K18 lactylation peaks located in promoter regions, highlighting key immune‐related processes such as neutrophil‐mediated bacterial killing and interleukin‐17 signaling. The enriched GO terms are clustered and summarized according to their positions in the GO hierarchical classification system. The closer the terms are, the more similar their functions are. The results of term induction are presented on the right side; The size of the dots represents the number of genes located in the term in the gene set to be enriched. The color ranges from blue to red, and the significance gradually increases. F) Bubble plot visualization of enriched GO terms reveals significant associations of these genes whose expression is upregulated with immune responses and inflammatory activation, processes closely linked to sleep deprivation. G–J) Genome browser tracks of representative genes (Mapk9, Rora, Cxcl12, and Cb4) showing differential H3K18 lactylation patterns at promoter regions between the control and SD groups, with shaded areas indicating the differential peak regions. K) KEGG pathway enrichment analysis of genes linked to upregulated H3K18 lactylation peaks revealed their involvement in key immune regulatory pathways, including inflammatory mediator regulation of TRP channels, circadian rhythm, and the PPAR signaling pathway. These findings suggest that sleep deprivation modulates the epigenetic regulation of immune function through the dynamic remodeling of H3K18 lactylation.
Figure 9
Figure 9
RORα participates in neutrophil migration and inflammatory responses during sleep deprivation. A) Representative fluorescence images of neutrophil distribution in rora+/+ and rora−/− zebrafish larvae under control, SD 24 h, and lactate treatment conditions (Lac, 4 h). Neutrophils were visualized in 5 dpf Tg(mpx:GFP) zebrafish via fluorescence microscopy. Scale bar: 100 µm. B) Quantification of the total fluorescence intensity of neutrophils in each group (n = 6 per group). C) Representative images showing neutrophil recruitment to the injury site in a caudal fin transection model. Neutrophil migration was significantly enhanced under SD and Lac conditions in rora+/+ zebrafish but not in rora−/ zebrafish. Scale bar: 100 µm. D) Quantification of migrated neutrophils (top) and variance analysis (bottom) under different conditions (n = 15/group). E,F) RT‒qPCR analysis showing that SD induces cebpb expression in WT zebrafish but not in rora−/− mutants. (n = 3). G) Schematic of the cebpb overexpression construct (pcDNA3.1‐cebpb). H–M) Overexpression of cebpb in rora−/− zebrafish partially rescued the expression of key inflammatory genes, including cebpb, cxcl8a, cxcl8b.1, tnfa, il1b, and il6, under SD conditions (n = 3 per group). N) Representative images of neutrophil migration in WT, rora−/−, and rora−/− + cebpb zebrafish following SD and tail injury. Cebpb overexpression restored the impaired migration phenotype in rora‐deficient zebrafish. O) Quantification of migrated neutrophils in each group (n = 15/group). Statistical significance was determined via unpaired t tests or one‐way ANOVA followed by Tukey's post hoc test, as appropriate. ns, p > 0.05; *p < 0.05; **p < 0.01; ***p < 0.001; ****p < 0.0001.

References

    1. Dempsey L. A., Nat. Immunol. 2024, 25, 3. - PubMed
    1. Lane J. M., Qian J., Mignot E., Redline S., Scheer F. A. J. L., Saxena R., Nat. Rev. Genet. 2023, 24, 4. - PMC - PubMed
    1. Irwin M. R., Nat. Rev. Immunol. 2019, 19, 702. - PubMed
    1. Morrison M., Halson S. L., Weakley J., Hawley J. A., Sleep Med. Rev. 2022, 66, 101700. - PubMed
    1. Meyer N., Harvey A. G., Lockley S. W., Dijk D. J., Lancet 2022, 400, 1061. - PubMed

LinkOut - more resources