. 2025 Aug 13;17(32):45847-45858.
doi: 10.1021/acsami.5c08760. Epub 2025 Jul 21.

Touch-Enabled Reversible Microfluidic Ultradense Chips for Convenient, High-Throughput Electrochemical Assays

Affiliations

Touch-Enabled Reversible Microfluidic Ultradense Chips for Convenient, High-Throughput Electrochemical Assays

Pedro H N da Silva et al. ACS Appl Mater Interfaces. .

Abstract

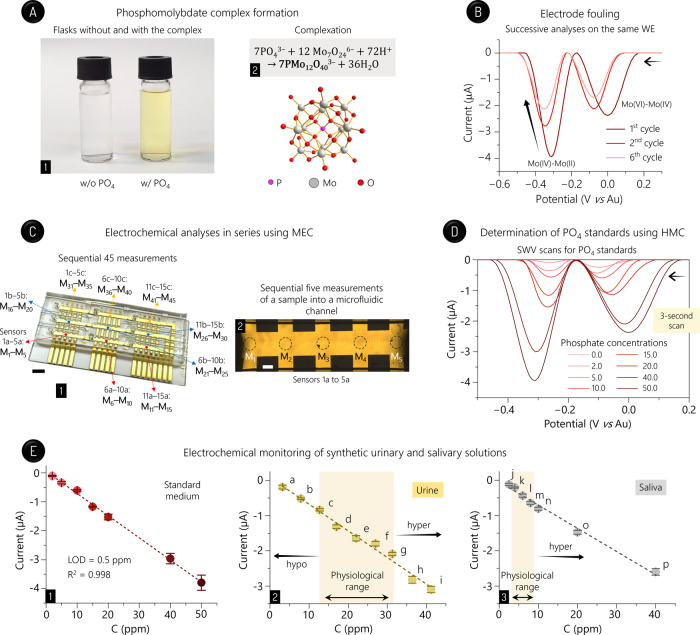
Here, we present a new approach to reversibly bond microfluidic polydimethylsiloxane (PDMS) channels on low-cost, reproducible, scalable, compact, and ultradense multisensor SU-8-coated chips toward high-throughput electrochemical assays. Based on putting the outlets at the bottom of PDMS, the method only needs manually attaching this substrate on a flat surface, thus offering simplicity, throughput, and reversibility. While a plasma-mediated approach failed to provide leakage-free bonding, the reversibly bonded devices presented a high adhesion strength, withstanding a pressure of at least 5.1 MPa. Because the approach is high-pressure tolerant and reversible, it can deliver both long-term analyses and ease of sampling in-channel material for posterior manipulation/characterization and even sensor regeneration. Importantly, the bonding also delivers long-term shelf life and reusability. Three proof-of-concept applications are presented: (i) the electrodeposition of different nanostructured microelectrodes, followed by their downstream characterization and electrochemical tests, (ii) the long-term proliferation and monitoring of colorectal and breast cancer cells through electrochemical cell adhesion assays, along with the following regeneration of sensors and drug susceptibility testing, and (iii) the electrode fouling-amenable determination of phosphate in synthetic body fluids (urine and saliva) for health assessment purposes. High-throughput assays were provided by the chips from fast analyses in series utilizing a hand-held one-channel potentiostat. For instance, 45 analyses could be completed within ∼135 s. One should also note that the approach is compatible with different materials. Hence, future studies can explore this generalizable dry bonding to produce other microfluidic systems for diverse applications.

Keywords: array; cell; microfabrication; microfluidics; nanomaterial; phosphate.


Figures

1
1
Reversible device and electrochemical analyses in a 3 mm × 1 mm channel to assess the medium exchange. (A) Reversible bonding provided by a PDMS substrate with fluid outlets on its bottom. PDMS with 3 mm × 1 mm channels (1), laser scanning confocal microscopy (LSCM) image (scale in mm) of a channel wall (2), nine channels highlighted by a red dye (3), and Pascal’s principle applied in the cases with outlets placed at the top and bottom of PDMS (4). In (4), P, P o, F, and A mean hydraulic pressure, atmospheric pressure, force, and area, respectively, whereas ρ, g, and h express liquid density, acceleration of gravity, and liquid column height, respectively. Insets: illustrations (highlighted in blue) of hydrogen bonds between PDMS and SU-8 monomers (only portions of these monomers are shown). Scale bar: 1 cm (3). (B) MEC with 45 sensors. Illustration (1) and stereoscopy image (2) of a sensor, and MEC with each cross point of the fingers forming a sensor (3). In (2), the SU-8 edges defining the WE area are highlighted by face-to-face arrows. WEs and QREs are identified by numbers and letters, respectively. As an example of the electric contact mode, the colored QRE (blue) and WE (red) in (3) are connected to workstation (sensor: 8b) to analyze the on-chip droplet. Scale bar: 100 μm (2). (C) Reversible device. Chip/PDMS bonding (1), bonded device (2), and inverted light microscopy image of the five in-channel sensors 1a–5a (3). Dashed lines highlight one sensor, and the edges of the PDMS channel are stressed by white arrows in (3). Scale bars: 5 (1,2) and 1 mm (3). (D) SWV peaks (at −0.2 V) recorded by successively dropping 60 μL of electrolyte (Ei) and 5.0 mmol L–1 [Fe­(CN)6]3–/4– (probe, Pi) via a manual micropipette. The sensors 11b and 15b are closest to the inlet and outlet, respectively. Insets: illustration of the assay, usual SWV scan (i and E mean current in μA and potential in V, respectively), and redox reactions involving the probe. (E) CA currents (at +0.5 V) by alternatively flowing probe (P) and electrolyte (E) using a peristaltic pump. Three flow rates were tested, as indicated in the graphic. Inset: time (in s) needed to reach stable currents for P and E at 2.0 (P1 and E1), 0.5 (P2 and E2), and 0.1 mL min–1 (P3 and E3). Blue and red arrows indicate fluid inlets and outlets, respectively, throughout the figure.
2
2
NMEs. (A) Devices used along the assays, namely, the bonded device for NME growth, the chip for SEM imaging after PDMS detachment, and again the bonded device for SWV analyses after rebonding with the same PDMS piece. In the top picture, the electrodeposition reaction taking place on the activated sensor (1c in this image, as highlighted) is shown. (B) SEM images. NMEs obtained by applying −0.2 (1–3), −0.3 (4–6), and −1.0 V (7–9). Scale bars: 20 μm (1, 4, and 7), 1 μm (2, 5, and 8; middle of WEs), and 2 μm (3, 6, and 9; edges of SU-8 hole). (C) Analytical performance. SWV scans for the probe (2.0 mmol L–1) using NMEs obtained under −0.2, −0.3, −0.5, −0.6, and −1.0 V (bottom to top signals; 1) and analytical curves (n = 5) using the NMEs obtained at distinct potentials, as stressed (2). Insets: generic circuit of the two-electrode on-MEC cells and reactions involving the probe. (D) Relationship between sensitivity and electrodeposition potential. Solutions were added to channels using a manual micropipette.
3
3
Cell proliferation and sensor regeneration. (A) Detection principle based on the cell-induced steric hindrance against the probe undergoing on-WE redox reactions. Scale bar: 5 mm. (B) Optical images of HT-29 (1,2) and MDA-MD-231 (3,4) 2D cells in suspension (1,3) and adhered on WE after 24-h proliferation (2,4). Scale bars: 20 μm. (C) Inverted light microscopy images of the HT-29 (1) and MDA-MD-231 (2) cells grew along the PDMS channel. Black dashed lines highlight the four sensors (of a total of five) that could be seen in this image. Scale bars: 1 cm. (D) Identification of the nine PDMS channels (I–IX) that was adopted in this article. Scale bar: 5 mm. (E) Cell adhesion SWV assays. SWV peaks (n = 15) for 6.0 mmol L–1 [Ru­(NH3)6]3+ before (BE) and after proliferation (CP) of HT-29 (1) and MDA-MB-231 cells (2). These data are related to the five sensors enclosed in the channels (I–IX). (F) Regeneration of the sensors 6b–10b after proliferating the HT-29 2D cells. SWV scans for 2 mmol L–1 [Fe­(CN)6]3–/4– using the regenerated and control (C; i.e., bare) sensors. Inset: global SWV peaks (n = 15) related to HT-29 cell adhesion tests using regenerated sensors. Media were added to channels using an automatic micropipette.
4
4
Phosphorus analysis. (A) Complex formation. Visual confirmation of the electroactive phosphomolybdate complex generated after letting phosphorus react with molybdate ammonium (1), together with this complexation reaction and the complex structure (2). (B) Serial SWV scans, as indicated, for phosphate standards at 50.0 ppm. The two peaks relative to the phosphomolybdate complex reduction are shown. (C) SWV analyses in series using the chip. Indication of the 45 measurements (M1–M45) along the nine PDMS channels (1) and 5 measurements (M1–M5) utilizing the sensors 1a–5a (2). Scale bars: 5 (1) and 1 mm (2). (D) SWV scans for phosphate standards at distinct concentrations (ppm), as indicated. (E) Analytical performance (n = 5). Analytical curve for phosphate standards (1), and curves related to the monitoring of synthetic bodily fluids with standard phosphonate additions, i.e., 320, 790, 1270, 1700, 2200, 2700, 3127, 3640, and 4120 ppm in urine (a–i; 2), and 250, 400, 600, 800, 1000, 2000, and 4000 ppm in saliva (j–p; 3). The physiological ranges for each sample with no incidence of hypophosphatemia (hypo) and hyperphosphatemia (hyper) are indicated in (2,3). Solutions were added to channels employing a manual micropipette.

References

    1. Campuzano S., Pingarron J. M.. Electrochemical Affinity Biosensors: Pervasive Devices with Exciting Alliances and Horizons Ahead. ACS Sens. 2023;8(9):3276–3293. doi: 10.1021/acssensors.3c01172. - DOI - PMC - PubMed
    1. Zhang Z., Ma P., Ahmed R., Wang J., Akin D., Soto F., Liu B. F., Li P., Demirci U.. Adv. Mater. 2022;34:2103646. doi: 10.1002/adma.202103646. - DOI - PubMed
    1. Lam B., Das J., Holmes R. D., Live L., Sage A., Sargent E. H., Kelley S. O.. Nat. Commun. 2013;4:2001. doi: 10.1038/ncomms3001. - DOI - PubMed
    1. Abdellaoui S., Noiriel A., Henkens R., Bonaventura C., Blum L. J., Doumèche B.. A 96-Well Electrochemical Method for the Screening of Enzymatic Activities. Anal. Chem. 2013;85(7):3690–3697. doi: 10.1021/ac303777r. - DOI - PubMed
    1. Aymard C., Bonaventura C., Henkens R., Mousty C., Hecquet L., Charmantray F., Blum L. J., Doumèche B.. High-Throughput Electrochemical Screening Assay for Free and Immobilized Oxidases: Electrochemiluminescence and Intermittent Pulse Amperometry. ChemElectroChem. 2017;4(4):957–966. doi: 10.1002/celc.201600647. - DOI

MeSH terms

LinkOut - more resources