. 2025 Nov 15;157(10):2156-2172.
doi: 10.1002/ijc.70038. Epub 2025 Jul 21.

The anti-aging Klotho protects glioblastoma macrophages from radiotherapy-induced inflammation and predicts immunotherapy response

Affiliations

The anti-aging Klotho protects glioblastoma macrophages from radiotherapy-induced inflammation and predicts immunotherapy response

Andrea Galluzzo et al. Int J Cancer. .

Abstract

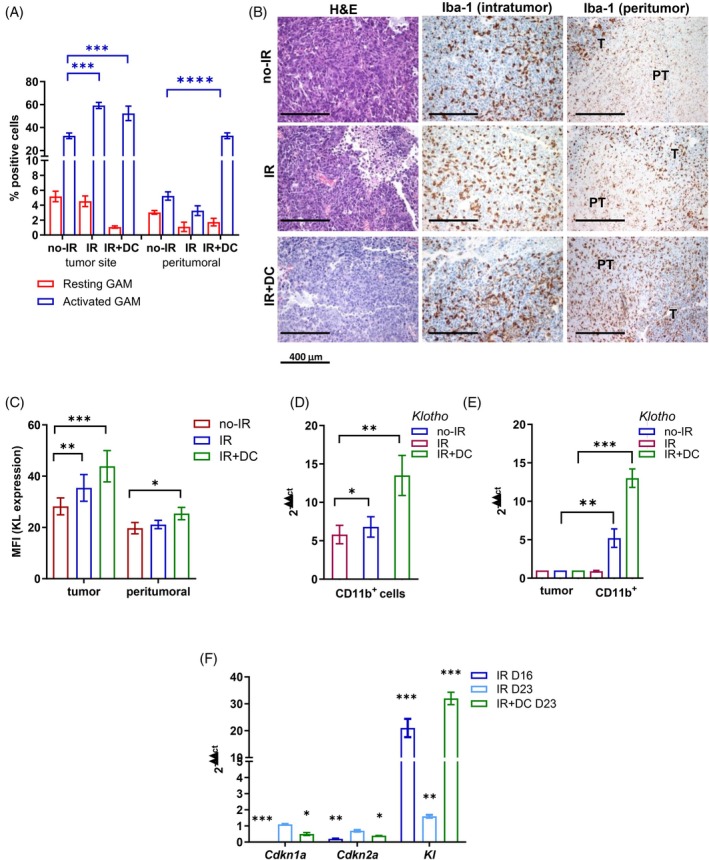
Immunosuppressive myeloid cells, such as microglia and macrophages, play a key role in mediating resistance to immunotherapy in glioblastoma patients. Bulk RNA sequencing analysis revealed elevated expression of Klotho (Kl) in gliomas derived from irradiated glioma-bearing mice. Klotho, which encodes an anti-aging protein, was found to be upregulated in glioma-associated microglia/macrophages (GAMs) exhibiting an M1 pro-inflammatory phenotype. This upregulation appeared to enhance the antitumor efficacy of a combination of radiotherapy and dendritic cell (DC) immunotherapy. Furthermore, transcript levels of KL in tumor specimens and corresponding serum levels in glioblastoma patients undergoing DC immunotherapy were correlated with favorable prognostic outcomes and improved treatment responses. Given its expression in human M1-like GAMs, serum KL levels can offer valuable insights into the immune microenvironment and hold clinical significance as a peripheral biomarker. These findings highlight the pivotal role of Klotho as a prognostic biomarker for predicting responses to immunotherapy, with potential applications for monitoring tumor progression or regression through changes in serum levels.

Keywords: glioblastoma; immunotherapy; inflammation; macrophages; radiotherapy.


Conflict of interest statement

All authors declare no conflict of interest.

Figures

FIGURE 1
FIGURE 1
Radiation‐induced changes in gene expression. (A) PCA showing the samples in the 2D plane spanned by their first two principal components. (B) The heatmap clustering of the samples and the DEGs (Base mean >10), considering 31 differentially expressed genes (adjusted p‐value <0.01, lfc <−1 or >1). The color legend has scaled normalized counts: Red are upregulated genes, and blue are downregulated genes. (C) The plot of Kl gene normalized counts was obtained with the plotCounts function (DESeq2, R software). (D) Bar histograms showing the relative expression of Kl by Real‐time PCR in explanted GL261 gliomas of IR‐treated versus control (untreated no‐IR) mice on Days 16 and 21 after tumor implantation. (E, F) Bar histograms showing the relative expression of Cdkn1a (E) and Cdkn2a (F) by Real‐time PCR in IR‐treated compared to no‐IR at two different time points (Day 16 and 21). Data show the mean ± SD (**p < 0.005, ***p < 0.0001, ****p < 0.00001).
FIGURE 2
FIGURE 2
KL‐expressing GAMs and M1‐proinflammatory phenotype. (A) Bar histograms of CD45dim and bright frequency by flow cytometry in no‐IR and IR‐treated gliomas; (B) Flow cytometry dot plots showing resting CD11b+ and CD45low (no‐IR 5.2 ± 1.1 vs. IR‐treated 8.4 ± 2.3, p = 0.04) and activated CD11b+ and CD45high (no‐IR 19.4 ± 0.2 vs. IR‐treated 35.6 ± 5.2, p = 0.007) GAMs (left panels). (B) Ly6Clow and Ly6Chigh within the activated pool in no‐IR and IR‐treated gliomas (right panels). (C) Mean fluorescence intensity (MFI) of KL in Ly6C expressing GAMs in both no‐IR and IR‐treated gliomas. (D, E) The real‐time PCR relative expression of genes related to the M1 and M2 subtypes on Day 16 was detected also in normal brain tissue (IR vs. no‐IR *p < 0.01, **p < 0.005, ***p < 0.0001). The data from three experiments are presented as the mean ± SD. (F, G) Representative H&E staining (left panels) and IHC CD206 analysis (central and right panels) of gliomas from untreated (no‐IR) and irradiated (IR‐treated) mice (scale bars 400 and 50 μm). (H) The frequency of infiltrating CD4+ and CD8+ T cells in the CD45+ component isolated from no‐IR and IR‐treated gliomas was assessed by flow cytometry. The data from three experiments are presented as the mean ± SD (**p < 0.005, ***p < 0.0001). (I) Mean fluorescent intensity (MFI) of KL expression on the surface of CD8+ and CD4+ TILs from no‐IR and IR‐treated gliomas by flow cytometry. The data from six animals are presented as the mean ± SD. (**p < 0.005, ***p < 0.0001).
FIGURE 3
FIGURE 3
KL‐expressing GAMs and response to DC immunotherapy. (A) Quantification of resting and activated GAMs assessed by flow cytometry using CD11b and CD45 markers in no‐IR, IR‐treated, and IR + DC‐treated gliomas in the tumor and peritumoral area. (B) Morphological (H&E) and IHC analysis of Iba‐1+ cells at the center and periphery from no‐IR, IR, and IR + DC treated tumors. (C) Mean fluorescence intensity (MFI) of KL expression on activated GAMs isolated from the center and periphery of no‐IR, IR, and IR + DC treated tumors. (D) Real‐time PCR quantification of Kl relative expression on CD11b+ positive cells vs. normal brain used as a reference in no‐IR, IR, and IR + DC treated gliomas. (E) Real‐time PCR quantification of Kl relative expression in the CD11b+ compared to the tumor fraction in no‐IR, IR, and IR + DC treated gliomas. (F) Relative expression of Cdkn1a, Cdkn2a, and Kl genes in IR‐treated glioma on Day 16 and IR and IR + DC‐treated gliomas on Day 23 compared with no‐IR by Real‐time PCR. Data show the mean ± SD (*p < 0.01, **p < 0.005, ***p < 0.0001, ****p < 0.00001).
FIGURE 4
FIGURE 4
KL expression in GAMs and DNA damage assessment after inflammatory signals. (A) Flow cytometry dot plots of immune cells isolated from glioblastoma surgical material using CD45 and CD11b markers to identify activated GAMs (CD45high CD11b+, left panel); CD14+ monocyte‐derived GAMs were evaluated for KL (central panel), CD49d, and HLA‐DR (right panel) expression. (B) Mean fluorescence intensity (MFI) quantification of M1 and M2 typical markers and (C) KL expression on glioblastoma GAMs. (D, E) Representative dot plots of GAMs cultured in M1 differentiation medium (D) evaluated for KL expression within the M1 and M2‐like subtypes (E). The data from six samples are presented as the mean ± SD (**p < 0.005, ***p < 0.0001). (F, G) Representative picture of IHC performed on glioblastoma specimens, evaluating the co‐expression of CD14 (brown) and KL (magenta) (F), and P2RY12 (brown) and KL (magenta) (G). (H) Quantification of KL expression as mean fluorescence intensity was evaluated in monocytes from old (>60) and young (<50) healthy donors (H‐mono) and patients (Pt‐mono), and CD14+ tumor‐associated monocytes (GAMs). The data from six samples are presented as the mean ± SD (MFI: 134 vs. 18; ***p < 0.0001). (I) Immunoblots of γH2AX in GAMs from patient glioblastomas and peripheral monocytes from young and old donors before and after irradiation with two doses (4 and 10 Gy) at 3 and 24 h. (J, K) Quantification of γH2AX levels based on the housekeeping vinculin at 3 (J) and 24 h (K). (L, M) Quantification of KL protein in GAMs and peripheral monocytes not irradiated, irradiated at 4 and 10 Gy at 3 (L) and 24 h (M). The data are representative of three experiments.
FIGURE 5
FIGURE 5
Predictive value of KL gene expression and serum KL. (A) Quantification of the relative expression of KL in newly diagnosed glioblastomas (n = 39, HIGH KL expression mean = 3.4 ± 2.7, n = 18; LOW KL expression, mean 0.2 ± 0.1, n = 21) compared to normal brain by Real Time‐PCR (p < 0.0001, Mann–Whitney test). (B) Kaplan Meier curves of newly diagnosed glioblastoma patients (n = 39), relative to HIGH and LOW KL expression. (C‐F) Kaplan Meiers curves of newly diagnosed glioblastoma patients enrolled in the DENDR1 study relative to HIGH and LOW KL transcript expression (n = 13, p < 0.0001) (C, D) and serum KL (n = 18) (E, F). (G) Quantification of KL in the serum of responder (Resp n = 8) and nonresponder (noResp n = 10) DENDR1 patients, before starting the treatment (at leukapheresis and 1st vaccination at the end of SOC). (H) Absolute count of monocytes in the peripheral blood of Resp (PFS >12, HIGH KL) and noResp (PFS ≤12, LOW KL) at leukapheresis and 1st vaccination. (I) Quantification by ELISA assay of serum KL (sKL) in Resp and noResp DENDR1 during the treatments (L= leukapheresis; FU= follow up). Data show the mean ± SD (*p < 0.01, **p < 0.005, ***p < 0.0001, ****p < 0.00001).

References

    1. Stupp R, Mason WP, van den Bent MJ, et al. Radiotherapy plus concomitant and adjuvant temozolomide for glioblastoma. N Engl J Med. 2005;352:987‐996. - PubMed
    1. di Ianni N, Maffezzini M, Eoli M, Pellegatta S. Revisiting the immunological aspects of temozolomide considering the genetic landscape and the immune microenvironment composition of glioblastoma. Front Oncol. 2021;11:747690. - PMC - PubMed
    1. Pombo Antunes AR, Scheyltjens I, Lodi F, et al. Single‐cell profiling of myeloid cells in glioblastoma across species and disease stage reveals macrophage competition and specialization. Nat Neurosci. 2021;24:595‐610. - PubMed
    1. Yeo AT, Rawal S, Delcuze B, et al. Single‐cell RNA sequencing reveals evolution of immune landscape during glioblastoma progression. Nat Immunol. 2022;23:971‐984. - PMC - PubMed
    1. Lai Y, Lu X, Liao Y, et al. Crosstalk between glioblastoma and tumor microenvironment drives proneural‐mesenchymal transition through ligand‐receptor interactions. Genes Dis. 2024;11:874‐889. - PMC - PubMed

MeSH terms