. 2025 Jun 20;28(8):112962.
doi: 10.1016/j.isci.2025.112962. eCollection 2025 Aug 15.

Inference of antimicrobial resistance (AMR) from a whole genome database outperforming AMR gene detection

Affiliations

Inference of antimicrobial resistance (AMR) from a whole genome database outperforming AMR gene detection

Pornsawan Cholsaktrakool et al. iScience. .

Abstract

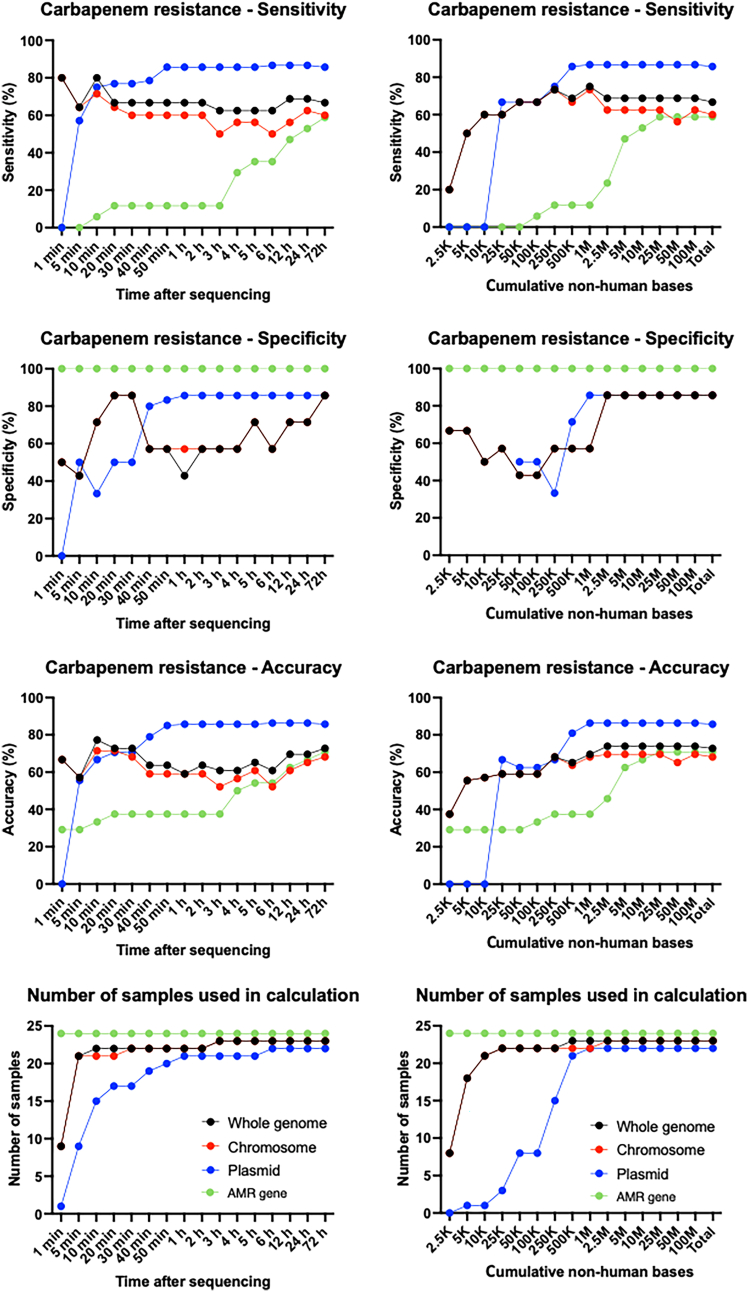
This study focuses on the rapid detection of antimicrobial resistance (AMR) in Klebsiella pneumoniae. The "Align-Search-Infer" pipeline aligned query sequences from 24 urine samples against a curated genome database of 40 Klebsiella isolates, searched for the best matches, and inferred their antimicrobial susceptibility. Carbapenem resistance inference achieved 77.3% accuracy (95%CI: 59.8-94.8%) within 10 min using whole-genome matching, and 85.7% accuracy (95%CI: 70.7-100.0%) within 1 h using plasmid matching - both surpassing the 54.2% accuracy (95%CI: 34.2-74.1%) of AMR gene detection at 6 h. The proposed method requires less bacterial DNA and is suitable for low-load clinical samples. Our small local database performed comparably to large public databases. This study supports the integration of pathogen-specific genome databases into clinical workflows to enable rapid and accurate antimicrobial susceptibility prediction. Further research is needed to validate and refine the method using larger genomic-phenotypic datasets across diverse pathogens and sample types.

Keywords: Biological sciences; Microbial genomics; Microbiology; Natural sciences.


Conflict of interest statement

The authors declared no conflict of interest.

Figures

None
Graphical abstract
Figure 1
Figure 1
Overall study workflow (created with BioRender.com) (A) Sample processing and sequencing of the database group, obtained from 40 Klebsiella clinical isolates. (B) Sample processing and sequencing of the query group, obtained from 24 urine samples. (C and D) The bubble plots displaying the quality of reads, with colors corresponding to the quality score, size related to the median read length, and Y axis representing sequencing depth. (E) Workflow of de novo whole genome assembly optimization. (F) Workflow of rapid inference of antimicrobial susceptibility.
Figure 2
Figure 2
Evaluation of assembled genome quality based on various metrics (A) Radar graph showing 40 samples with their correlated quality scores after filtering with various minimal read length thresholds. (B) Relative performance of assemblers based on six metrics: (1) Successful assembly to a circular chromosome. (2) N50 value: the length of the shortest contig for which the sum of the lengths of this contig and all longer contigs covering at least 50% of the total assembly length, representing genome continuity. (3) Percentage of GC content: ensuring the assembled genome representation of the true genomic sequence, free from significant errors or contamination. (4) Percentage of complete and single-copy BUSCOs: indicating genome completeness. (5) Assembly speed. (6) Polishing speed. (C) Box and whisker plot showing median and interquartile range of assembly continuity based on the auN metric. A higher auN value suggests a more continuous and complete assembly. (D) Visualization of the assembled genome of KP01 using Bandage software, demonstrating the characteristics of each assembler (Canu, Necat, Flye, Paoloshasta, Raven, and Unicycler) in terms of genome continuity and the number of contigs. (E) Bar plots displaying the BUSCO assessment results for six different assemblers across all samples. The colors blue, dark blue, yellow, and red represented complete and single copy, complete and duplicated, fragmented, and missing, respectively. (X axis = %BUSCOs, Y axis = Local 40KP isolates).
Figure 3
Figure 3
Phylogenetic analysis of Klebsiella genomes (A) Bubble plot illustrating the log number of cumulative matched bases by Minimap2 between the phylogenetic tree of the local 38 K. pneumoniae database (Y axis) and the 24 urine sample queries (x axis). Larger bubbles represented a higher number of cumulative matched bases, indicating greater genome similarity. Letters A, B, C, and D represented the patterns of agreement between the actual and the inference susceptibility as shown in the table next to the tree. These letters marked the largest bubbles for each query, indicating the best match in the database that would be used for this query AMR inference. (B) Phylogenetic tree of the whole genome of Klebsiella pneumoniae species complex integrated with antimicrobial susceptibility phenotypes, classified into three classes: CRE (red), ESBL (yellow), and non-CRE/non-ESBL (green). The tree included 436 taxa from NCBI and 40 taxa from locally (highlighted in blue). (C) A clade of K. pneumoniae ST16 with CRE phenotypes in Bangkok, Thailand. (D) A clade of 13 local K. pneumoniae isolates (mainly ST16) with CRE phenotypes. (E) A clade of K. pneumoniae ST147, mainly CRE with few ESBL phenotypes. In the local database, U04 query matched with KP29 (ESBL) the best, followed by KP22 (CRE). In contrast, U04 matched with GenBank: GCA 003194285.1 (CRE) the best in the public database. Note that KP29 was closely related to KP22 and Genbank: GCA 003194285.1 in this tree, but had different resistance phenotypes. Labeling of each terminal taxa in the tree was arranged in the following order: 1) Unique ID – KP01-KP44 (local database) or GCA [nine digits].[version number] (GenBank assembly accession numbers—public database); 2) Species – KP (K. pneumoniae), KV (K. variicola), KQ (K. quasipneumoniae); 3) Year; 4) Location; 5) Resistance phenotypes – CRE (carbapenem resistance), ESBL (3rd-gen cephalosporin resistance), non (susceptible to both carbapenems and 3rd-gen cephalosporins); 6) Pasteur-scheme Multi-Locus Sequence Typing (xMLST-x-x-x-x-x-x-x) – The number before the word MLST represented Sequence Type (ST), while the following numbers represented the alleles of gapA, infB, mdh, pgi, phoE, rpoB, and tonB, respectively.
Figure 4
Figure 4
Optimizing the inference strategy The written pattern of inference strategy on the left column was [matching method_ urine query_genome database (number of data points)]. The maximal number of data points possible was 15 (antimicrobials) x 24 (queries) = 360 data points. The loss of data points could be due to the absence of AST reports for some antimicrobials in the databases. The assembled genomes in public databases were produced from various platforms, both short-read and long-read, leading to inconsistency. Therefore, we inferred using whole genomes only. The best strategy in terms of overall sensitivity, specificity, and accuracy was marked in a red rectangle. The right column demonstrates the performance of the best strategy on each antibiotic.
Figure 5
Figure 5
Carbapenem resistance inference from the local bacterial genome database outperforming direct detection of carbapenemase genes in most aspects
Figure 6
Figure 6
Ceftriaxone resistance inference from the local bacterial genome database outperforming detection of bla genes that hydrolyze ceftriaxone in most aspects

Similar articles

References

    1. Mancuso G., Midiri A., Gerace E., Biondo C. Bacterial antibiotic resistance: the most critical pathogens. Pathogens. 2021;10:1310. doi: 10.3390/pathogens10101310. - DOI - PMC - PubMed
    1. Antimicrobial Resistance Collaborators Global burden of bacterial antimicrobial resistance in 2019: a systematic analysis. Lancet. 2022;399:629–655. doi: 10.1016/s0140-6736(21)02724-0. - DOI - PMC - PubMed
    1. Llor C., Bjerrum L. Antimicrobial resistance: risk associated with antibiotic overuse and initiatives to reduce the problem. Ther. Adv. Drug Saf. 2014;5:229–241. doi: 10.1177/2042098614554919. - DOI - PMC - PubMed
    1. Ventola C.L. The antibiotic resistance crisis: part 1: causes and threats. P T. 2015;40:277–283. - PMC - PubMed
    1. Melander R.J., Zurawski D.V., Melander C. Narrow-spectrum antibacterial agents. Medchemcomm. 2018;9:12–21. doi: 10.1039/c7md00528h. - DOI - PMC - PubMed

LinkOut - more resources