. 2025 Jun 28;28(8):113036.
doi: 10.1016/j.isci.2025.113036. eCollection 2025 Aug 15.

Understanding ozone variability in spatial responses to emissions and meteorology in China using interpretable machine learning

Affiliations

Understanding ozone variability in spatial responses to emissions and meteorology in China using interpretable machine learning

Xin Zhang et al. iScience. .

Abstract

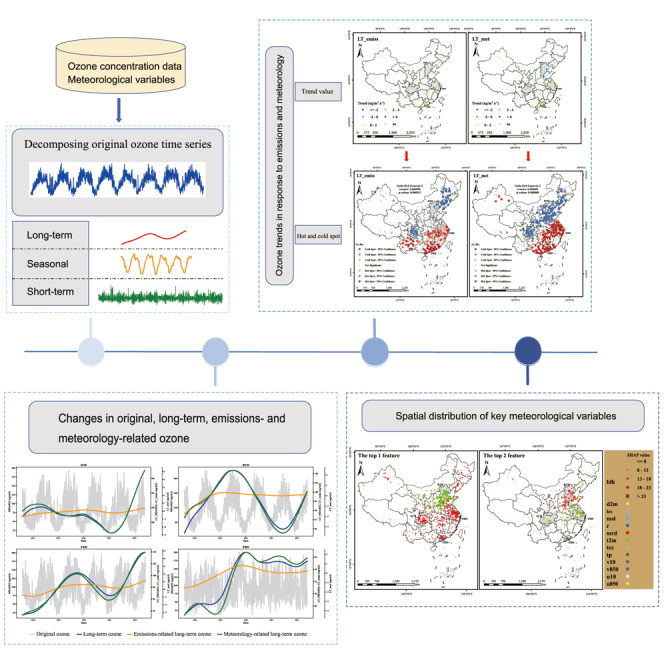
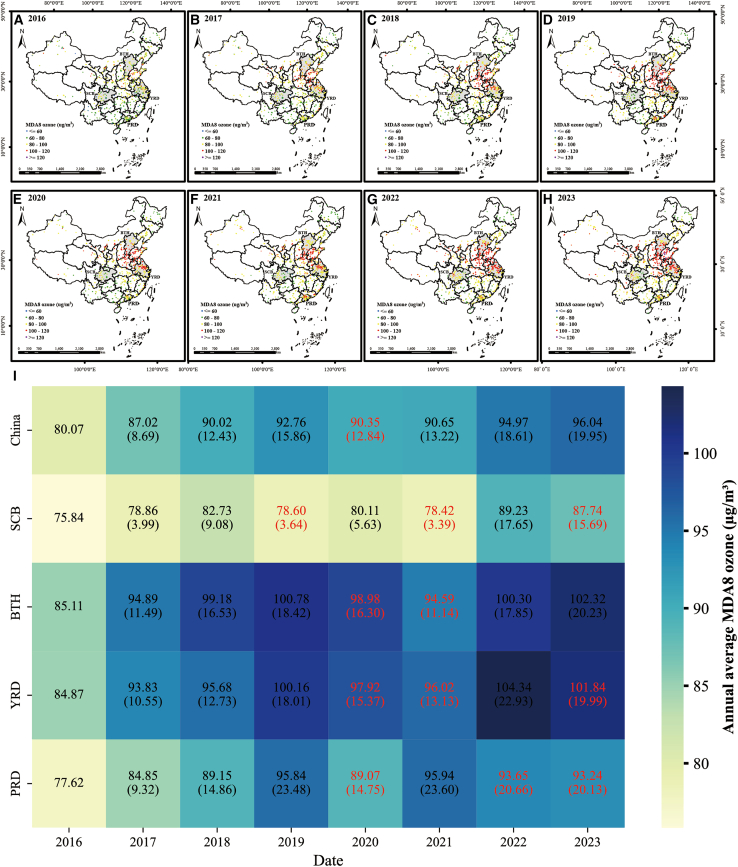
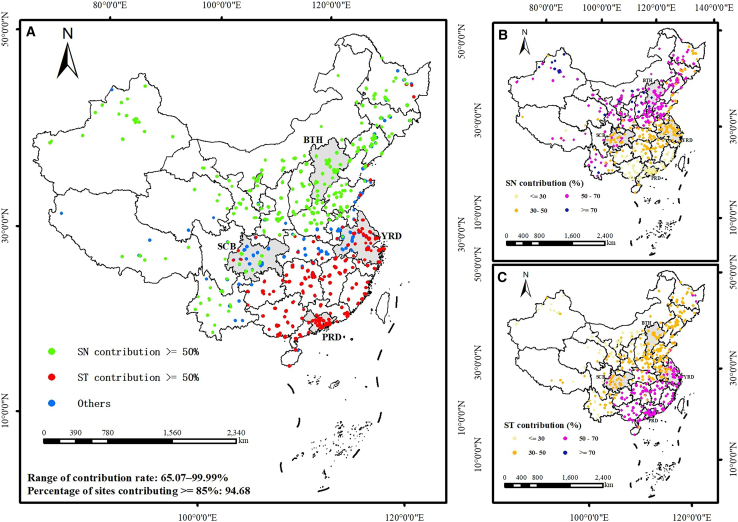
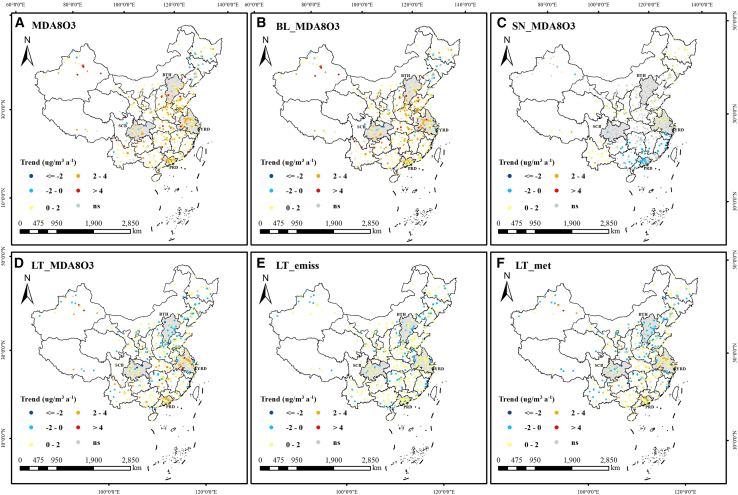
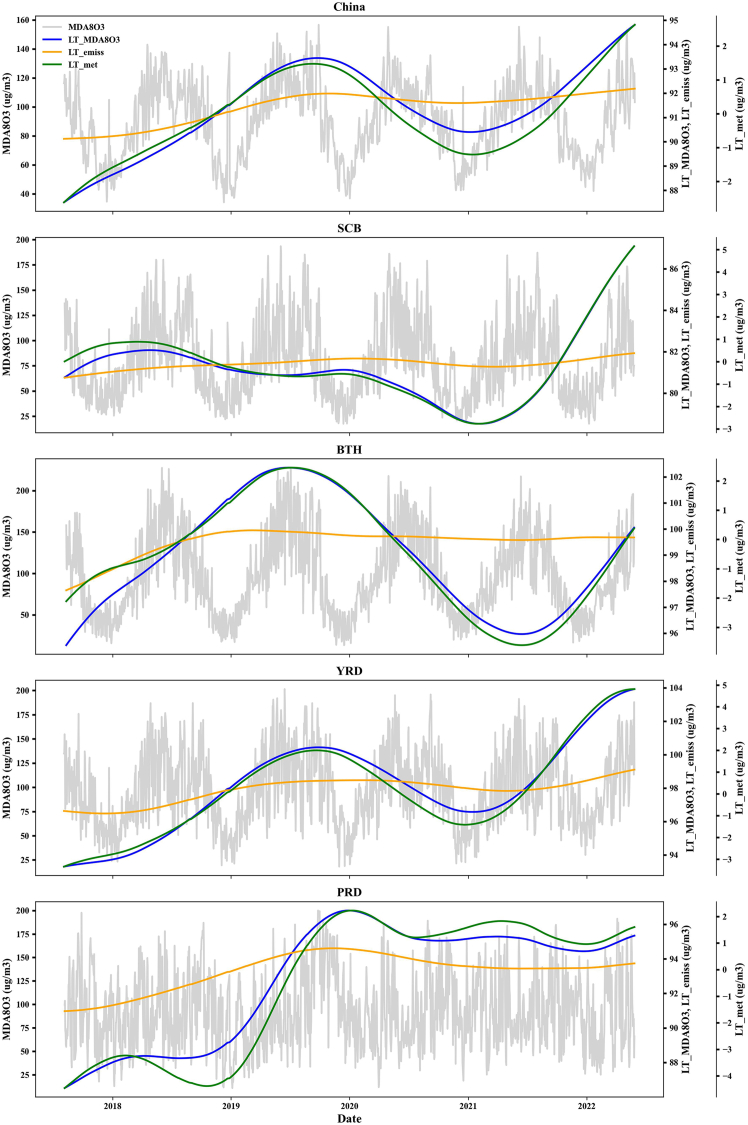
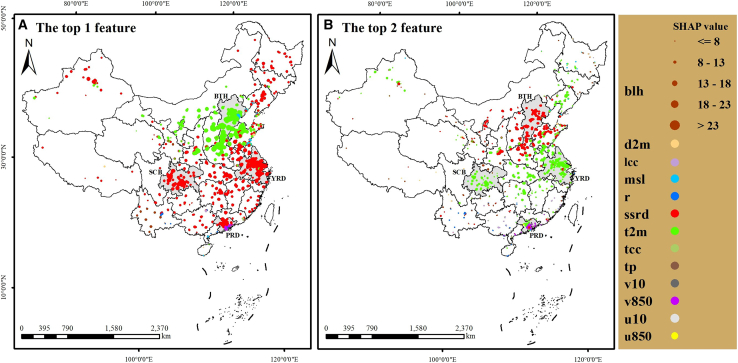
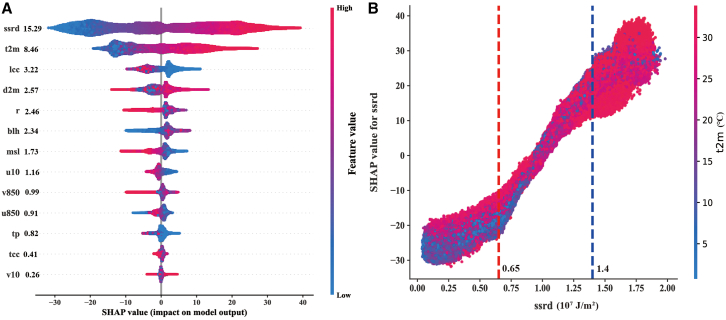
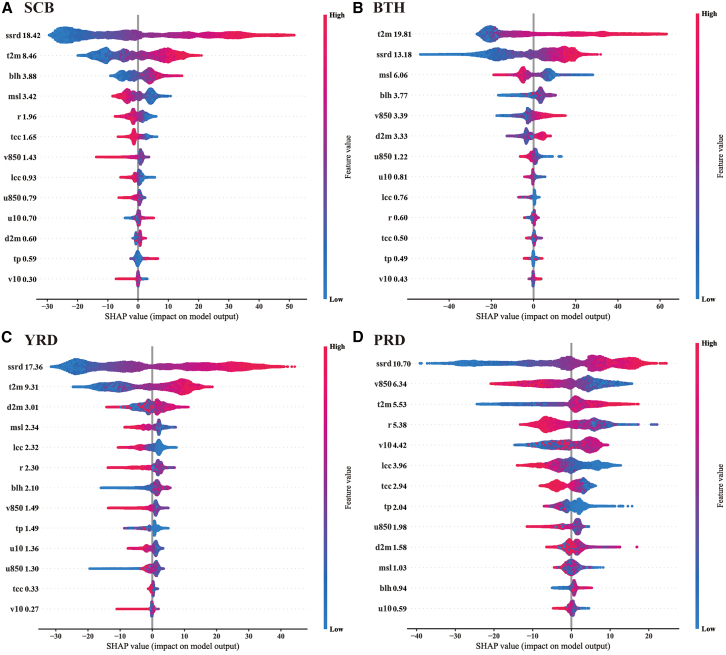
To effectively control regional ozone pollution, it is crucial to investigate ozone variability in spatial responses to emissions and meteorology. Using ozone data from monitoring stations across mainland China (2016-2023) and applying statistical methods alongside interpretable machine learning, the study finds that ozone variation is driven by seasonal cycles in the north and short-term fluctuations in the south. The increase in ozone levels driven by emissions has slowed, with an average trend of 0.41 μg/m3 a-1 across China. Meteorological impacts vary regionally, leading to decreased ozone concentrations in the Beijing-Tianjin-Hebei and Sichuan Basin, and elevated concentrations in the Yangtze River Delta and Pearl River Delta. Temperature is the main factor influencing ozone variability in the North China region, while solar radiation dominates in other regions, with an interaction between them. Under moderate radiation, temperature has a greater impact on ozone; otherwise, solar radiation is dominant.

Keywords: atmospheric chemistry; atmospheric observation; atmospheric science; machine learning; meteorology.


Conflict of interest statement

The authors declare no competing interests.

Figures

None
Graphical abstract
Figure 1
Figure 1
Annual variations in ground-level MDA8 ozone concentrations from 2016 to 2023 (A–H) Spatial distribution of the annual average MDA8 ozone concentrations. (I) Annual average ozone concentrations and growth rates (%) (with values in parentheses representing relative changes compared to the 2016 average) for mainland China, Sichuan Basin (SCB), Beijing-Tianjin-Hebei (BTH), the Yangtze River Delta (YRD), and the Pearl River Delta (PRD). In (I), values marked in red indicate a decrease compared to the previous year, and the color blocks are shaded according to the annual average MDA8 ozone concentrations.
Figure 2
Figure 2
Spatial distribution of SN and ST contributions to ozone variations (A) Spatial distribution of ozone variations dominated by either seasonal (SN) or short-term (ST) contributions. The “other” category indicates that the contributions from both SN and ST individually account for less than 50%. (B) Spatial distribution of SN contributions. (C) Spatial distribution of ST contributions.
Figure 3
Figure 3
Spatial distribution of trends for the original ozone time series (MDA8O3), baseline component (BL_MDA8O3), seasonal component (SN_MDA8O3), long-term component (LT_MDA8O3), emissions-related ozone (LT_emiss), and meteorology-related ozone (LT_met)
Figure 4
Figure 4
Changes in the original ozone time series and its decomposed components Changes in the original ozone time series (MDA8O3), long-term component (LT_MDA8O3), emissions-related ozone (LT_emiss), and meteorology-related ozone (LT_met). Cycles of the long-term components shorter than 1.7 years were removed due to the repetitive iterations of the moving average.
Figure 5
Figure 5
Spatial distribution of key meteorological factors (A) Spatial distribution of the dominant meteorological factor. (B) Spatial distribution of the second most influential meteorological factor. Only monitoring stations with an R2 value greater than 0.5 in the XGBoost model are shown.
Figure 6
Figure 6
Contribution and interaction of meteorological factors to ozone concentration (A) Contribution of individual meteorological factors to ozone concentration across mainland China. (B) Interactive effect of solar radiation and temperature on ozone concentration. In (B), the dashed red and blue lines indicate the dividers of solar radiation, and the points are colored according to temperature.
Figure 7
Figure 7
Contribution of individual meteorological factors to ozone concentrations at monitoring stations in the Sichuan Basin (SCB), Beijing-Tianjin-Hebei (BTH), the Yangtze River Delta (YRD), and the Pearl River Delta (PRD)
Figure 8
Figure 8
Ozone concentrations under different combinations of solar radiation and temperature SS, stronger ssrd (exceeding 1.4 × 10⁷ J/m2); MS, moderate ssrd (0.65 × 10⁷ to 1.4 × 10⁷ J/m2); WS, weaker ssrd (below 0.65 × 10⁷ J/m2); HT, higher t2m (exceeding 25°C); MT, moderate t2m (10°C–25°C); LT, lower t2m (below 10°C).

Similar articles

References

    1. Anenberg S.C., Schwartz J., Shindell D., Amann M., Faluvegi G., Klimont Z., Janssens-Maenhout G., Pozzoli L., Van Dingenen R., Vignati E., et al. Global Air Quality and Health Co-benefits of Mitigating Near-Term Climate Change through Methane and Black Carbon Emission Controls. Environ. Health Perspect. 2012;120:831–839. doi: 10.1289/ehp.1104301. - DOI - PMC - PubMed
    1. Yue X., Unger N., Harper K., Xia X., Liao H., Zhu T., Xiao J., Feng Z., Li J. Ozone and haze pollution weakens net primary productivity in China. Atmos. Chem. Phys. 2017;17:6073–6089. doi: 10.5194/acp-17-6073-2017. - DOI
    1. Unger N., Zheng Y., Yue X., Harper K.L. Mitigation of ozone damage to the world’s land ecosystems by source sector. Nat. Clim. Chang. 2020;10:134–137. doi: 10.1038/s41558-019-0678-3. - DOI
    1. Li K., Jacob D.J., Liao H., Shen L., Zhang Q., Bates K.H. Anthropogenic drivers of 2013–2017 trends in summer surface ozone in China. Proc. Natl. Acad. Sci. USA. 2019;116:422–427. doi: 10.1073/pnas.1812168116. - DOI - PMC - PubMed
    1. Ding D., Xing J., Wang S., Dong Z., Zhang F., Liu S., Hao J. Optimization of a NOx and VOC Cooperative Control Strategy Based on Clean Air Benefits. Environ. Sci. Technol. 2022;56:739–749. doi: 10.1021/acs.est.1c04201. - DOI - PubMed

LinkOut - more resources