

Associations between exposure to heavy metal and sarcopenia prevalence: a cross-sectional study using NHANES data
- PMID: 40687130
- PMCID: PMC12272888
- DOI: 10.3389/fpubh.2025.1588041
Associations between exposure to heavy metal and sarcopenia prevalence: a cross-sectional study using NHANES data
Abstract
Background: Sarcopenia is a condition that adversely affects individuals' quality of life and physical health. Exposure to heavy metals poses a significant risk to human health; however, the impact of heavy metal exposure on sarcopenia remains unclear. Therefore, this study expects to construct a risk prediction machine model of heavy metal exposure on sarcopenia and to interpret and analyze it.
Methods: Model construction was based on data from the NHANES database, covering the years 2011 to 2018. The predictor variables included BA, CD, CO, CS, MN, MO, PB, SB, SN, TL, and W. Additionally, demographic characteristics and health factors were included in the study as confounders. After identifying the core variables, optimal machine learning models were constructed, and SHAP analyses were performed.
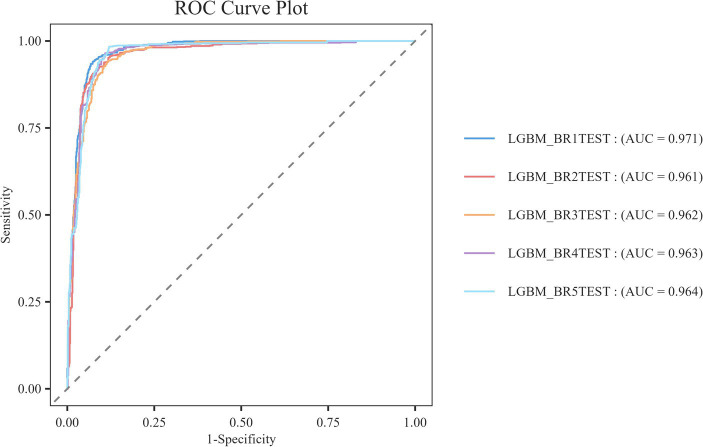
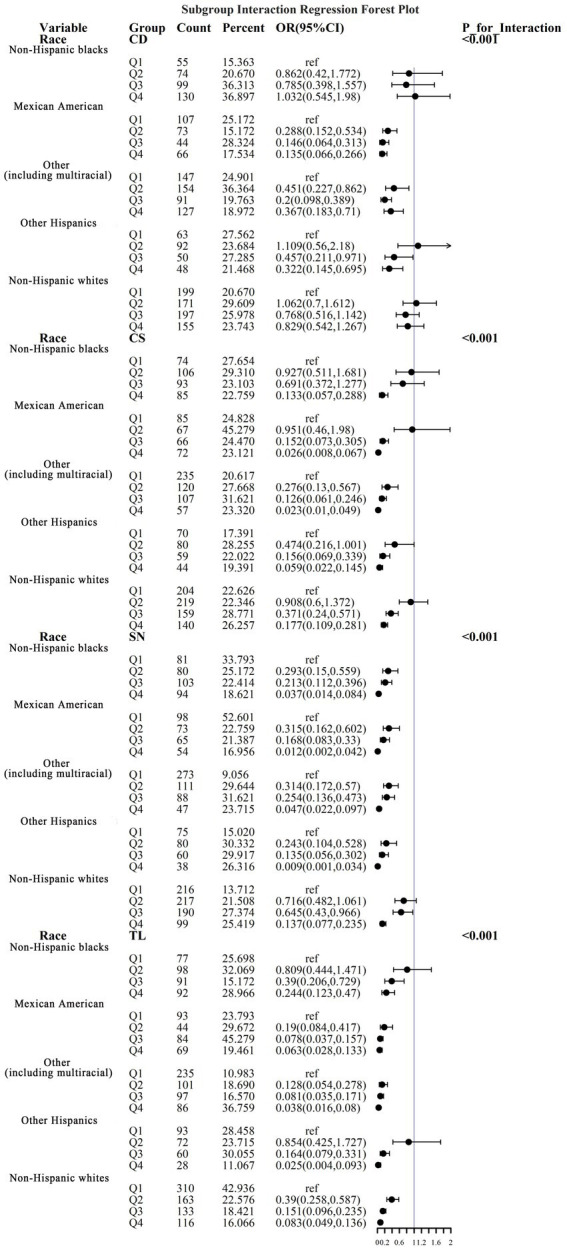
Results: We found that the LGBM model exhibited the best predictive performance. SHAP analysis revealed that TL, SN, and CS negatively influenced the prediction of sarcopenia, while CD positively contributed to it. Additionally, le8 BMI was the covariate that had the most significant positive impact on the prediction of sarcopenia in our model.
Conclusion: For the first time, we have developed a machine learning (ML) model to predict sarcopenia based on indicators of heavy metal exposure. This model has accurately identified a series of key factors that are strongly associated with sarcopenia induced by heavy metal exposure. We can now identify individuals at an early stage who are suffering from sarcopenia due to heavy metal exposure, thereby reducing the physical and economic burden on public health.
Keywords: NHANES; SHAP; heavy metal exposure; machine learning; sarcopenia.
Copyright © 2025 Zhang, Li and Wang.
Conflict of interest statement
The authors declare that the research was conducted in the absence of any commercial or financial relationships that could be construed as a potential conflict of interest.
Figures


Similar articles
-
Using Life's Essential 8 and heavy metal exposure to determine infertility risk in American women: a machine learning prediction model based on the SHAP method.Front Endocrinol (Lausanne). 2025 Jul 4;16:1586828. doi: 10.3389/fendo.2025.1586828. eCollection 2025. Front Endocrinol (Lausanne). 2025. PMID: 40687585 Free PMC article.
-
Association between exposure to blood heavy metal mixtures and overactive bladder risk among U.S. adults: a cross-sectional study.Front Public Health. 2025 Jun 4;13:1597321. doi: 10.3389/fpubh.2025.1597321. eCollection 2025. Front Public Health. 2025. PMID: 40535431 Free PMC article.
-
Association between blood heavy metal levels and COPD risk: a cross-sectional study based on NHANES data.Front Public Health. 2025 Jul 18;13:1494336. doi: 10.3389/fpubh.2025.1494336. eCollection 2025. Front Public Health. 2025. PMID: 40756396 Free PMC article.
-
Systemic pharmacological treatments for chronic plaque psoriasis: a network meta-analysis.Cochrane Database Syst Rev. 2021 Apr 19;4(4):CD011535. doi: 10.1002/14651858.CD011535.pub4. Cochrane Database Syst Rev. 2021. Update in: Cochrane Database Syst Rev. 2022 May 23;5:CD011535. doi: 10.1002/14651858.CD011535.pub5. PMID: 33871055 Free PMC article. Updated.
-
Education support services for improving school engagement and academic performance of children and adolescents with a chronic health condition.Cochrane Database Syst Rev. 2023 Feb 8;2(2):CD011538. doi: 10.1002/14651858.CD011538.pub2. Cochrane Database Syst Rev. 2023. PMID: 36752365 Free PMC article.
References
-
- Nishikawa H, Shiraki M, Hiramatsu A, Moriya K, Hino K, Nishiguchi S. Japan Society of Hepatology guidelines for sarcopenia in liver disease (1st edition): recommendation from the working group for creation of sarcopenia assessment criteria. Hepatol Res. (2016) 46:951–63. doi: 10.1111/hepr.12774, PMID: - DOI - PubMed
MeSH terms
Substances
LinkOut - more resources
Full Text Sources