. 2025;9(7):1031-1044.
doi: 10.1038/s41550-025-02552-4. Epub 2025 Jun 4.

A transiting giant planet in orbit around a 0.2-solar-mass host star

Edward M Bryant  1   2 Andrés Jordán  3   4   5 Joel D Hartman  6 Daniel Bayliss  2   7 Elyar Sedaghati  8 Khalid Barkaoui  9   10   11 Jamila Chouqar  9   12 Francisco J Pozuelos  13 Daniel P Thorngren  14 Mathilde Timmermans  9 Jose Manuel Almenara  15   16 Igor V Chilingarian  17   18 Karen A Collins  17 Tianjun Gan  19 Steve B Howell  20 Norio Narita  11   21   22 Enric Palle  11   23 Benjamin V Rackham  10   24 Amaury H M J Triaud  25 Gaspar Á Bakos  6 Rafael Brahm  3   4 Melissa J Hobson  16 Vincent Van Eylen  1 Pedro J Amado  13 Luc Arnold  26 Xavier Bonfils  15 Artem Burdanov  10 Charles Cadieux  27 Douglas A Caldwell  20   28 Victor Casanova  13 David Charbonneau  17 Catherine A Clark  29 Kevin I Collins  30 Tansu Daylan  31   32 Georgina Dransfield  25 Brice-Olivier Demory  33 Elsa Ducrot  34   35 Gareb Fernández-Rodríguez  11   23 Izuru Fukuda  36 Akihiko Fukui  11   21 Michaël Gillon  9 Rebecca Gore  20   37 Matthew J Hooton  38 Kai Ikuta  36 Emmanuel Jehin  39 Jon M Jenkins  20 Alan M Levine  40 Colin Littlefield  20   37 Felipe Murgas  11   23 Kendra Nguyen  41 Hannu Parviainen  11   23 Didier Queloz  38   42 S Seager  40   43   44 Daniel Sebastian  25 Gregor Srdoc  45 R Vanderspek  40 Joshua N Winn  6 Julien de Wit  10   24 Sebastián Zúñiga-Fernández  9
Affiliations

A transiting giant planet in orbit around a 0.2-solar-mass host star

Edward M Bryant et al. Nat Astron. 2025.

Abstract

Planet formation models indicate that the formation of giant planets is substantially harder around low-mass stars due to the scaling of protoplanetary disc masses with stellar mass. The discovery of giant planets orbiting such low-mass stars thus imposes strong constraints on giant planet formation processes. Here we report the discovery of a transiting giant planet orbiting a 0.207 ± 0.011 M star. The planet, TOI-6894 b, has a mass and radius of M P = 0.168 ± 0.022 M J (53.4 ± 7.1 M ) and R P = 0.855 ± 0.022 R J and probably includes 12 ± 2 M of metals. The discovery of TOI-6894 b highlights the need for a better understanding of giant planet formation mechanisms and the protoplanetary disc environments in which they occur. The extremely deep transits (17% depth) make TOI-6894 b one of the most accessible exoplanetary giants for atmospheric characterization observations, which will be key for fully interpreting the formation history of this notable system and for the study of atmospheric methane chemistry.

Keywords: Exoplanets; Giant planets.


Conflict of interest statement

Competing interestsThe authors declare no competing interests.

Figures

Fig. 1
Fig. 1. Transit light curves and RV data for TOI-6894 b.
a, Phase-folded TESS photometric data at a cadence of 30 min (left), 10 min (middle) and 2 min (right) (blue points). b, Phase-folded RV data from ESPRESSO (orange triangles) and SPIRou (cyan squares). c, Selected ground-based follow-up photometric data. The panel annotations give the night on which the observations were taken, the facility that performed the observations (Europa and Ganymede are two SPECULOOS-South nodes) and the observing filter used. The best-fitting models obtained from the analysis in this work (Methods) are plotted as the black line in all panels. For all panels, the error bars are the reported uncertainties for each data point and the grey shaded regions give the 1σ uncertainty on the model. The error bars in the bottom right corners of the four panels in c denote the median error bar for the plotted observation. Note that all follow-up photometry, including the observations not plotted here, was included in the analysis. All follow-up photometry is plotted in Extended Data Fig. 1.
Fig. 2
Fig. 2. Placing TOI-6894 b in the context of known transiting planets.
a, Masses (MPl) or minimum masses (MPlsini where i denotes the orbital inclination) of the known population of planets discovered through the transit or RV method as a function of mass of the host star (data taken from the NASA Exoplanet Archive, accessed 16 May 2024). We plot transiting planets for which we have an absolute mass measurement as blue circles and non-transiting RV planets for which we have just a lower limit on the mass as the grey triangles. TOI-6894 b is plotted as the purple circle. The planets mentioned in the text and the transiting giant planets around mid M-dwarf stars are labelled for reference. The error bars are the 1σ uncertainty ranges on the plotted parameters. b, The same sample but showing the planet radii.
Fig. 3
Fig. 3. Atmospheric characterization potential of TOI-6894 b.
TSM of known giant planets as a function of the planetary equilibrium temperature. The TSM (see ref. for details) is an estimate of the expected S/N for transmission spectroscopy observations. The colour of the points denotes the effective temperature of the host star. The star symbol denotes TOI-6894 b. The values and error bars for the known population were calculated from the values provided in the NASA Exoplanet Archive. We highlight three known transiting giant planets with mid-M-dwarf host stars with the blue circles and arrows.
Extended Data Fig. 1
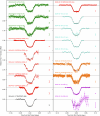
Extended Data Fig. 1. Ground-based light curve transit observations for TOI-6894 b.
Each light curve is plotted individually and all light curves are offset from one another for clarity. The labels of each light curve give the date on which the observations were performed and the filter used for the observations. The different colours and markers denote the telescope used to obtain the observations: ExTrA (green triangles); SPECULOOS (red circles); TRAPPIST (black points); LCO (cyan squares); MUSCAT2 (orange crosses); OSN (purple diamonds). The the gray shaded regions provide the 1σ confidence region for the transit models. The errorbars provided are the reported uncertainties for all light curves except the MuSCAT2 data, for which the reported uncertainties were over-estimated and so we plot the rescaled uncertainties (see Methods) for clarity. For some observations the uncertainties are too small to be seen, and so we provide the median uncertainty for all observations as the errorbars plotted to the right of the corresponding observations.
Extended Data Fig. 2
Extended Data Fig. 2. Individual RP/R* values obtained from transit fit analyses performed for each TESS sector and each individual ground-based transit light curve obtained.
The x-axis plots the reference wavelength for each filter used. Where more than one result uses the same filter the points are offset slightly in the x-direction for clarity. The y-axis errorbars give the 1σ uncertainty from the transit analysis and the x-axis errorbars show the FWHM of the observing filter used. The upper axis shows the reference wavelengths for some of the filters used. The data point markers and colours are the same as for Extended Data Fig. 1, with the addition of the pink downward triangles for the TESS results. The solid black line and shaded grey region give the best fit RP/R* value and 1σ uncertainty from the global analysis.
Extended Data Fig. 3
Extended Data Fig. 3. Observations to check for signs of blended companions.
Left: The R-band 1-hour exposure time DSS image from the 48-Inch Palomar telescope observed in 1952 January 31. TOI-6894 is the star at the center of the image. The current sky location from Gaia DR3 is shown with a red circle. No background source is detected to the limit of the DSS plate (G = 19.5). Right: Contrast curves obtained using the ‘Alopeke speckle imager at Gemini North. The inset shows the obtained speckle image.
Extended Data Fig. 4
Extended Data Fig. 4. Checking for a secondary eclipse of TOI-6894 b.
SPECULOOS observations taken during the prediction time of a secondary eclipse, with the error bars showing the reported photometric uncertainties. The gray shaded region gives the 1σ window for the estimated time of the occultation, accounting for the eccentricity posterior distribution. No significant secondary eclipse is observed.
Extended Data Fig. 5
Extended Data Fig. 5. Magellan/FIRE spectrum of TOI-6894.
The target spectrum (blue) is shown along with the spectrum of the best-fit M5 standard (grey). Regions of strong telluric absorption are shaded in grey, and prominent atomic and molecular features of M dwarfs are highlighted.
Extended Data Fig. 6
Extended Data Fig. 6. Radial velocity time series for TOI-6894.
The ESPRESSO data is plotted in the left panel and the SPIRou data in the right, and the systemic radial velocity values (see Extended Data Table 2) have been subtracted from the respective radial velocity time series. The errorbars provided the 1σ radial velocity uncertainties yielded by the reduction pipelines. The symbols, colours, and model lines are the same as presented in Fig. 1b.
Extended Data Fig. 7
Extended Data Fig. 7. Transmission spectroscopy metric (TSM) as a function of host star mass for transiting exoplanets with mass measurements.
Data and uncertainties are extracted from the NASA Exoplanet Archive, with the errorbars showing the reported 1σ uncertainties on each parameter. The points are coloured according to their planetary equilibrium temperature. The size of the points scale with the planetary radius. TOI-6894 b is highlighted by the magenta circle. We also highlight transiting giant and sub-giant planets with mid-M-dwarf host stars with the blue circles and arrows and other planets with high TSM already observed and/or scheduled on JWST with the black circles.
Extended Data Fig. 8
Extended Data Fig. 8. PandExo simulated transmission spectra of TOI-6894 b.
Left: Clear and cloudy transmission spectra models assuming solar abundance are shown as solid lines. Right: Clear and cloudy models with the carbon-to-oxygen ratio enhanced by a factor of two. PandExo simulated observations with 1 transit for JWST NIRISS-SOSS, NIRSpec-G395M, and MIRI-LRS modes are also depicted, with their wavelength coverage indicated by coloured solid lines. The errorbars for both panels provide the estimated 1σ measurement uncertainties provided by PandExo.

References

    1. Laughlin, G., Bodenheimer, P. & Adams, F. C. The core accretion model predicts few Jovian-mass planets orbiting red dwarfs. Astrophys. J. Lett.612, L73–L76 (2004).
    1. Burn, R. et al. The New Generation Planetary Population Synthesis (NGPPS). IV. Planetary systems around low-mass stars. Astron. Astrophys.656, A72 (2021).
    1. Pascucci, I. et al. A steeper than linear disk mass-stellar mass scaling relation. Astrophys. J.831, 125 (2016).
    1. Manara, C. F. et al. in Protostars and Planets VII (eds Inutsuka, S. et al.) 539–565 (ASP, 2023).
    1. Ida, S. & Lin, D. N. C. Toward a deterministic model of planetary formation. III. Mass distribution of short-period planets around stars of various masses. Astrophys. J.626, 1045–1060 (2005).