

Exclusive lactation is associated with improved lipid profile postpartum
- PMID: 40689044
- PMCID: PMC12272454
- DOI: 10.1016/j.ahjo.2025.100573
Exclusive lactation is associated with improved lipid profile postpartum
Abstract
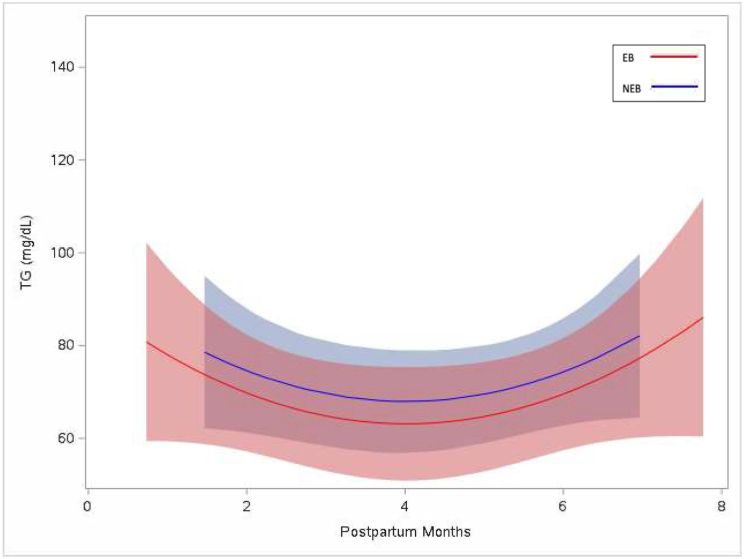
Study objective: Lactation is theorized to improve maternal metabolism. However, there is limited data comparing maternal lipids in the first six months postpartum by lactation exclusivity. Thus, we investigated trends in maternal lipids and body mass index (BMI) among women practicing exclusive breastfeeding (EB) vs. non-exclusively breastfeeding (NEB).
Design: Participants were followed at up to 3 different time points in the first six to seven months postpartum. Questionnaires, biochemical analyses of lipids, and anthropometric measurements were obtained at each visit. A mixed model with inverse probability weighting was used to analyze the data.
Setting: Obstetrics clinics and home visits.
Participants: Healthy postpartum women who gave birth to term infants.
Main outcome measures: Plasma lipid profiles, including total cholesterol, high-density lipoprotein cholesterol, low-density lipoprotein cholesterol, triglyceride, and BMI.
Results and conclusions: A total of 94 women were studied; 22 % identified as Hispanic, 15 % identified as Black/African American, and 69 % identified as non-Hispanic White. Low-density lipoprotein-c and total cholesterol quadratic trends were lower in the EB group compared to the NEB group (p = 0.0147 and p = 0.0012). High-density lipoprotein-c displayed a quadratic trend over time in both groups (p = 0.0002). However, the quadratic trend did not vary between the groups. A difference in linear trends was noted in BMI when comparing EB and NEB groups, with lower BMI by the last visit in the EB group (p = 0.0133). Thus, EB for the first six months postpartum is associated with lower lipids and BMI.
Keywords: Cardiometabolic health; Cardiovascular risk; Exclusive breastfeeding; Lactation; Lipid profile; Non-exclusive lactation.
Conflict of interest statement
The author(s) report(s) no conflict of interest. C.J. Pepine: Consultant Fees/Honoraria: BioCardia Inc., Elsevier, Sanofi-Aventis, and XyloCor Therapeutics Inc. Research/Research Grants: BioCardia Inc., Department of Defense-Congressionally Directed Medical Research Programs (CDMRP) [WARRIOR] and -Peer Reviewed Medical Research Program (PRMRP) [QUIET WARRIOR], Gatorade Trust through the University of Florida Department of Medicine, GE Healthcare, McJunkin Family Foundation Trust, National Institutes of Health/National Heart, Lung and Blood Institute (NIH/NHLBI), NIH/National Institute on Aging (NIA), Sanofi- Aventis and XyloCor Therapeutics.
Figures


References
-
- Lippi G., Albiero A., Montagnana M., et al. Lipid and lipoprotein profile in physiological pregnancy. Clin. Lab. 2007;53(3–4):173–177. https://www.ncbi.nlm.nih.gov/pubmed/17447654 - PubMed
LinkOut - more resources
Full Text Sources
