

Regional variations and trends in liver transplantation practices across Europe
- PMID: 40689148
- PMCID: PMC12276449
- DOI: 10.1016/j.jhepr.2025.101424
Regional variations and trends in liver transplantation practices across Europe
Abstract
Background & aims: Liver transplantation (LT) is a live-saving therapy for patients with end-stage liver disease, but demand exceeds supply, leading to waiting list (WL) mortality. This study reviews LT practices and trends in Europe to identify potential policies for improving outcomes.
Methods: Data were extracted from the European Liver Transplant Registry and the Global Observatory on Donation and Transplantation. Countries were categorized into Eastern (EEC), Mediterranean (MEC), and Northern European (NEC). We analyzed LT indications, recipient and donor age, transplant type, and WL outcomes from 2012 to 2022.
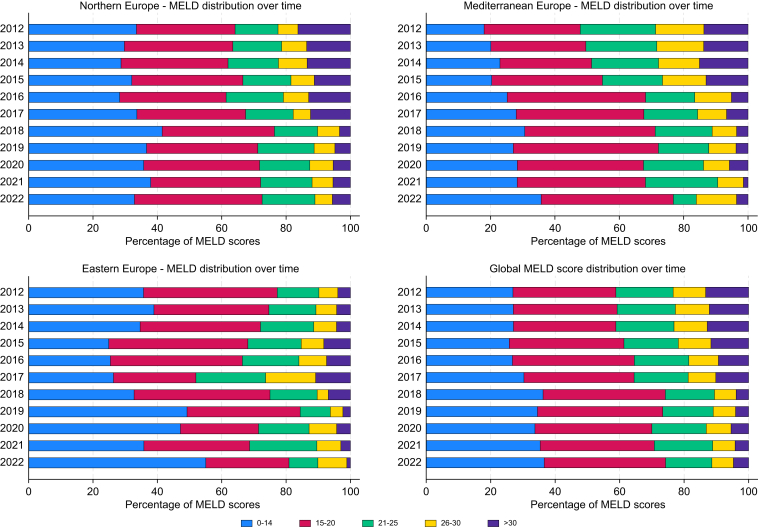
Results: Etiology of LT differed across regions: HBV cirrhosis predominated in EEC (37.3%), whereas alcohol-related liver disease was more frequent in NEC (41.8%) and MEC (49.1%). Metabolic-dysfunction associated steatotic liver disease increased across Europe, particularly in NEC. Recipient age has risen, with 40% aged ≥60 years in MEC vs. 20% in EEC. Donor age and type also varied: EEC relies on younger donors (<50 years, 70%), whereas MEC expanded criteria to include donors ≥60 years (50%). Donation after circulatory determination of death increased by 30%, particularly in NEC and MEC, but remains rare in EEC. Model for end-stage liver disease scores at LT decreased, with 30% scoring >21 in 2021 vs. 50% in 2012. WL mortality declined by 10% since 2015, although large inter-country variability persists.
Conclusions: LT practices in Europe are highly heterogeneous. Regional disparities in recipient profiles, donor characteristics, and transplant modalities reflect varying policies and healthcare capacities. Expanding donor criteria and harmonizing allocation systems are required to reduce WL mortality and improve access to LT across Europe.
Impact and implications: This study provides a comprehensive analysis of liver transplantation practices across Europe, highlighting significant regional disparities in donor criteria, allocation systems, and transplant outcomes. By identifying trends such as the expansion of Donation after Circulatory Determination of Death programs and the prioritization of model for end-stage liver disease ≥30 policies, these findings underscore the critical need for harmonized strategies to reduce waiting list mortality and improve access to transplantation. The results are particularly relevant for policymakers and healthcare administrators seeking to optimize liver transplant systems, and for clinicians aiming to adopt best practices from high-performing regions. Practical applications include refining allocation policies, expanding donor pools, and addressing regional inequalities, all while considering the limitations posed by diverse healthcare infrastructures and socioeconomic factors.
Keywords: Alcohol-related liver disease; Metabolically associated steatohepatitis; Organ allocation; Waiting list mortality.
© 2025 The Authors.
Conflict of interest statement
The authors declare no conflicts of interest that pertain to this work. Please refer to the accompanying ICMJE disclosure forms for further details.
Figures


References
-
- Terrault N.A., Francoz C., Berenguer M., et al. Liver transplantation 2023: status report, current and future challenges. Clin Gastroenterol Hepatol. 2023;21:2150–2166. - PubMed
-
- Tejedor M., Selzner N., Berenguer M. Are MELD and MELDNa still reliable tools to predict mortality on the liver transplant waiting list? Transplantation. 2022;106:2122–2136. - PubMed
-
- Devarbhavi H., Asrani S.K., Arab J.P., et al. Global burden of liver disease: 2023 update. J Hepatol. 2023;79:516–537. - PubMed
-
- Rela M., Rammohan A. Why are there so many liver transplants from living donors in Asia and so few in Europe and the US? J Hepatol. 2021;75:975–980. - PubMed
-
- Belli L.S., Duvoux C., Berenguer M., et al. ELITA consensus statements on the use of DAAs in liver transplant candidates and recipients. J Hepatol. 2017;67:585–602. - PubMed
LinkOut - more resources
Full Text Sources
