. 2025 Aug 1;152(15):dev204572.
doi: 10.1242/dev.204572. Epub 2025 Aug 7.

The cell-adhesion molecule Echinoid promotes tissue survival and separately restricts tissue overgrowth

Affiliations

The cell-adhesion molecule Echinoid promotes tissue survival and separately restricts tissue overgrowth

Danielle C Spitzer et al. Development. .

Abstract

The growth and survival of cells depends both on their intrinsic properties and interactions with their neighbors. In a screen of genes encoding cell-surface proteins for knockdowns that affect clone size or shape in mosaic Drosophila imaginal discs, we found that clones with reduced echinoid (ed) function are fewer and smaller, and are frequently eliminated during development. This elimination results, in significant part, from increased levels of apoptosis due to decreased Diap1 protein. We found that Hippo pathway activity is not decreased in ed mutant cells, as previously claimed, but is decreased in some of their immediate wild-type neighbors, consistent with the observed elimination of ed clones by a mechanism resembling cell competition. In contrast to the underrepresentation of ed clones, discs or compartments composed of mostly ed mutant tissue overgrow, despite having increased levels of apoptosis. The overgrowth results from a failure to arrest growth at the appropriate final size during an extended larval stage. Thus, ed has two distinct functions: an anti-apoptotic function via maintenance of Diap1 levels, and a function to arrest growth at the appropriate final size.

Keywords: Adhesion; Cell competition; Echinoid; Growth; Hippo.


Conflict of interest statement

Competing interests The authors declare no competing or financial interests.

Figures

Fig. 1.
Fig. 1.
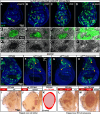
Clonal phenotypes observed in RNAi screen. (A) Summary of the screen. (B-L′) Phenotypes of imaginal discs containing clones generated with a FLP-out Gal4 and UAS-RNAi transgenes. Clones are marked by GFP or RFP, as indicated. A cyst-like clone in K is shown at higher magnification in L and an orthogonal view is provided in L′. Scale bar in B applies to B-K. Scale bar in L applies to L,L′.
Fig. 2.
Fig. 2.
Clones of echinoid mutant cells are eliminated when surrounded by wild-type cells. (A-D) Imaginal discs containing GFP-marked ed-RNAi clones. Four different UAS-ed-RNAi transgenes were used. (A′-D″) Clones stained with an anti-Ed antibody (outlined in A-D) at higher magnification. (E-H) Clones that are homozygous for the chromosome arm bearing FRT40A alone (E) or FRT40A and an allele of ed (F-H) generated using the MARCM method (Lee and Luo, 1999). Homozygous mutant clones are positively marked with GFP. Note the near absence of clones in the epithelium with the two null ed alleles (F,G) and the presence of myoblast clones underlying the notum (arrowheads in F-H). An orthogonal view is shown in F′ with the disc epithelium outlined; the GFP-marked myoblasts are located basal to the epithelium. The A/B double-headed arrow in F′ indicates apicobasal orientation of the wing disc proper epithelium. Both epithelial and myoblast clones are observed with the hypomorphic allele (H). (I-K) Clones homozygous for either a wild-type chromosome arm distal to FTR40A (I) or edIF20, FRT40A (J), marked white, generated using eyFLP. The tester chromosome carries a recessive cell lethal allele l(2)cl-L31, resulting in the absence of wild-type twin spots when homozygous. (K) An overlay of the overgrown eye containing ed clones and the normally sized eye containing wild-type clones. (L,M) Clones generated using eyFLP using a wild-type tester chromosome that does not carry a recessive cell lethal mutation. FRT40A clones (L) and edIF20 FRT40A clones (M) are white, while the wild-type twin spots appear red. Note the almost complete absence of homozygous ed/ed tissue in eyes that contain wild-type twin spots.
Fig. 3.
Fig. 3.
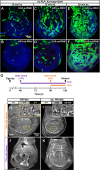
echinoid clones are generated and then die, especially when more wild-type tissue is present. (A-F) Wing discs containing GFP-marked clones expressing either UAS-w-RNAi (A,C,E) or UAS-ed-RNAi (B,D,F). Heat shocks of 12 min (A,B), 15 min (C,D) and 30 min (E,F) generate clones at progressively higher density. (G-K) An experiment to examine ed/ed clones 24 h and 72 h after generation by mitotic recombination. The design of the experiment is shown in G. Discs were dissected 120 h AEL and clones were induced either 24 h (H,I) or 72 h (J,K) before dissection. Clones generated using the FRT40A chromosome (H,J) are compared to clones homozygous for edIF20 (I,K). The outlined areas are shown in the insets. Scale bar in H applies to H-K. Scale bar in A applies to A-F.
Fig. 4.
Fig. 4.
echinoid mutant tissue has higher apoptosis levels and lower Diap1 levels. (A-D) Wing discs containing GFP-marked clones that express either UAS-w-RNAi (A,B) or UAS-ed-RNAi (C,D). Clones that also express UAS-p35 are shown in B,D. (E-F′) Imaginal discs containing GFP-marked clones expressing UAS-w-RNAi (E) or UAS-ed-RNAi (high clone density) (F). Anti-Dcp-1 staining of the same discs are shown in E′,F′. Images were taken at a basal z-plane where Dcp-1 staining was most prominent. Arrowheads in F,F′ highlight examples of anti-Dcp1 staining near clone boundaries. (G-H′) Discs expressing UAS-ed-RNAi alone (low clone density) (G) or both UAS-ed-RNAi and UAS-diap1 in GFP-marked clones, stained with anti-Diap1 (G′,H′). Arrowheads in G,G′ show the location of clones where reduced Diap1 is apparent. ‘Rescued’ clones (H,H′) still have smooth borders.
Fig. 5.
Fig. 5.
Hippo pathway reporters are altered in and around echinoid clones. (A,A′) RFP-marked (A) ed-RNAi clone shows decreased expression of a diap1 transcriptional reporter generated using eight copies of the Hippo-response element (HRE) from the diap1 locus (A′). (B,B′) GFP-marked (B) ed-RNAi clones stained with anti-Diap1 (B′). (C,C′) RFP-labeled (C) ed-RNAi clone shows decreased fj-lacZ expression (C′). Wild-type cells adjacent to the clone show increased fj-lacZ expression. (D,D′) GFP-labeled (D) ed-RNAi clone shows decreased ban-lacZ expression (D′). Wild-type cells adjacent to the clone show increased ban-lacZ expression. (E-E‴) RFP-labeled (E,E′) ed-RNAi clones show no obvious alteration in the localization of either GFP-tagged Yki (E″) or anti-Yki staining (E‴). The region shown at higher magnification in E′-E‴ is outlined in E. (F,F′) GFP-marked (F) ed-RNAi clones stained with an anti-Ft antibody (F′). The inset shows a higher magnification of the boundary of the clone. F and F′ show different z-planes of the same image because the Ft signal is located at a z-plane with weak GFP signal. Scale bar in A applies to A-D′. Scale bar in F' (inset) is 5 µm.
Fig. 6.
Fig. 6.
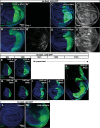
Characteristics of discs with compartment-wide echinoid loss. (A-D′) Effect of reducing ed function in the posterior compartment on apoptosis and Diap1. (A-B′) hh-Gal4 drives expression of UAS-GFP (A,A′) or UAS-GFP and UAS-ed-RNAi (B,B′). Apoptotic cells are visualized with anti-Dcp1 (A′,B′). (C-D′) Discs expressing w-RNAi (C) or ed-RNAi (D) in the entire posterior compartment stained with anti-Diap1 (C′,D′). Scale bar in A applies to A-D′. (E-K) Time course of growth of imaginal discs expressing either w-RNAi (E,F) or ed-RNAi (G-K) in the GFP-marked posterior compartment. All larvae expressing w-RNAi pupariated soon after 120 h. Much older larvae were observed in the population expressing ed-RNAi; examples of discs from these larvae are shown. Scale bar in E applies to E-K. (L,M) Effect of reducing ed function in the posterior compartment on Ilp8 expression. hh-Gal4, Ilp8-GFP (L) discs do not express detectable levels of Ilp8-GFP, but when hh-Gal4 drives expression of ed-RNAi (M), Ilp8-GFP is elevated in a pattern that coincides with the expected location of the unmarked posterior compartment. Scale bar in L applies to L,M.
Fig. 7.
Fig. 7.
Reduced echinoid function increases adult wing size. (A-I) Effect of reducing ed function on adult wing size. (A-H′) Adult wings of the indicated genotypes. (D′) Overlay of A and D. (F′) Overlay of E and F. (H′) Overlay of G and H. Quantification of wing areas is shown in I. n=10 wings [+/+ (Oregon-R); edsIH8/+; edIF20/+; edsIH8/edIF20; nub-Gal4, >GFP, >w-RNAi], 9 wings (nub-Gal4, >GFP, >ed-RNAi; rn-Gal4) and 19 wings (rn-Gal4, >ed-RNAi). ns indicates P>0.05, **P<0.01 (one-way ANOVA with post-hoc Tukey's HSD test). For box and whisker plots, the horizontal line is the median, the box is the interquartile range and the whiskers extend to the largest (upper whisker) or smallest (lower whisker) value that is no further from the hinge than 1.5× inter-quartile range. (J,K) Effect of overexpressing ed on adult wing size. Overexpression using either nub-Gal (J) or rn-Gal4 (K) dramatically reduced wing size. Scale bar in A applies to A-H′,J,K.
Fig. 8.
Fig. 8.
Model summary of phenotypes caused by Echinoid loss and proposed mechanisms. (A,A′) Clones of echinoid mutant cells are eliminated from mosaic tissues. Ed-depleted cells have decreased Diap1 expression, which predisposes them to death by apoptosis, and increased apical Ft. In the wild-type neighbors bordering the ed clones, levels of Yki targets, including Diap1, bantam and four-jointed, are elevated. This may confer a competitive advantage to the wild-type neighbors, which could facilitate the elimination of ed clones from mosaic tissue (A′). (B,B′) When ed mutant tissue is abundant (e.g. in an entire organ), mutant cells persist and the resulting organs overgrow. This overgrowth is facilitated by Ilp8 secretion, which delays pupariation. Slow-growing ed mutant tissue fails to arrest at the proper final size, leading to overgrown organs (B′).

Update of

References

    1. Adachi-Yamada, T. and O'Connor, M. B. (2002). Morphogenetic apoptosis: a mechanism for correcting discontinuities in morphogen gradients. Dev. Biol. 251, 74-90. 10.1006/dbio.2002.0821 - DOI - PubMed
    1. Adachi-Yamada, T., Harumoto, T., Sakurai, K., Ueda, R., Saigo, K., O'Connor, M. B. and Nakato, H. (2005). Wing-to-leg homeosis by spineless causes apoptosis regulated by FISH-lips, a novel leucine-rich repeat transmembrane protein. Mol. Cell. Biol. 25, 3140-3150. 10.1128/MCB.25.8.3140-3150.2005 - DOI - PMC - PubMed
    1. Ahmed, A., Chandra, S., Magarinos, M. and Vaessin, H. (2003). echinoid mutants exhibit neurogenic phenotypes and show synergistic interactions with the Notch signaling pathway. Development 130, 6295-6304. 10.1242/dev.00796 - DOI - PubMed
    1. Akai, N., Ohsawa, S., Sando, Y. and Igaki, T. (2021). Epithelial cell-turnover ensures robust coordination of tissue growth in Drosophila ribosomal protein mutants. PLoS Genet. 17, e1009300. 10.1371/journal.pgen.1009300 - DOI - PMC - PubMed
    1. Alpar, L., Bergantiños, C. and Johnston, L. A. (2018). Spatially restricted regulation of Spätzle/Toll signaling during cell competition. Dev. Cell 46, 706-719.e5. 10.1016/j.devcel.2018.08.001 - DOI - PMC - PubMed

MeSH terms

Substances

LinkOut - more resources