. 2025 Aug 5;45(8):tpaf087.
doi: 10.1093/treephys/tpaf087.

Characterizing genetic adaptations and plastic stress responses within a transcontinental North American keystone species

Affiliations

Characterizing genetic adaptations and plastic stress responses within a transcontinental North American keystone species

Roos Goessen et al. Tree Physiol. .

Abstract

Local adaptation can lead to the intraspecific variation in a species' genetic makeup, shaping both its physiological and morphological traits as well as its molecular responses. In this study, we assessed variation in key functional leaf traits, such as stomata density, carbon and nitrogen content, cuticular wax composition and leaf shapes, within the transcontinental North American Populus tremuloides Michaux (quaking aspen) by sampling individuals from its four major genetic lineages. We also performed a small-scale common garden experiment with imposed higher temperature and drought stress during which we sampled for transcriptomes using RNAseq and performed physiological measurements to obtain insights into the intraspecific responses among aspen lineages to such abiotic stressors. Our findings revealed several differences in functional traits indicative of local adaptation, such as variation in cuticular wax content, petiole lengths and δ13C. Notably, stomatal density was significantly associated with mean annual precipitation. Moreover, genotypes from the most southern lineage (Mexico) exhibited the largest decline in net photosynthesis under drought, suggesting a more conservative water-use strategy. Gene expression analyses revealed numerous differentially expressed genes under different stress conditions and in different lineages, with overlaps with previous gene selection scans, confirming their possible roles in local adaptation. Weighted gene co-expression network analysis further identified 22 co-expressed gene modules, several of which strongly associated with temperature responses and geographic origin of genetic lineage. Our findings highlight substantial intraspecific variation in functional traits and gene expression patterns in P. tremuloides linked to geographical origin and local environmental conditions. Understanding such adaptive variation is crucial for predicting how forest trees may cope with and adapt to the challenges of climate change.

Keywords: abiotic stress; cuticular wax; physiology; quaking aspen; stomata; transcriptome.


Conflict of interest statement

None declared.

Figures
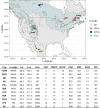
Figure 1
Figure 1
Distribution of populations and climatic variables for natural sites of populations (pop) utilized in experiments. Lineage indicates the genetic lineage to which each population belongs, as identified by Goessen et al. (2022), i.e. northeast North America (NENA), northwest North America (NWNA), western US (WUS) and Mexico (MX). Individuals from the NWNA lineage were only included in the constitutive trait assessments and not in the drought and temperature experiment. Climate variables were extracted from the ClimateNA database (Wang et al., 2016), i.e., mean annual temperature (°C) (MAT), mean warmest month temperature (°C) (MWMT), mean coldest month temperature (°C) (MCMT), mean annual precipitation (mm) (MAP), May to September precipitation (mm) (MSP), annual heat-moisture index (MAT+10)/(MAP/1000)) (AHM), frost-free period (FFP).
Figure 2
Figure 2
Overview of measured constitutive leaf traits.
Figure 3
Figure 3
Schematic overview of drought and temperature experiment, including timeline with indication of sample timepoints T1, T2 and T3. The upper figure indicates the growth chamber with a day temperature of 32 °C, and the lower figure indicates the growth chamber with a day temperature of 22 °C. Information in the left boxes indicate the temperature for day and night in Celsius (°C), followed by the photoperiod (16 hours light (L) and 8 hours dark (D)), and the total number of plants. Purple circles indicate the approximate timing of physiology and water potential measurements. Plants were kept at 90% FC for two weeks during the acclimation period, hereafter FC was lowered to 40% for drought-treated plants while kept at 90% for control plants. At T2 and T3, the FC was increased to 90% again.
Figure 4
Figure 4
Relationships of number of stomata per mm2 with genetic lineages and climate. A. Stomatal density for each of the four genetic lineages northeast North America (NENA), northwest North America (NWNA), western US (WUS), and Mexico (MX). Boxplot includes one to three leaves per tested individual, with the value of each leaf consists of the average of three photos. Letters indicate significance results from Tukey test of one-way ANOVA with genetic lineage as explanatory variable (P < 0.05). B. Linear regression results between stomatal density and mean annual precipitation (mm) at sites of origin (adjusted R2 = 0.24).
Figure 5
Figure 5
Clustered heatmap of major leaf wax groups for 30 individuals from the genetic lineages MX, WUS, NWNA and NENA. MAG indicates monoacylglycerols; AHC indicates alkyl hydroxycinnamates. For a heatmap with all individual leaf wax compounds see Figure S10.
Figure 6
Figure 6
Boxplots of physiological measurements during drought and temperature experiment for the genetic lineages NENA, WUS and MX. For A-E: Dark blue indicates 22 °C and well watered, green indicates 22 °C and drought, yellow indicates 32 °C and well watered, orange indicates 32 °C and drought. A. Net photosynthesis (ANET). B. Stomatal conductance (gsw). C. Water use efficiency (WUE). D. Dark respiration (R). E. Fv/Fm. F. Specific leaf area (SLA) in mm2/mg of leaves tested for physiological traits.
Figure 7
Figure 7
WGCNA dendrogram resulting in 23 modules with sizes ranging from 73 to 4816. A. WGCNA dendrogram. B. Number of genes per identified co-expressed module, with grey encompassing non-assigned genes (n = 9241). C. Module eigengene (ME) and treatment relationships using correlation and including P-values in brackets.
Figure 8
Figure 8
Module eigengenes with highest treatment correlations (see Figure 7C) plotted for temperature (A), watering scheme (B) and lineage (C). With on the x-axis individual genotypes and on the y-axis the module eigengene values. A. Eigengenes for modules M_black, M_yellow, M_tan, M_magenta, M_pink and M_lightgreen that had a significant correlation above 0.6 with temperature treatment (22 vs 32 °C). B. Eigengenes for modules red and turquoise that had a significant correlation above 0.3 with watering scheme (Drought, re-watered after drought and control). Moreover, we visualized module M_blue and M_brown due to their overrepresented GO-terms related to watering stress C. Eigengene for module M_cyan that had a significant correlation of 0.68 with lineage (northeast North America (NENA), western US (WUS) and Mexico (MX)). Moreover, we visualized the M_black module eigengene for cluster (correlation of 0.35) as this eigengene also had high correlation with temperature.
Figure 9
Figure 9
Most significant shared GO terms (top five) between modules M_blue, M_brown, M_yellow, M_black, M_magenta and M_turquoise. The M_blue and M_turquoise modules displayed significant correlation with watering scheme. The M_brown, M_yellow, M_black, and M_magenta modules displayed significant correlation with temperature conditions. The M_black module also displayed a significant correlation with genetic lineage.

References

    1. Adams WW, Stewart JJ, Cohu CM, Muller O, Demmig-Adams B (2016) Habitat temperature and precipitation of Arabidopsis thaliana ecotypes determine the response of foliar vasculature, photosynthesis, and transpiration to growth temperature. Front Plant Sci 7:1–18. 10.3389/fpls.2016.01026. - DOI - PMC - PubMed
    1. Allen BL, Taatjes DJ (2015) The mediator complex: a central integrator of transcription. Nat Rev Mol Cell Biol 16:155–166. 10.1038/nrm3951. - DOI - PMC - PubMed
    1. Aubin I, Munson AD, Cardou F et al. (2016) Traits to stay, traits to move: a review of functional traits to assess sensitivity and adaptive capacity of temperate and boreal trees to climate change. Environ Rev 24:164–186. 10.1139/er-2015-0072. - DOI
    1. Benjamini Y, Hochberg Y (1995) Controlling the false discovery rate: a practical and powerful approach to multiple testing. J R Stat Soc 57:289–300. 10.1111/j.2517-6161.1995.tb02031.x. - DOI
    1. Bertolino LT, Caine RS, Gray JE (2019) Impact of stomatal density and morphology on water-use efficiency in a changing world. Front Plant Sci 10:1–11. 10.3389/fpls.2019.00225. - DOI - PMC - PubMed