. 2025 Sep 1;224(9):e202505040.
doi: 10.1083/jcb.202505040. Epub 2025 Jul 21.

Protein Kinase C promotes peroxisome biogenesis and peroxisome-endoplasmic reticulum interaction

Affiliations

Protein Kinase C promotes peroxisome biogenesis and peroxisome-endoplasmic reticulum interaction

Anya Borisyuk et al. J Cell Biol. .

Abstract

Peroxisomes carry out a diverse set of metabolic functions, including oxidation of very long-chain fatty acids, degradation of D-amino acids and hydrogen peroxide, and bile acid production. Many of these functions are upregulated on demand; therefore, cells control peroxisome abundance, and by extension peroxisome function, in response to environmental and developmental cues. The mechanisms upregulating peroxisomes in mammalian cells have remained unclear. Here, we identify a signaling regulatory network that coordinates cellular demand for peroxisomes and peroxisome abundance by regulating peroxisome proliferation and interaction with ER. We show that PKC promotes peroxisome PEX11b-dependent formation. PKC activation leads to an increase in peroxisome-ER contact site formation through inactivation of GSK3β. We show that removal of VAPA and VAPB impairs peroxisome biogenesis and PKC regulation. During neuronal differentiation, active PKC leads to a significant increase in peroxisome formation. We propose that peroxisomal regulation by transient PKC activation enables fine-tuned responses to the need for peroxisomal activity.


Conflict of interest statement

Disclosures: The authors declare no competing interests exist.

Figures

Figure 1.
Figure 1.
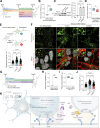
Kinase inhibitor screen reveals signaling regulators of peroxisome abundance. (A) Western blot of WT and CRISPR/Cas9 PMP70-GFP HEK293T cells. Arrowheads indicate the size shift of the tagged PMP70-GFP. (B) Schematic of the peroxisome biogenesis regulators screen. CRISPR/Cas9 PMP70-GFP HEK293T cells were incubated in control or 1 μM of small molecules for 2 days. PEX3 overexpression was used as a negative control, and PEX19 overexpression was used as a positive control. Refer to Fig. S1, F and G, and Figs. S2 and S3 for the screen details. (C) Confocal microscopy of CRISPR/Cas9 PMP70-GFP HEK293T cells overexpressing PEX3-myc, flag-PEX19, or an empty vector. Images are included in Fig. S2 as controls. Quantification shows the number of peroxisomes per square micron of the cytoplasm in the 2D confocal image, mean ± SEM, N = 100 cells pooled from three biological repeats, ***P < 0.001, ****P < 0.0001, Kruskal–Wallis test. (D–E) Confocal microscopy of peroxisomes in human primary fibroblasts AFF11 treated with indicated kinase inhibitors for 2 days (1 μM). Peroxisomes were visualized using PMP70 antibody, and nuclei were stained with Hoechst (10 μg/ml). Representative images are shown; scale bar: 10 μm, *—abnormal nuclear morphology. (E) Quantification shows the number of peroxisomes per square micron of the cytoplasm in the flattened 3D image (indicated as cubic micron), mean ± SEM, N = 100 cells pooled from three biological repeats, **P < 0.01, ***P < 0.001, ****P < 0.0001, Kruskal–Wallis test. (F) Identified kinase inhibitors plotted on the human kinome network (Manning et al., 2002; Metz et al., 2018). Positive regulators (inhibition decreases the number of peroxisomes) are indicated in red, and negative regulators (inhibition increases the number of peroxisomes) are indicated in blue. PKC superfamily is shown in the inlet; G06983 inhibits indicated PKC isoforms. Source data are available for this figure: SourceData F1. OE, overexpressing.
Figure S1.
Figure S1.
Signaling regulators of peroxisome abundance. (A) Schematic of the genomic DNA region corresponding to the end of the human PMP70 open reading frame endogenously tagged with -GFP-polyA-Blasticidin. (B and C) Confocal microscopy of the peroxisomal import marker mCherry*4-SKL expressed in HEK293T PMP70-GFP, and (B) confirmation of the PMP70-GFP peroxisomal localization. Fluorescence intensity profiles through single peroxisomes are shown. Scale bar: 5 μm. (D and E) Comparison of WT and PMP70-GFP–tagged HEK293T. Confocal images and quantification of perimeter (N = 1,000), area (N = 1,000), and density of peroxisomes (N = 100) are shown, mean ± SEM, Mann–Whitney. (F and G) Quantification of the number of peroxisomes per square micron of the cytoplasm in the HEK293T cells treated with 1 μM of the indicated small molecule, mean ± SEM, *P < 0.05, **P < 0.01, ***P < 0.001, ****P < 0.0001, Kruskal–Wallis test. (G)Significant screen hits are plotted, and (F) complete screen. Refer to Figs. S2 and S3 for the confocal images, N = 100 for each molecule. (H) Confocal microscopy of HEK293T CRISPR/Cas9 PMP70-GFP cells overexpressing (OE) PKCα-mCherry, PKCδ-mCherry, or PKCζ-mCherry. Scale bar: 5 μm. See zoomed in images in Fig. 2 B. (I) Western blot of PKCδ in WT and CRISPR/Cas9 KO HEK293T cells. Confocal microscopy (PeroxiSPY555 0.5 μM 10 min), and quantification shows the number of peroxisomes per square micron of the cytoplasm in the 2D confocal image, mean ± SEM, N = 100 pooled from three biological repeats, ns—nonsignificant, Mann–Whitney. Representative images are shown. Scale bar: 5 μm; inlet: 1 μm. Source data are available for this figure: SourceData FS1.
Figure S2.
Figure S2.
Kinase Inhibitor Screen. Confocal microscopy of the HEK293T CRISPR/Cas9 PMP70-GFP cells incubated for 2 days with 1 μM of the indicated small molecule. Note that endogenous levels of PMP70 vary between treatments, as do the numbers of peroxisomes. Scale bar: 5 μm. See Fig. 1 C for the separate channels of control images.
Figure S3.
Figure S3.
Kinase Inhibitor Screen. Confocal microscopy of the HEK293T CRISPR/Cas9 PMP70-GFP cells incubated for 2 days with 1 μM of the indicated small molecule. Note that endogenous levels of PMP70 vary between treatments, as do the numbers of peroxisomes. Scale bar: 5 μm.
Figure 2.
Figure 2.
PKC Delta positively regulates peroxisome abundance. (A) Schematic of different PKC isoforms used in B. (B) Confocal microscopy of HEK293T CRISPR/Cas9 PMP70-GFP cells overexpressing (OE) PKCα-mCherry, PKCδ-mCherry, or PKCζ-mCherry. See zoomed out images in Fig. S1 H. Quantification shows the number of peroxisomes per square micron of the cytoplasm in the 2D confocal image, mean ± SEM, N = 100 cells pooled from three biological repeats, ****P < 0.0001, Kruskal–Wallis test. Scale bar: 5 μm. (C) Confocal microscopy of peroxisomes in human primary fibroblasts AFF11 treated with PMA (0.5 μM) for 1 day. Peroxisomes were visualized using PMP70 antibody, and nuclei were stained with Hoechst (10 μg/ml). Representative images are shown; scale bar: 10 μm. Quantification shows the number of peroxisomes per square micron, mean ± SEM, N = 103 cells pooled from three biological repeats, ****P < 0.0001, Mann–Whitney test. (D) Radioactive peroxisomal FAO measurement using 3H-docosanoic acid in HEK293T WT or PEX19KO in control or Go6983 (5 μM for 48 h) conditions. Quantification shows the number of counts per minute, mean ± SEM, N = 6–12 pooled from three biological repeats, ***P < 0.001, ****P < 0.0001, One-way ANOVA. Source data are available for this figure: SourceData F2. ns, nonsignificant.
Figure 3.
Figure 3.
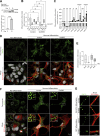
PKC regulation depends on peroxisome division. (A) Schematic of PEX19 complementation assay. (B–D) Confocal microscopy of the peroxisomes in HEK293T WT, PEX19 KO, and PEX19 KO cells overexpressing flag-GFP-PEX19 in control, Go6983 1 μM, and PMA 0.5 μM conditions. Cells were fixed and visualized on identified days. (B) Quantification shows the ratio of cells that restored peroxisomes among the transfected cells. Scale bar: 5 μm. (C) Western blot of PMP70 expression on day 4 of the complementation assay. (E) Confocal microscopy of peroxisomes in HEK293T CRISPR/Cas9 flag-GFP-PEX11b cells treated with 0.5 μM PMA for 2 h. Nuclei were stained with Hoechst (10 μg/ml). Representative images are shown; scale bar: 5 μm; inlet: 1 μm. Quantification shows the number of peroxisomes per square micron of the cytoplasm in the 2D confocal image, mean ± SEM, N = 100, ****P < 0.0001, Mann–Whitney test. (F) Western blot of PEX11b and PMP70 in the WT and CRISPR/Cas9 PMP70-GFP PEX11b KO HEK293T cells. Arrowheads indicate the size shift of the tagged PMP70-GFP. (G and H) Confocal microscopy of peroxisomes in HEK293T CRISPR/Cas9 PMP70-GFP WT and PEX11b KO cells grown in control or Go6983 5 μM conditions. Nuclei were stained with Hoechst (10 μg/ml). Representative images are shown; scale bar: 5 μm; inlet: 1 μm. Quantification shows the number of peroxisomes per square micron of the cytoplasm in the 2D confocal image, mean ± SEM, N = 100 cells pooled from 3 biological repeats, ***P < 0.001, ****P < 0.0001, Kruskal–Wallis test. (I) Confocal microscopy of peroxisomes in HEK293T CRISPR/Cas9 MFF KO cells grown in control or Go6983 5 μM conditions. Western blot shows MFF in WT and MFF KO cells. Nuclei were stained with Hoechst (10 μg/ml). Representative images are shown; scale bar: 5 μm; inlet: 1 μm. (J) Quantification of the length of the extended peroxisomes in HEK293T CRISPR/Cas9 MFF KO cells grown in control or Go6983 5 μM conditions, mean ± SEM, ****P < 0.0001, Mann–Whitney test. Source data are available for this figure: SourceData F3. ns, nonsignificant.
Figure S4.
Figure S4.
PPAR response and pexophagy during PKC regulation. (A) Confocal microscopy of peroxisomes in WT and PEX11b KO HEK293T overexpressing PKCδ-mCherry overexpressing (OE). Peroxisomes were stained with anti-PEX14 antibody. Scale bar: 10 μm. Quantification shows the number of peroxisomes per square micron of the cytoplasm in PEX11b KO cells with and without overexpression of PKCδ-mCherry, mean ± SEM, N = 100 pooled from three biological repeats, ns—nonsignificant, Mann–Whitney. (B) Western blot of PPARα in HEK293T cells in control PMA (0.5 μM for 1 day) and Go6983 (5 μM for 2 days) conditions. Quantification shows the ratio of PPARα to loading control, mean ± SEM, N = 3, ***P < 0.001, *P < 0.05, one-way ANOVA. (C) Quantitative PCR of the peroxisomal genes in HEK293T cells in control and Go6983 5 μM conditions (2-day treatment). Quantification shows color coded relative expression levels calculated as a ΔCt (peroxisomal gene—GAPDH expression reference) and a ratio of Go6983/control expression, expressed as 2−ΔΔCt, mean ± SEM, N = 4, *P < 0.05, Kruskal–Wallis test. (D and E) Confocal microscopy of PPAR mCherry reporter in HEK293T cells expressing PPARα (D) and CHO (E) cells in control, Go6983 (5 μM for 2 days), or PMA conditions (0.5 μM for 1 day). Nuclei were stained with Hoechst (10 μg/ml). Representative images are shown. Scale bar: 5 μm. Quantification shows average fluorescence intensity per cell, N = 50, ****P < 0.0001, Kruskal–Wallis test. (F) Western blot and confocal microscopy of NBR1 and control silencing in HEK293T CRISPR/Cas9 PMP70-GFP cells. Nuclei were stained with Hoechst (10 μg/ml). Representative images are shown. Scale bar: 5 μm; inlet: 1 μm. Quantification of the western blot shows the NBR1/GAPDH ratio quantified by the lane intensity on the western blot, mean ± SEM, N = 3, unpaired t test. Quantification shows the number of peroxisomes per square micron of the cytoplasm in the 2D confocal image, mean ± SEM, N = 150 pooled from three biological repeats, Mann–Whitney. (G) Western blot and confocal microscopy of NBR1/NIX and control silencing in HEK293T cells. Nuclei were stained with Hoechst (10 μg/ml). Representative images are shown. Scale bar: 5 μm. Quantification shows the number of peroxisomes per square micron of the cytoplasm in the 2D confocal image, mean ± SEM, N = 100 pooled from three biological repeats, **** - -<0.0001, one-way ANOVA. (H) Confocal microscopy of peroxisomes stained with anti-PMP70 antibody in WT and VAPB/VAPA KO HeLa cells in control and GFP-VAPB overexpression conditions. Source data are available for this figure: SourceData FS4.
Figure S5.
Figure S5.
Interaction of peroxisome division factors during PKC inhibition. (A) Co-immunoprecipitation of mycPEX11b in control and PKC inhibition conditions (Go6983 5 μM, 24 h). Western blot of mycPEX11b and mCherry-PEX19 in the WT HEK293T cells. Quantification shows the IP to input (I) ratio, mean ± SEM, N = 3. (B) Co-immunoprecipitation of mycPEX11b and peroxisome division factors in control and PKC inhibition conditions (Go6983 5 μM, 24 h). Western blot of mycPEX11b and mCherry-, mCherry-PEX11A, PEX11b, PEX11G, FIS1, DNM1L, MFF, or GDAP1 in the WT HEK293T cells. Quantification shows the IP to input (I) ratio, mean ± SEM, N = 3, ****P < 0.0001. Source data are available for this figure: SourceData FS5.
Figure 4.
Figure 4.
PKC regulates peroxisomeER VAP-dependent interaction through GSK3b inhibition. (A) Quantification of confocal microscopy of peroxisomes stained with anti-PMP70 antibody in WT and VAPB/VAPA KO HeLa cells in control and GFP-VAPB overexpression conditions. Quantification shows the number of peroxisomes per micron square, mean ± SEM, N = 100 cells pooled from three biological repeats, ***P < 0.001, ****P < 0.0001, Kruskal–Wallis test. (B) Confocal microscopy of peroxisomes stained with anti-PMP70 antibody in WT and VAPB/VAPA KO HeLa cells in control Go6983 (5 μM for 48 h). Quantification shows the number of peroxisomes per micron square, mean ± SEM, N = 100, ***P < 0.001, ****P < 0.0001, one-way ANOVA. Western blot confirming the KO is shown. (C) Co-immunoprecipitation of mycACBD5 in control and PKC inhibition conditions (Go6983 5 μM, 24 h); mycACBD5 and GFP or GFP-VAPB were overexpressed in HEK293T cells. Quantification shows the IP to input ratio, mean ± SEM, N = 3, ***P < 0.001, ****P < 0.0001, one-way ANOVA. (D–F) Live cell confocal microscopy of ER and peroxisomes in U2OS cells in control and Go6983 conditions. Quantification shows the ratio of peroxisomes that are not proximal or overlapping with the ER, mean ± SEM, N = 6 pooled from 1,000 peroxisomes in at least 30 cells per condition, **P < 0.01, and a distance traveled by a single peroxisome in 30 s, mean ± SEM, N = 1,000, ****P < 0.0001, unpaired t test with Welch’s correction. (G) Co-immunoprecipitation of GFP-VAPB in control and PKCD-mCherry overexpression conditions in HEK293T cells overexpressing mycACBD5 and GFP-VAPB. Quantification shows the IP to input ratio, mean ± SEM, N = 4, ***P < 0.001, ****P < 0.0001, unpaired t test. (H) Western blot of GSK3β inhibitory S9 phosphorylation in PMA(0.5 μM for 2 h) and Go6983 (5 μM for 4 h) conditions. Quantification shows the ratio of phosphorylated pS9 GSK3β to non-phosphorylated GSK3β, mean ± SEM, N = 4, ***P < 0.001, **P < 0.01, one-way ANOVA. (I) Confocal microscopy of peroxisomes stained with anti-PMP70 antibody in HEK293T control or overexpression of GSK3β S9A mutant in control or PMA (0.5 μM for 4 h) conditions. (I) Quantification shows the number of peroxisomes per micron square, mean ± SEM, N = 100 pooled from three biological repeats, ****P < 0.0001, Welch ANOVA. (J) Model of PKC regulation of peroxisome– ER interaction. Source data are available for this figure: SourceData F4. OE, overexpressing; ns, nonsignificant; coIP, co-immunoprecipitation.
Figure 5.
Figure 5.
PKC regulates peroxisome abundance in neurons. (A) Schematic of the SH-SY5Y neuronal differentiation. (B) PKC activity in the non-differentiated and 18-day differentiated SH-SY5Y cells. Quantification shows PKC activity, mean ± SEM, N = 10, ****P < 0.0001, Mann–Whitney test. (C) Western blot of β-3 tubulin in the non-differentiated and 18-day differentiated SH-SY5Y cells in control and Go6983 1 μM conditions. Go6983 was added on days 10–18 of the differentiation protocol. Quantification shows the ratio of and β-3 tubulin to GAPDH, mean ± SEM, N = 3, ****P < 0.0001, one-way ANOVA. (D) PKC activity in the 18-day differentiated SH-SY5Y cells in control and Go6983 1 μM conditions. Go6983 was added on days 10–18 of the differentiation protocol. Quantification shows PKC activity, mean ± SEM, N = 10, *P < 0.05, Mann–Whitney test. (E and F) Confocal microscopy of peroxisomes in the non-differentiated and 18-day differentiated SH-SY5Y cells in control and Go6983 1 μM conditions. Go6983 was added on days 10–18 of the differentiation protocol. Peroxisomes were visualized with the PMP70 antibody, nuclei were stained with Hoechst (10 μg/ml), and neuronal differentiation was visualized with β-3 tubulin antibody. Representative images are shown. Scale bar: 5 μm; inlet: 1 μm. See zoomed out images in Fig. S6 D. (F) Quantification shows the number of peroxisomes per square micron of the cytoplasm in the 2D confocal image, mean ± SEM, N = 102 cells pooled from three biological repeats, ****P < 0.0001, Kruskal–Wallis test. (G) Schematic of the neuronal progenitor cells (NPCs) neuronal differentiation. (H) PKC activity in the non-differentiated and 12-day differentiated NPCs. Quantification shows PKC activity, mean ± SEM, N = 8, ****P < 0.0001, Mann–Whitney test. (I) PKC activity in the 12-day differentiated NPCs in control and Go6983 1 μM conditions. Go6983 was added on days 1–12 of the differentiation protocol. Quantification shows PKC activity, mean ± SEM, N = 8, **P < 0.01, Mann–Whitney test. (J) Quantification of the number of peroxisomes per square micron of the cytoplasm in the 2D confocal image in the non-differentiated and 12-day differentiated NPCs in control and Go6983 1 μM conditions. Go6983 was added on days 1–12 of the differentiation protocol, mean ± SEM, N = 90 cells pooled from three biological repeats, ****P < 0.0001, one-way ANOVA. (K) Model of PKC regulation of peroxisome abundance. Source data are available for this figure: SourceData F5. ns, nonsignificant.
Figure S6.
Figure S6.
Positive regulation of neuronal peroxisome abundance by PKC. (A) Western blot of β-3 tubulin in the non-differentiated and 18-day differentiated SH-SY5Y. Quantification shows the ratio of and β-3 tubulin to GAPDH, mean ± SEM, N = 3, ****P < 0.0001, unpaired t test. (B and C) Quantitative PCR of the neuronal markers and PKC isoforms in the (B) 18-day differentiated SH-SY5Y cells in control and Go6983 1 μM conditions; Go6983 was added on days 10–18 of the differentiation protocol. Quantification shows the relative expression of differentiated/non-differentiated markers, expressed as 2−ΔΔCt, mean ± SEM, N = 4, *P < 0.05, Kruskal–Wallis test, and (C) comparison of day 0 and 18 expression, mean ± SEM, N = 4, *P < 0.05, **P < 0.01, ****P < 0.0001, one-way ANOVA. (D) Confocal microscopy of peroxisomes in the non-differentiated and 18-day differentiated SH-SY5Y cells in control and Go6983 1 μM conditions. Go6983 was added on days 10–18 of the differentiation protocol. Peroxisomes were visualized with the PMP70 antibody, nuclei were stained with Hoechst (10 μg/ml), and neuronal differentiation was visualized with β-3 tubulin antibody. Representative images are shown. Scale bar: 5 μm. See zoomed in images in Fig. 5 F. (E) Quantitative PCR of the neuronal markers in the 12-day differentiated NPCs. Quantification shows the relative expression of differentiated/non-differentiated markers, expressed as 2−ΔΔCt, mean ± SEM. (F) Confocal microscopy of peroxisomes in the non-differentiated and 12-day differentiated NPCs in control and Go6983 1 μM conditions. Go6983 was added on days 1–12 of the differentiation protocol. Peroxisomes were visualized with the PMP70 antibody, nuclei were stained with Hoechst (10 μg/ml), and neuronal differentiation was visualized with β-3 tubulin antibody. Representative images are shown. Scale bar: 5 μm; inlet: 1 μm. (G) Confocal microscopy of peroxisomes in the neuronal terminals of the 18-day differentiated SH-SY5Y and 12-day differentiated NPCs in control and Go6983 1 μM conditions. Peroxisomes were visualized with the PMP70 antibody, and neuronal terminals were visualized with β-3 tubulin antibody. Representative images are shown. Scale bar: 5 μm. Source data are available for this figure: SourceData FS6.

Similar articles

References

    1. Abe, S., Nagai T., Masukawa M., Okumoto K., Homma Y., Fujiki Y., and Mizuno K.. 2017. Localization of protein kinase NDR2 to peroxisomes and its role in ciliogenesis. J. Biol. Chem. 292:4089–4098. 10.1074/jbc.M117.775916 - DOI - PMC - PubMed
    1. Adams, S.T., Jr., and Miller S.C.. 2020. Enzymatic promiscuity and the evolution of bioluminescence. FEBS J. 287:1369–1380. 10.1111/febs.15176 - DOI - PMC - PubMed
    1. Agrawal, G., and Subramani S.. 2016. De novo peroxisome biogenesis: Evolving concepts and conundrums. Biochim. Biophys. Acta. 1863:892–901. 10.1016/j.bbamcr.2015.09.014 - DOI - PMC - PubMed
    1. Alexander, A., Kim J., Cai S.-L., Kastan M., Sahin M., and Walker C.. 2008. mTOR signaling is regulated by TSC2 at the peroxisome. Cancer Res. 68:2729.
    1. Alkon, D.L., Sun M.K., and Nelson T.J.. 2007. PKC signaling deficits: A mechanistic hypothesis for the origins of Alzheimer's disease. Trends Pharmacol. Sci. 28:51–60. 10.1016/j.tips.2006.12.002 - DOI - PubMed

LinkOut - more resources