. 2025 Aug 26;44(8):116031.
doi: 10.1016/j.celrep.2025.116031. Epub 2025 Jul 20.

PPM1M, an LRRK2-counteracting, phosphoRab12-preferring phosphatase with a potential link to Parkinson's disease

Affiliations

PPM1M, an LRRK2-counteracting, phosphoRab12-preferring phosphatase with a potential link to Parkinson's disease

Claire Y Chiang et al. Cell Rep. .

Abstract

Leucine-rich repeat kinase 2 (LRRK2) phosphorylates a subset of Rab GTPases that regulate receptor trafficking, and LRRK2-activating mutations are linked to Parkinson's disease. Rab phosphorylation is a transient event that can be reversed by phosphatases, including protein phosphatase, Mg2+/Mn2+ dependent 1H (PPM1H), which acts on phosphorylated Rab 8A (phosphoRab8A) and phosphoRab10. Here, we report a phosphatome-wide small interfering RNA (siRNA) screen that identified PPM1M as a phosphoRab12-preferring phosphatase that also acts on phosphoRab8A and phosphoRab10. Upon knockout from cultured cells or mice, PPM1M displays selectivity for phosphoRab12. As shown previously for mice harboring LRRK2 pathway mutations, knockout of Ppm1m leads to primary cilia loss in striatal cholinergic and parvalbumin interneurons. We also identified a rare PPM1M mutation in patients with Parkinson's disease that is catalytically inactive when tested in vitro and in cells. These findings identify PPM1M as a key player in the LRRK2 signaling pathway and provide a new therapeutic target for the possible benefit of patients with Parkinson's disease.

Keywords: CP: Cell biology; CP: Neuroscience; LRRK2 kinase; Parkinson’s disease; Rab GTPase; phosphatase; primary cilia.


Conflict of interest statement

Declaration of interests P.B. and C.B. are employees of CENTOGENE GmbH (Rostock, Germany).

Figures

Figure 1.
Figure 1.. PPM1H knockout does not influence the rate of phosphoRab turnover
(A) Immunoblot analysis of wild-type (WT) and PPM1H knockout (KO) A549 cells treated with 100 nM MLi-2 for the times indicated. Mass is shown on the left in kDa here and in all subsequent figures; antigens are indicated on the right. (B) Quantitation of phosphoRab10 (pRab10)/total Rab10 and phosphoRab12 (pRab12)/total Rab12 levels from immunoblots in (A), normalized to 1.0 for respective pRab10 or pRab12 WT 0 min conditions, as indicated. (C) Quantitation of pRab10/total Rab10 and pRab12/total Rab12 levels from immunoblots in (A), normalized to 1.0 for 0 min of each respective (WT or KO) condition to permit direct comparison. Error bars represent SEM from 3 independent experiments carried out in duplicate.
Figure 2.
Figure 2.. Phosphatome-wide siRNA screen in 3T3 cells reveals PPM1M as a phosphoRab12-preferring phosphatase
(A) Schematic describing screen workflow. (B and C) Summary plot of (B) pRab12/total Rab12 or (C) pRab10/total Rab10 levels after 72 h siRNA and 20 min MLi-2 treatment, normalized to non-targeting (NT) control without MLi-2 treatment. The top 5 hits for each pRab are indicated. (D and E) Repeat immunoblots of the lysates of the top 10 hits from (B) for pRab12 and from (C) for pRab10. The NT+MLi-2 condition is treatment with 100 nM MLi-2 for 20 min, and the MLi-2, 2h condition is treatment with 100 nM MLi-2 for 2 h.
Figure 3.
Figure 3.. PPM1M overexpression preferentially decreases phosphoRab12 compared with phosphoRab10
(A) Immunoblot analysis of HEK293 cells over-expressing FLAG-LRRK2 R1441C and HA-empty or HA-tagged PPM1H, PPM1H H153D, PPM1H D288A, PPM1M, PPM1M H127D, or PPM1M D235A. Cells were treated with 200 nM MLi-2 for 2 h where indicated. (B and C) Quantitation of (B) pRab12/total Rab12 and (C) pRab10/total Rab10 levels from immunoblots in (A), normalized to 1.0 for HA-empty. Error bars indicate SEM from two independent experiments analyzed in duplicate. Statistical significance was determined by one-way ANOVA, relative to HA-empty. For pRab10, ***p = 0.0002 for PPM1H WT, **p = 0.0097 for PPM1H H153D, ****p < 0.0001 for PPM1H D288A, **p = 0.0044 for PPM1M WT, and **p = 0.0014 for PPM1M D235A. For pRab12, ****p < 0.0001 for PPM1H WT, PPM1H H153D, and PPM1M WT and ***p = 0.0002 for PPM1H D288A.
Figure 4.
Figure 4.. Knockout of PPM1 subfamily phosphatases in MEF cells and tissues confirms PPM1M substrate preferences
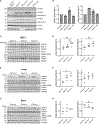
(A) Immunoblot analysis of parental (wild-type) and PPM1H, PPM1M, and PPM1J pooled knockouts in MEF cells. (B) Quantitation of pRab12/total Rab12 and pRab10/total Rab10 levels from immunoblots in (A), normalized to 1.0 for parental. Error bars indicate SEM from two independent experiments analyzed in duplicate. Statistical significance was determined by one-way ANOVA, respective to parental. For pRab10, *p = 0.0122 for PPM1H knockout. For pRab12, *p = 0.0117 for PPM1M knockout. (C) Immunoblot analysis of mouse embryonic fibroblasts (MEFs) derived from Ppm1m wild-type (Ppm1m+/+), heterozygous knockout (Ppm1m+/−), or homozygous knockout (Ppm1m−/−) mice. (D) Quantitation of pRab12/total Rab12 and pRab10/total Rab10 levels from immunoblots in (C), normalized to 1.0 for the highest value. Each dot represents the average of two independent replicates from one mouse. Statistical significance was determined by one-way ANOVA. For pRab10, **p = 0.0036 and for pRab12, *p = 0.0399 and **p = 0.0029. (E) Immunoblot analysis of lung lysates from mice as in (C). (F) Quantitation of immunoblots in (E), normalized as in (D). Each dot represents the average of three independent replicates from one mouse. Statistical significance was determined by one-way ANOVA. For pRab12, *p = 0.0335. (G) Immunoblot analysis of whole-brain lysates from mice as in (C). (H) Quantitation from immunoblots in (G) as in (D). Statistical significance was determined by Kruskal-Wallis test for pRab10 and one-way ANOVA for pRab12. For pRab10, *p = 0.0349.
Figure 5.
Figure 5.. PPM1H and PPM1M flap domains are necessary for proper substrate recognition
(A) AlphaFold modeling of PPM1M (blue) and pRab12 (magenta). The PPM1M flap domain is shown in navy; phosphoserine 106 of the pRab12 substrate is indicated at the metal-containing PPM1M active site. (B) Diagram of PPM1H and PPM1M swapped flap domain constructs. (C) Immunoblot analysis of HEK293 cells overexpressing FLAG-LRRK2 R1441C and HA-empty or HA-tagged PPM1H, PPM1M, PPM1H with PPM1M flap domain (PPM1H_M flap), or PPM1M with PPM1H flap domain (PPM1M_H flap). (D) Quantitation of pRab12/total Rab12 and pRab10/total Rab10 levels from immunoblots in (C), normalized to 1.0 for HA-empty. Error bars indicate SEM from four independent experiments analyzed in duplicate. Statistical significance was determined by one-way ANOVA, respective to HA-empty. ****p < 0.0001.
Figure 6.
Figure 6.. Ppm1m knockout phenocopies hyperactive Lrrk2 ciliation phenotype
(A) Example confocal immunofluorescence micrographs of sections of the dorsal striatum from 3-month-old wild-type or Ppm1m−/− mice; scale bar, 10 μm. Cholinergic interneurons were labeled using anti-choline acetyltransferase (ChAT) antibody (green), and primary cilia were labeled using anti-AC3 (adenylate cyclase 3) antibody (magenta; yellow arrowhead). Nuclei were labeled using DAPI (blue). (B) Quantitation of ChAT+ neurons containing a cilium. (C) Example confocal immunofluorescence micrographs of sections of the dorsal striatum from 3-month-old wild-type or Ppm1m−/− mice; scale bar, 10 μm. Parvalbumin neurons were labeled using anti-parvalbumin (PV) antibody (green); cilia and nuclei are labeled as in (A). (D) Quantitation of parvalbumin neurons containing a cilium. (E) Quantitation of surrounding, ChAT (mostly medium spiny) neurons containing a cilium. For (B), (D), and (E), error bars represent SEM from six individual brains per group, 2–3 sections per mouse. >36 ChAT+ neurons, >37 PV+ neurons, and >500 ChAT cells were scored per mouse. Statistical significance was determined using an unpaired t test. ***p = 0.0001 for cholinergic neurons, ***p = 0.0002 for parvalbumin neurons, and ns p = 0.3835 for medium spiny neurons.
Figure 7.
Figure 7.. Patient with Parkinson’s disease linked to PPM1M D440N mutation
(A) Individuals genotyped for the c.1318G>A p.D440N mutation are indicated as D440N+/−. In the case of II-4, the mutation was inferred from its presence in both of his children, III-3 and III-4, and is shown in parentheses (D440N+/−). A second-degree cousin of II-3 and II-4 also had PD but did not carry the D440N variant. The shared common ancestors of this individual with II-2 and II-4 are their great-grandparents (the grandparents of I-2, not shown in the pedigree). No clinical phenotype information for any of the members of generation III was available. (B) AlphaFold 3 modeling of D440 in the PPM1M (blue) active site shown with pRab12 (magenta, residues 38–222). Inset shows enlarged view of PPM1M D440 and Rab12 pS106. (C) Immunoblot analysis of HEK293 cells overexpressing FLAG-LRRK2 R1441G and HA-empty, HA-PPM1M WT, HA-PPM1M H127D, and HA-PPM1M D440N, with untransfected (UT) control. MLi-2 (200 nM) treatment was for 90 min as indicated. (D) Quantitation of pRab12/total Rab12 and pRab10/total Rab10 levels from immunoblots in (C), normalized to HA-empty. Error bars indicate SD from three independent experiments carried out in duplicate. Statistical significance was determined by Welch’s t test, followed by Benjamini-Hochberg correction for multiple comparisons, respective to HA-empty. ***p = 0.00011 for pRab12 - PPM1M D440N, ***p = 0.00078 for pRab10 - PPM1M H127D, and ****p < 0.0001 otherwise.

Update of

References

    1. Billingsley KJ, Bandres-Ciga S, Saez-Atienzar S, and Singleton AB (2018). Genetic risk factors in Parkinson’s disease. Cell Tissue Res 373, 9–20. 10.1007/s00441-018-2817-y. - DOI - PMC - PubMed
    1. Khani M, Cerquera-Cleves C, Kekenadze M, Wild Crea P, Singleton AB, and Bandres-Ciga S (2024). Towards a Global View of Parkinson’s Disease Genetics. Ann. Neurol 95, 831–842. 10.1002/ana.26905. - DOI - PMC - PubMed
    1. Cook L, Verbrugge J, Schwantes-An TH, Schulze J, Foroud T, Hall A, Marder KS, Mata IF, Mencacci NE, Nance MA, et al. (2024). Parkinson’s disease variant detection and disclosure: PD GENEration, a North American study. Brain 147, 2668–2679. 10.1093/brain/awae142. - DOI - PMC - PubMed
    1. Westenberger A, Skrahina V, Usnich T, Beetz C, Vollstedt EJ, Laabs BH, Paul JJ, Curado F, Skobalj S, Gaber H, et al. (2024). Relevance of genetic testing in the gene-targeted trial era: the Rostock Parkinson’s disease study. Brain 147, 2652–2667. 10.1093/brain/awae188. - DOI - PMC - PubMed
    1. Alessi DR, and Sammler E (2018). LRRK2 kinase in Parkinson’s disease. Science 360, 36–37. 10.1126/science.aar5683. - DOI - PubMed

MeSH terms

Substances