

Cost-effectiveness of adding measurement of Chlamydia trachomatis infection and serology to trachoma prevalence surveys in Tanzania and Mozambique
- PMID: 40690534
- PMCID: PMC12310039
- DOI: 10.1371/journal.pntd.0013257
Cost-effectiveness of adding measurement of Chlamydia trachomatis infection and serology to trachoma prevalence surveys in Tanzania and Mozambique
Abstract
Background: Accurate methods to measure trachoma prevalence are critical to monitor progress and guide mass drug administration as countries near elimination. Currently, countries conduct trachoma prevalence surveys via clinical examination using the simplified trachoma grading system. Grading can have reduced accuracy in low prevalence settings, potentially resulting in errors. Adding ocular swabbing and Chlamydia trachomatis (Ct) infection testing and dried blood spot (DBS) collection and testing can be more sensitive and specific methods for trachoma identification, with potential cost-saving and information benefits. While previous studies have examined the costs of trachoma prevalence surveys, we present the first costing and cost-effectiveness analysis of enhanced trachoma prevalence surveys with ocular swabs and DBS in addition to grading.
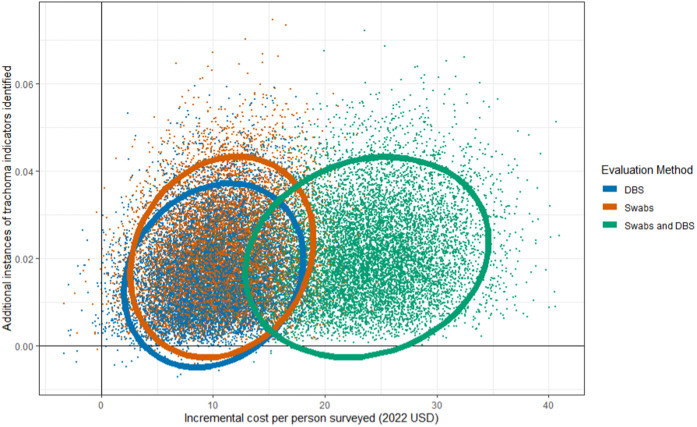
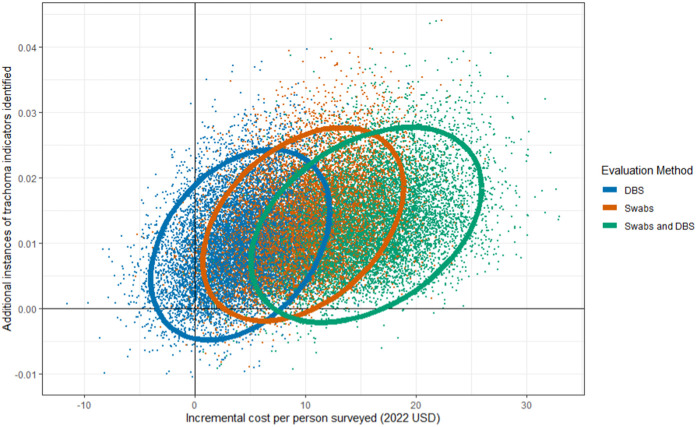
Methodology/principal findings: We calculated the incremental financial cost of enhanced trachoma prevalence surveys with swabs, DBS, and grading using expenditure records from four districts in Tanzania and four districts in Mozambique in 2022. In Tanzania, the cost per cluster of an enhanced survey was $2,337.39 compared to $459.75 for a standard survey. In Mozambique, the cost per cluster of an enhanced survey was $2,147.12, compared to $1,381.46 for a standard survey. We calculated the incremental cost-effectiveness ratio for each method, defined as the ratio of incremental cost to additional instances of trachoma indicators identified, and explored variation in cost-effectiveness via sensitivity analyses. Adding swabs, DBS, or both was cost-increasing and more effective at identification of trachoma indicators than grading alone. In Tanzania, swabs were the most cost-effective method, while DBS was more cost-effective in Mozambique. Swabs and DBS were less cost-effective when combined than individually. The main factor determining cost-effectiveness was sensitivity.
Conclusions/significance: Adding swabs or DBS to trachoma prevalence surveys can be viable, cost-effective methods for identifying trachoma indicators. The additional costs are commensurate with additional information that would support elimination efforts.
Copyright: © 2025 Decker et al. This is an open access article distributed under the terms of the Creative Commons Attribution License, which permits unrestricted use, distribution, and reproduction in any medium, provided the original author and source are credited.
Conflict of interest statement
The authors declare no competing interests exist.
Figures


Similar articles
-
Antibiotics for trachoma.Cochrane Database Syst Rev. 2011 Mar 16;(3):CD001860. doi: 10.1002/14651858.CD001860.pub3. Cochrane Database Syst Rev. 2011. Update in: Cochrane Database Syst Rev. 2019 Sep 26;9:CD001860. doi: 10.1002/14651858.CD001860.pub4. PMID: 21412875 Updated.
-
A rapid and systematic review of the clinical effectiveness and cost-effectiveness of paclitaxel, docetaxel, gemcitabine and vinorelbine in non-small-cell lung cancer.Health Technol Assess. 2001;5(32):1-195. doi: 10.3310/hta5320. Health Technol Assess. 2001. PMID: 12065068
-
Indoor residual spraying for preventing malaria in communities using insecticide-treated nets.Cochrane Database Syst Rev. 2022 Jan 17;1(1):CD012688. doi: 10.1002/14651858.CD012688.pub3. Cochrane Database Syst Rev. 2022. PMID: 35038163 Free PMC article.
-
Face washing promotion for preventing active trachoma.Cochrane Database Syst Rev. 2015 Feb 20;2015(2):CD003659. doi: 10.1002/14651858.CD003659.pub4. Cochrane Database Syst Rev. 2015. PMID: 25697765 Free PMC article.
-
Prevalence of Ocular Chlamydia trachomatis and Active Trachoma among Children in Merhabete District, Amhara, Ethiopia.Am J Trop Med Hyg. 2025 Mar 4;112(5):1091-1095. doi: 10.4269/ajtmh.24-0732. Print 2025 May 7. Am J Trop Med Hyg. 2025. PMID: 40036872
References
-
- World Health Organization. Trachoma. https://www.who.int/news-room/fact-sheets/detail/trachoma. 2023. 2023 August 2.
-
- Amid continued progress, trachoma elimination programmes set their sights on 2030. https://www.who.int/news/item/24-07-2020-amid-continued-progress-trachom.... 2020. 2023 August 2.
-
- Iraq eliminates trachoma as a public health problem. https://www.who.int/news/item/31-07-2023-iraq-eliminates-trachoma-as-a-p.... 2023. 2023 August 9. - PubMed
-
- International Trachoma Initiative. Trachoma Atlas. https://atlas.trachomadata.org/. 2023 March 13.
MeSH terms
LinkOut - more resources
Full Text Sources
